. 2014 Jan;11(1):73-78.
doi: 10.1038/nmeth.2762. Epub 2013 Dec 8.

Refined DNase-seq protocol and data analysis reveals intrinsic bias in transcription factor footprint identification

Affiliations

Refined DNase-seq protocol and data analysis reveals intrinsic bias in transcription factor footprint identification

Housheng Hansen He et al. Nat Methods. 2014 Jan.

Abstract

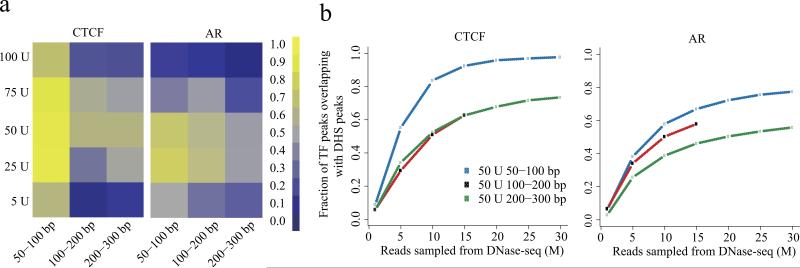
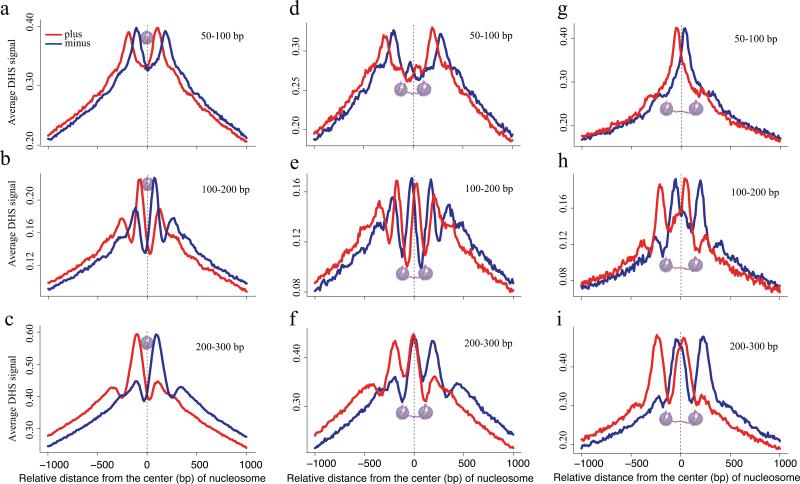
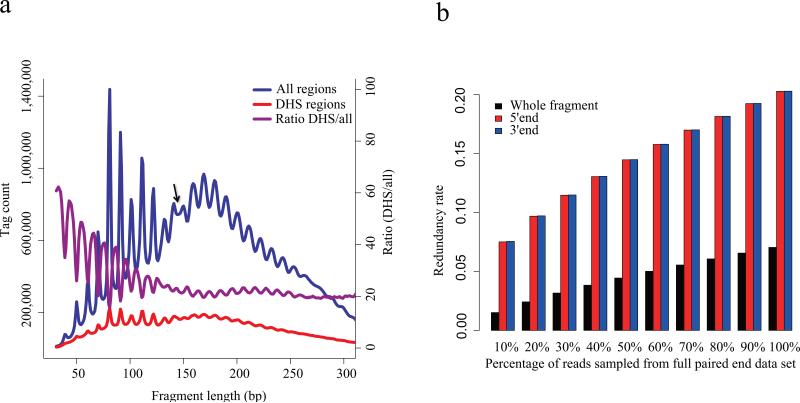
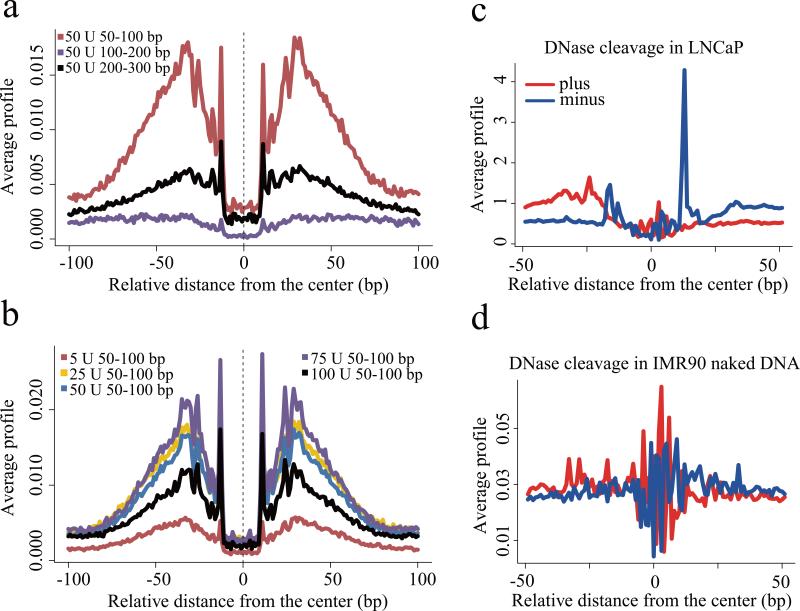
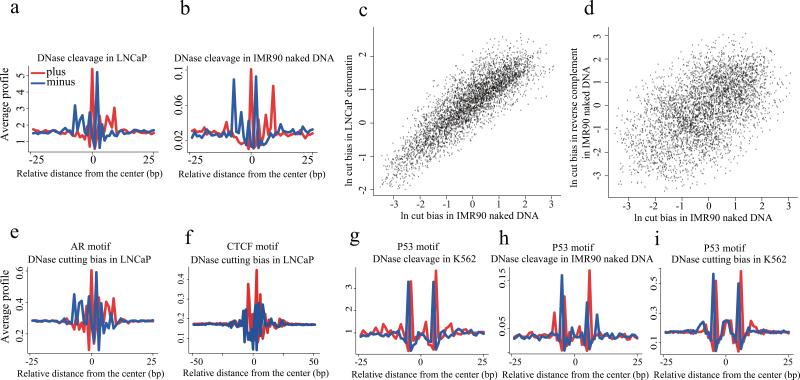
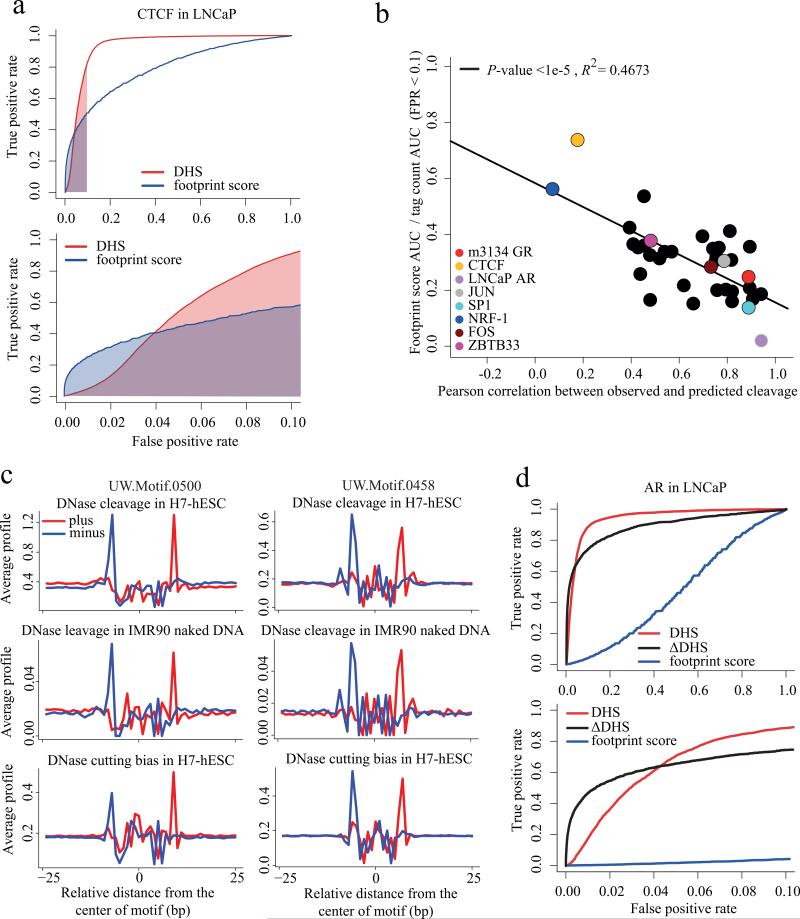
Sequencing of DNase I hypersensitive sites (DNase-seq) is a powerful technique for identifying cis-regulatory elements across the genome. We studied the key experimental parameters to optimize performance of DNase-seq. Sequencing short fragments of 50-100 base pairs (bp) that accumulate in long internucleosome linker regions was more efficient for identifying transcription factor binding sites compared to sequencing longer fragments. We also assessed the potential of DNase-seq to predict transcription factor occupancy via generation of nucleotide-resolution transcription factor footprints. In modeling the sequence-specific DNase I cutting bias, we found a strong effect that varied over more than two orders of magnitude. This indicates that the nucleotide-resolution cleavage patterns at many transcription factor binding sites are derived from intrinsic DNase I cleavage bias rather than from specific protein-DNA interactions. In contrast, quantitative comparison of DNase I hypersensitivity between states can predict transcription factor occupancy associated with particular biological perturbations.


Figures

Figure 1
Figure 1
Effect of digestion level and fragment size on recovering known transcription factor binding sites. (a) Proportion of ChIP-seq enriched regions discovered as DNaseI hypersensitive (DHS) sites for CTCF (left), androgen receptor (AR, center) and FOXA1 (right) in LNCaP cells. As the DNase-seq read depth strongly influences performance, for this comparison 15M reads were sampled from each experimental condition. In each heatmap, rows correspond to the DNaseI enzyme strength and columns represent fragment sizes. The colors represent the proportion of binding sites detected by DNase-seq. (b) Influence of read depth and fragment size on the overlap between TF binding sites and DHS sites. At the 50U strength the performance of the three size fractions are compared across a range of read depths. The results are consistent between different read depths, showing how shallow sampling is informative about the results obtained with deeper sequencing. Diminishing returns in performance with read depth, especially in the case of CTCF, shows that a vast increase in sequencing depth would be required before the 100-200bp and 200-300bp fragments could recover the proportion of CTCF binding sites that can be recovered by the 50-100bp fragments at a read depth of 30M.
Figure 2
Figure 2. Nucleosome positioning effects on DNase-seq results
(a) Schematic figure shows fragments less than 147bp in length, cannot span a nucleosome. (b, c, d) Distribution of DNaseseq tags relative to the center of nucleosomes identified by MNase digestion and H3K4me2 immunoprecipation for (b) 50-100bp, (c) 100-200bp, and (d) 200-300bp fragments in LNCaP. Tags from both the plus and minus strands for the 50-100bp fragments fall in the regions that flank the nucleosome. Plus strand and minus strand mapped ends of (c) 100-200bp and (d) 200-300bp fragments accumulate on opposite sites of the nucleosome. (e) Illustration of the 50-100bp fragments being too long to be contained entirely in the short linker (20-50bp) and too short to span the nucleosomes. (f-h) Distribution of DNase-seq tags from (f) 50-100bp, (g) 100-200bp and, (h) 200-300bp fragments relative to pairs of nucleosomes selected to have short, 20-50bp, inter-nucleosomal linker distances. The 50-100bp fragments (f) show no peak in the linker but rather show peaks on either side of the paired nucleosomes. The longer (g) 100-200bp and (h) 100-300bp fragments show peaks that are consistent with tags spanning each nucleosome in the nucleosome pair. (i-l) Nucleosome pairs with longer, 100-130bp, linkers can accommodate the (j) Short fragments entirely. (k) A minor proportion of the 100-200bp fragments can be accommodated in the linker while the majority span the nucleosome. (l) The 200-300bp fragments cannot be accommodated in the linker but they can still span the nucleosomes.
Figure 3
Figure 3. Pair-end sequencing of DHS
(a) Fragment size distribution of DNase-seq data produced through paired end sequencing. The overall distribution (blue) exhibits an approximately 10.4bp periodicity that is consistent with one complete turn of the double helix. This phenomenon is likely to arise from nucleosomal DNA where DNase cleavage is possible only at exposed sites on the nucleosome. The arrow marks the point at which there is a shift in this periodic pattern. This periodicity is weaker in the distribution of fragment lengths in DHS regions (red). The ratio of fragments in the DHS regions relative to the entire fragment populations (purple) shows that the short fragments are enriched in the DHS regions. The periodicity in this ratio reflects a depletion of nucleosome associated fragments in the DHS regions. (b) Redundancy rate calculated from sampling pair-end DNase-seq data. Whole fragments as determined by the pair-end sequencing of both ends of DNA fragments are far less redundant than the 5’ and 3’ ends taken in isolation from each other.
Figure 4
Figure 4. CTCF footprint
(a) Nucleotide resolution DNase cleavage frequencies across CTCF recognition sequences at CTCF ChIP-seq peaks in LNCaP. DNase-seq signals were normalized to 1M reads in a non-strand specific manner. Short 50-100bp fragments produce clearer cleavage signals than 100-200bp or 200-300bp fragments. (b) DNaseI enzyme strength is most effective for detecting CTCF cleavage patterns in the 25U-75U range. (c) The positional distribution of oriented tags relative to the CTCF motif at CTCF ChIP-seq peaks in LNCaP reveals a strong directionality in the DNaseI cleavage pattern. Heatmaps show cleavage patterns at each locus for plus (red) and minus (blue) strands independently. The heatmap rows are ranked by the total DNase-seq tag count in each 100bp region. (d) The pattern of cleavage across the CTCF recognition sequence in naked DNA derived from the IMR90 cell line is very different from that observed in LNCaP chromatin at CTCF binding sites.
Figure 5
Figure 5. DNaseI cleavage bias as revealed by AR and P53 binding
(a) The pattern of DNase cleavage across AR ChIP-seq enriched AR recognition sequences in the LNCaP cell line. (b) The DNaseI cleavage pattern produced from IMR90 naked DNA using the same AR sites as in (a). (c) The cleavage ratio represents, for each possible DNA hexamer, the number of observed cleavage sites between the 3rd and 4th bases of that hexamer relative to the number of such hexamers in the mappable genome. Cleavage ratios in IMR90 naked DNA are highly correlated with the ratios in LNCaP chromatin, showing consistency in bias across samples. (d) The log of the cleavage ratios for hexamers in DNaseI digested naked DNA and their reverse complements are plotted, showing a broad range of ratios. (e) The DNaseI cleavage pattern predicted from DNA sequence at the AR sites in (a), using the hexamer model of intrinsic DNaseI cleavage bias. (f) The pattern of cleavage predicted from a hexamer model of DNaseI cutting bias at CTCF binding sites in LNCaP. This pattern is similar to that seen in IMR90 naked DNA but different from the DNaseI cleavage pattern in chromatin at CTCF binding sites. (g) The observed DNaseI cleavage pattern in K562 chromatin at imputed p53 binding sites. (h) The DNaseI cleavage pattern produced from IMR90 naked DNA using the same p53 sites as in (g). (i) The DNaseI cleavage pattern predicted from DNA sequence using the hexamer model of intrinsic DNaseI cleavage bias at the p53 sites used in (g). Heatmaps in (a,b,e-i) show cleavage patterns at each locus for plus (red) and minus (blue) strands independently. The heatmap rows are ranked by the total DNase-seq tag count in each 50bp region.
Figure 6
Figure 6. Predicting transcription factor binding from DHS
(a) Receiver-operator curve comparing the performance of the DNase-seq footprint with the absolute DNase-seq tag count (DHS, red). From amongst all CTCF recognition sequences genome wide we predicted the ones that are CTCF ChIP-seq enriched using the DNase-seq footprint score (blue) and the number of DNase-seq tags in a 200bp window centered in the CTCF site (red). Only at low false positive rates (FPR) does the footprint score perform better than the tag count. The footprint score area under the curve (AUC) for FPRs less than 0.1 is shaded blue. Similarly the red shaded region is the AUC for the absolute tag count for FPR < 0.1. (b) For 36 transcription factors with known DNA binding motifs and ChIP-seq we constructed ROC curves like (a). The y-axis represents the footprint score relative to tag count performance as the ratio of the footprint score AUC to the tag count AUC for FPRs < 0.1. For CTCF this is the ratio of blue to red shaded areas in (a). The x-axis represents the Pearson correlation between the observed DNase cleavage pattern and that predicted from the hexamer intrinsic bias model. This shows how the footprint score performance deteriorates as the correlation between observed and predicted cleavage patterns increases. (c) Comparison of observed, predicted and naked DNA cleavage bias in de novo motifs UW.Motif.0500 and UW.Motif.0458. (d) Receiver-operator curve for AR in LNCaP, comparing the performance of the DNase-seq footprint (blue) with the absolute tag count (DHS, red) and the ΔDHS score (black). While the footprint score is uninformative, the ΔDHS score, which compares DNase-seq between hormone stimulated and unstimulated conditions, performs better than the tag count at low FPRs.

Comment in

References

    1. Galas DJ, Schmitz A. DNAse footprinting: a simple method for the detection of protein-DNA binding specificity. Nucleic Acids Res. 1978;5:3157–3170. - PMC - PubMed
    1. Song L, et al. Open chromatin defined by DNaseI and FAIRE identifies regulatory elements that shape cell-type identity. Genome Res. 2011;21:1757–1767. - PMC - PubMed
    1. Boyle AP, et al. High-resolution genome-wide in vivo footprinting of diverse transcription factors in human cells. Genome Res. 2011;21:456–464. - PMC - PubMed
    1. Degner JF, et al. DNase I sensitivity QTLs are a major determinant of human expression variation. Nature. 2012;482:390–394. - PMC - PubMed
    1. Neph S, et al. An expansive human regulatory lexicon encoded in transcription factor footprints. Nature. 2012;489:83–90. - PMC - PubMed

Publication types

Associated data