. 2014 Feb;11(2):183-9.
doi: 10.1038/nmeth.2761. Epub 2013 Dec 8.

Quantifying cell-generated mechanical forces within living embryonic tissues

Affiliations

Quantifying cell-generated mechanical forces within living embryonic tissues

Otger Campàs et al. Nat Methods. 2014 Feb.

Erratum in

  • Nat Methods. 2014 Mar;11(3):349

Abstract

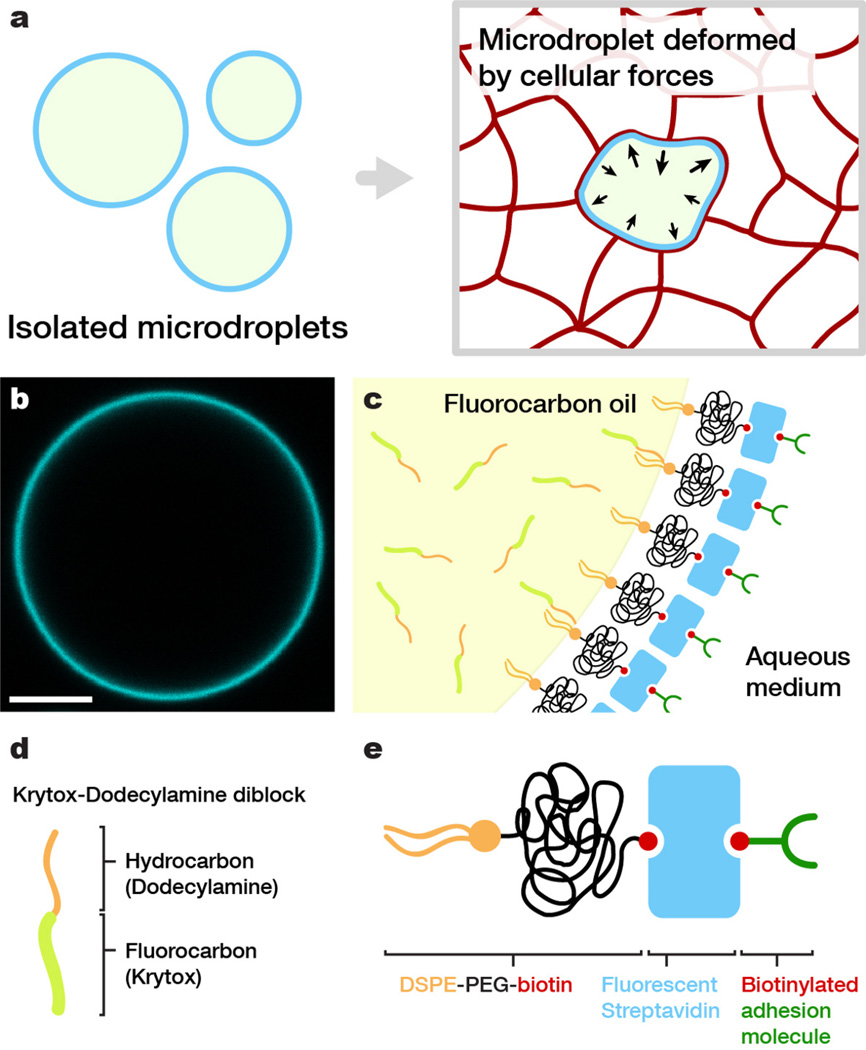
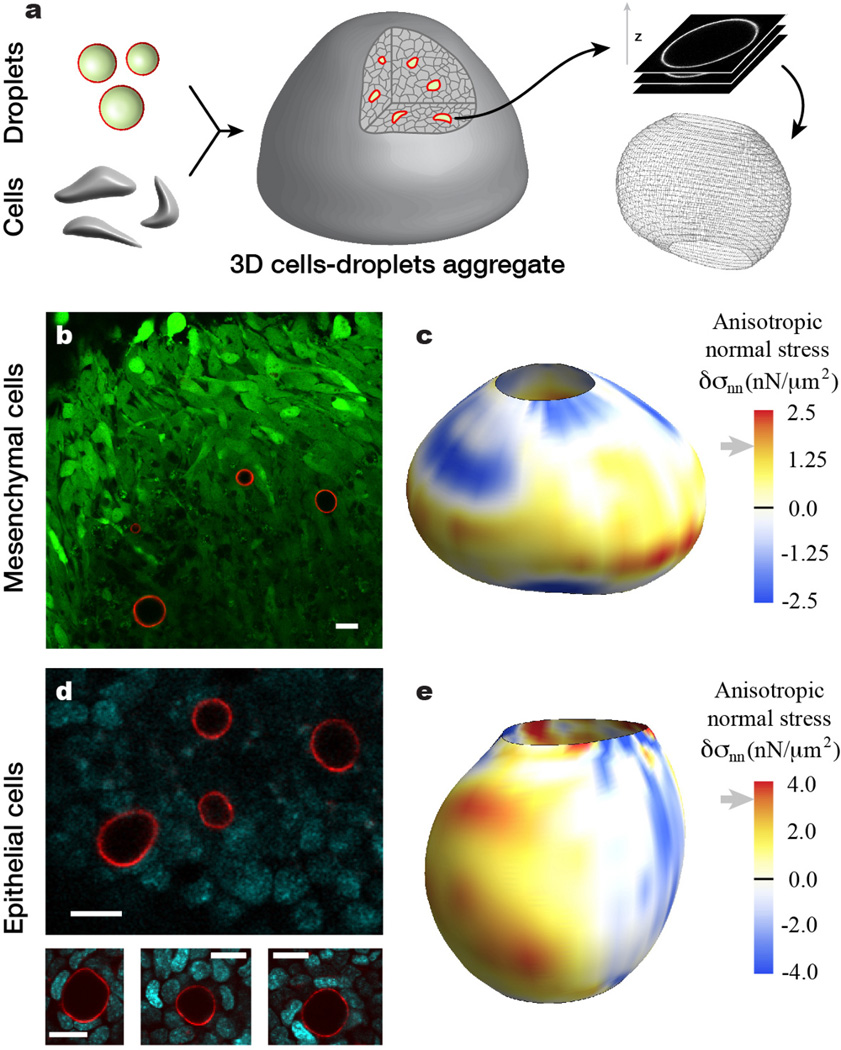
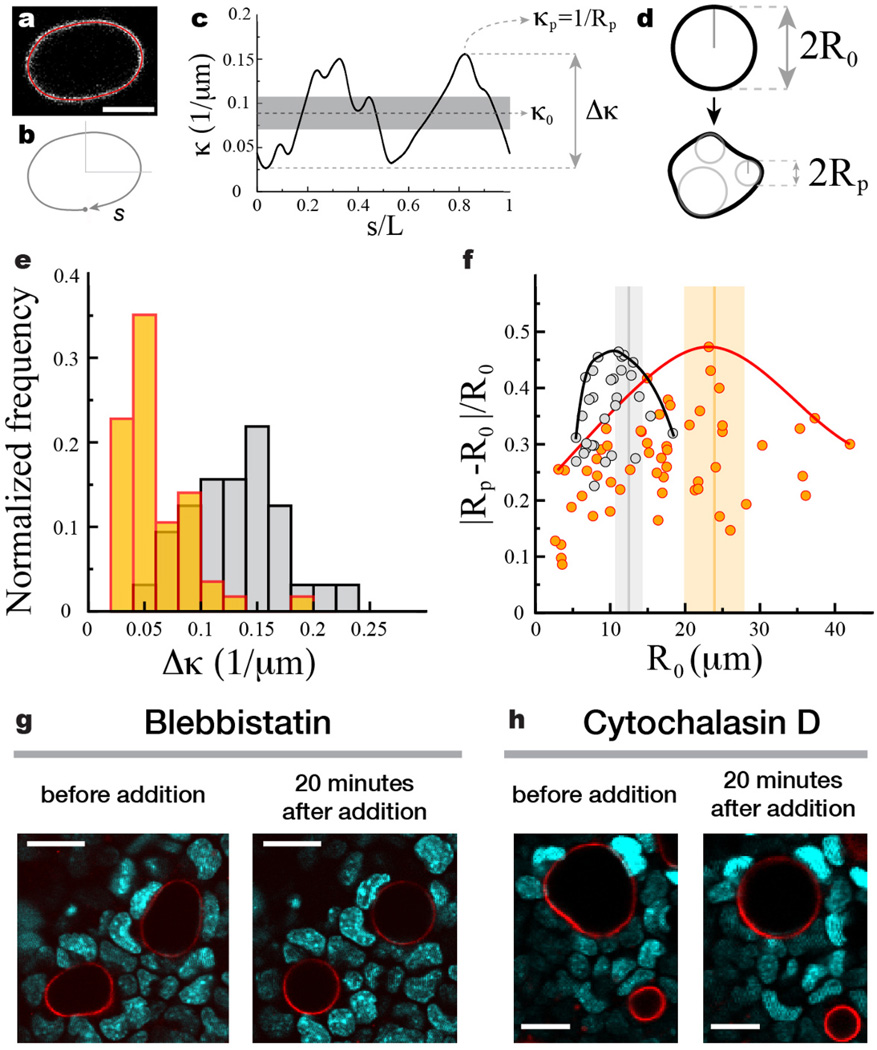
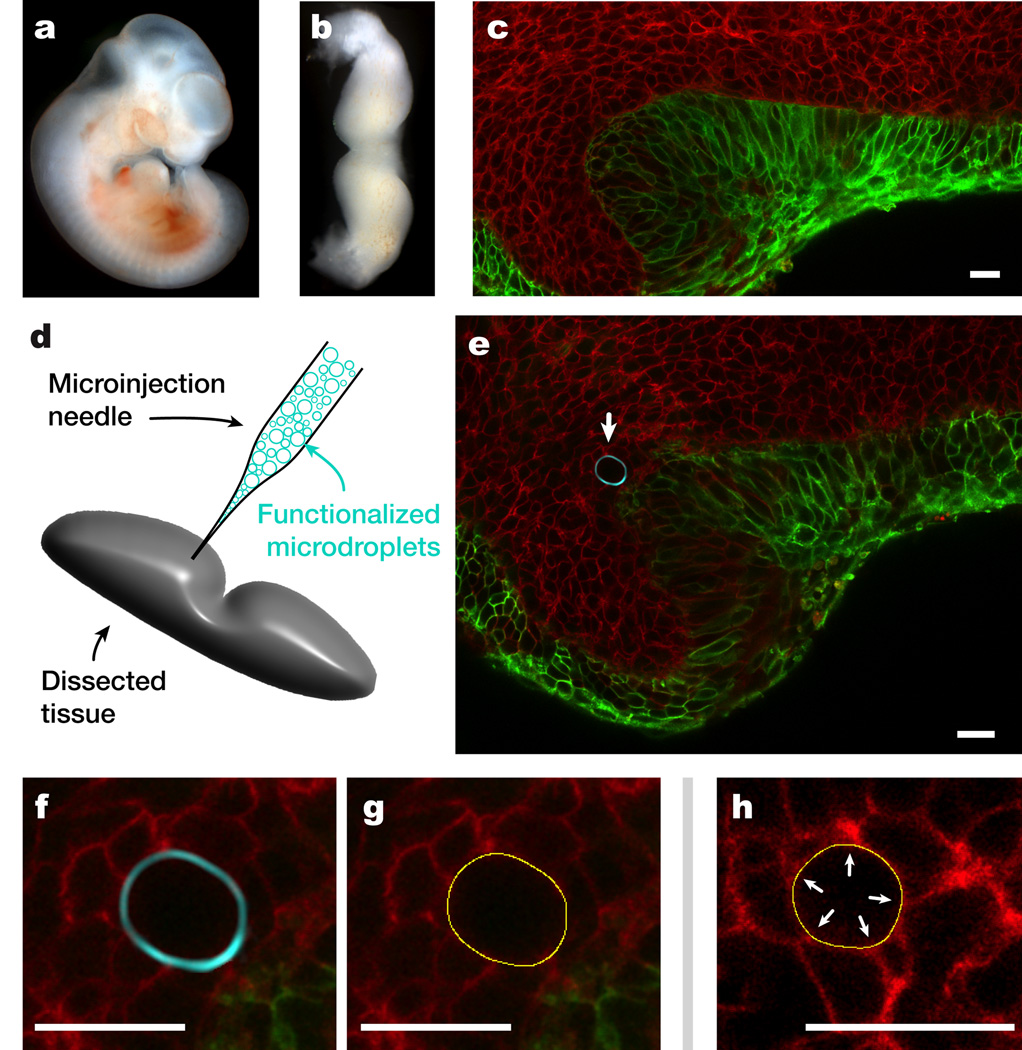
Cell-generated mechanical forces play a critical role during tissue morphogenesis and organ formation in the embryo. Little is known about how these forces shape embryonic organs, mainly because it has not been possible to measure cellular forces within developing three-dimensional (3D) tissues in vivo. We present a method to quantify cell-generated mechanical stresses exerted locally within living embryonic tissues, using fluorescent, cell-sized oil microdroplets with defined mechanical properties and coated with adhesion receptor ligands. After a droplet is introduced between cells in a tissue, local stresses are determined from droplet shape deformations, measured using fluorescence microscopy and computerized image analysis. Using this method, we quantified the anisotropic stresses generated by mammary epithelial cells cultured within 3D aggregates, and we confirmed that these stresses (3.4 nN μm(-2)) are dependent on myosin II activity and are more than twofold larger than stresses generated by cells of embryonic tooth mesenchyme, either within cultured aggregates or in developing whole mouse mandibles.


Figures

Figure 1
Figure 1. Oil microdroplets as force transducers
(a) Sketch of isolated spherical oil droplets in solution (left) and a droplet embedded in-between the cells forming an embryonic tissue (right); the deformation of the droplet is a consequence of local cellular forces. (b) Confocal section of an isolated fluorocarbon oil droplet coated as described in the main text. Droplet surface is fluorescently labeled with Cy5-streptavidin. Bar, 10 µm. (c) Sketch of the interface between fluorocarbon oil and surrounding medium, indicating the different molecules involved in the coating (functionalization) of the droplets. (d) Sketch of fluorocarbon-hydrocarbon (Krytox-Dodecylamine) diblocks used to vary the interfacial tension and (e) surfactant molecules (DSPE-PEG-biotin) used to stabilize and control the surface properties of the droplet.
Figure 2
Figure 2. Measure of cell-generated mechanical stresses in epithelial and mesenchymal cell aggregates
(a) Sketch of cells-droplets aggregate formation. Functionalized droplets and cells are mixed, compacted and cultured to form aggregates. Oil droplet shapes are obtained via high-resolution 3D confocal imaging and their surface coordinates are obtained from image analysis of the data (Online Methods). (b) Confocal section through an aggregate of GFP-positive tooth mesenchymal cells (green) containing fluorocarbon droplets (droplet surface labeled fluorescently; red) coated externally with ligands for integrin receptors. (c) Example of 3D reconstruction of a droplet in a tooth mesenchymal cell aggregate with the values of the anisotropic stresses mapped on the droplet surface. (d) Confocal section through an aggregate of mammary epithelial cells (DNA is visible; cyan) and fluorocarbon droplets coated externally with ligands for E-cadherin receptors. (e) Example of 3D reconstruction of a droplet in a mammary epithelial cell aggregate with the values of the anisotropic stresses mapped on the droplet surface. Gray arrows next to stress scales indicate the average values of the maximal anisotropic stresses obtained from statistics on 2D confocal sections of multiple droplets (see main text). Scale bars, 20 µm.
Figure 3
Figure 3. Ensemble statistics of droplet deformations in cell aggregates using 2D droplet confocal sections
(a) Confocal section of a droplet with the detected droplet contour overlaid (red). (b) The contour is parameterized by its contour length s normalized by the total contour length L. (c) Calculated curvature along the contour. The average curvature, maximal curvature and the difference between the maximal and minimal values of the curvature are defined as κ0, κp and Δκ, respectively. (d) Sketch of undeformed and deformed confocal sections of a droplet with definitions of the droplet average radius of curvature R0 = 1/κ0 and the minimal radius of curvature along the contour Rp = 1/κp. (e) Normalized frequency of Δκ for droplets in aggregates of mammary epithelial cells (gray; N = 32) and tooth mesenchymal cells (orange; N=56). (f) Relative droplet deformation |RpR0|/R0 as a function of the radius R0 of the undeformed droplet section. Solid lines depict the envelope of maximal values of relative droplet deformation (black - epithelial cells; red - tooth mesenchymal cells). The vertical bars indicate the measured values (mean (vertical line) ± standard deviation of the mean (vertical bar)) of cell size in the aggregates (see Supplementary Note 1). (g–h) Effects of inhibition of myosin II and actin polymerization on cellular forces, using (g) Blebbistatin and (h) Cytochalasin D, respectively. Confocal sections through mammary epithelial cell aggregates (DNA is visible; cyan) showing deformed droplets (droplet surface labeled fluorescently; red) before addition of the drugs and 20 minutes after drug addition. Droplets round up as a consequence on myosin II and actin polymerization inhibition. For a time-lapse of the inhibition process see Supplementary Videos 1 and 2.
Figure 4
Figure 4. Measure of cell-generated mechanical stresses in living tooth mandibles
(a) Mouse embryo at 11 days post fertilization (E11). (b) Dissected, living tooth mandible (mandibular arch) at stage E11. (c) Maximal intensity projection of a 3D reconstruction of a fluorescent reporter E13.5 embryonic mouse mandible. Epithelial cells express N-terminal membrane tagged version of EGFP and all other cells express an N-terminal membrane tagged version of tdTomato (Online Methods). (d) Same as in c but showing only the epithelium. The thickening of the epithelium characteristic of tooth bud formation at E13.5 appears as localized increase in the EGFP signal (arrows indicate the location of epithelial thickening). (e) Confocal section of an incisor tooth bud at E13.5. (f) Enlarged region of e showing the boundary between epithelial and mesenchymal cells. (g) Sketch of functionalized droplet micro-injection in a dissected living mandible. (h) Confocal section of an incisor tooth bud with a fluorocarbon droplet (droplet surface labeled fluorescently; cyan) embedded in between cells of the dental mesenchyme. White arrow indicates the location of the droplet. (i) Enlarged region in h showing a close-up of the embedded droplet. (j) Detected pixel-resolution contour (yellow) of droplet in i. (k) Detected pixel-resolution contour (yellow) of a droplet embedded in living tooth mesenchymal tissue showing correspondence between higher curvature regions (arrows) on the droplet surface and cell-cell junctions contacting the droplet. Scale bars, 20 µm, except in c–d, which are 200 µm.
Figure 5
Figure 5. Statistics of droplet deformations in living tooth mandibles
(a) Normalized Δκ frequency for confocal sections of multiple droplets in the dental mesenchyme of living mandibles at E11 (N = 58). Droplet interfacial tension is 4 mN/m. (b) Relative droplet deformation |RpR0|/R0 as a function of the radius R0 of the undeformed droplet section (R0 = 1/κ0). Solid line (black) depicts the envelope for maximal values of relative droplet deformation in E11 living mandibles. The data for droplets in tooth mesenchymal cell aggregates (orange/red; same as in Fig. 3f; droplet interfacial tension is 26 mN/m) is shown for comparison. The vertical bar indicates the measured value (mean (vertical line) ± standard deviation of the mean (vertical bar)) of mesenchymal cell size in living mandibles.

References

    1. Thompson DW. On Growth and Form. Dover reprint of 1942, 2nd ed. (1st ed.) 1917
    1. Mammoto T, Ingber DE. Mechanical control of tissue and organ development. Development. 2010;137:1407–1420. - PMC - PubMed
    1. Wozniak MA, Chen CS. Mechanotransduction in development: a growing role for contractility. Nat. Rev. Mol. Cell Biol. 2009;10:34–43. - PMC - PubMed
    1. Blanchard GB, et al. Tissue tectonics: morphogenetic strain rates, cell shape change and intercalation. Nat. Methods. 2009;6:458-U86. - PMC - PubMed
    1. Butler LC, et al. Cell shape changes indicate a role for extrinsic tensile forces in Drosophila germ-band extension. Nat. Cell Biol. 2009;11:859U181. - PubMed

Methods References

    1. Ashok B, Arleth L, Hjelm RP, Rubinstein I, Ny Ksel H. In vitro characterization of PEGylated phospholipid micelles for improved drug solubilization: Effects of PEG chain length and PC incorporation. Journal of Pharmaceutical Sciences. 2004;93:2476–2487. - PubMed

Publication types

MeSH terms