. 2014 Jan;21(1):88-94.
doi: 10.1038/nsmb.2723. Epub 2013 Dec 8.

Transcription-generated torsional stress destabilizes nucleosomes

Affiliations

Transcription-generated torsional stress destabilizes nucleosomes

Sheila S Teves et al. Nat Struct Mol Biol. 2014 Jan.

Abstract

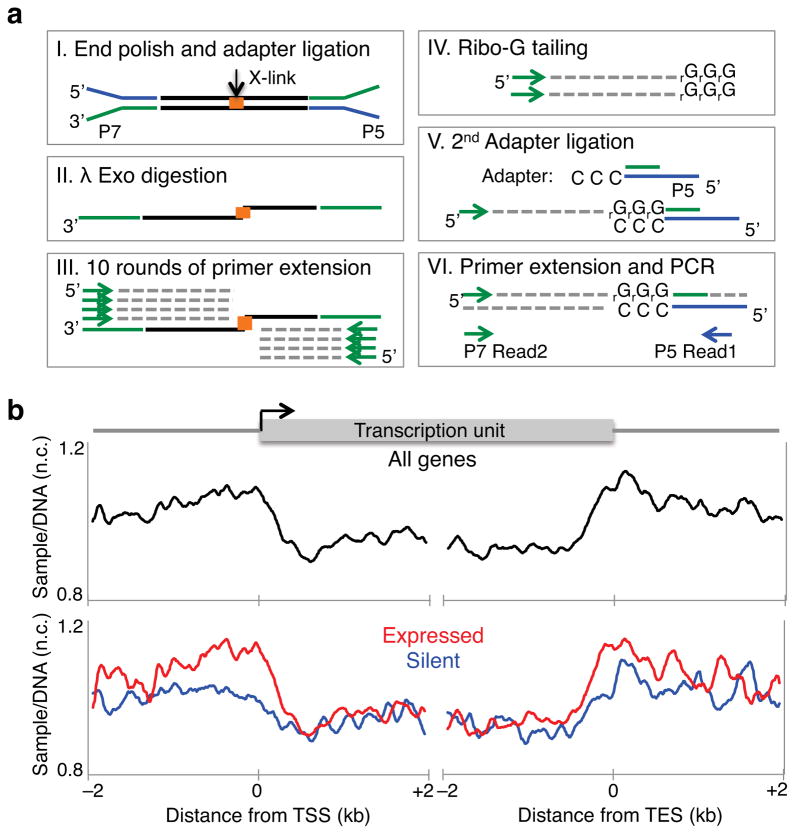
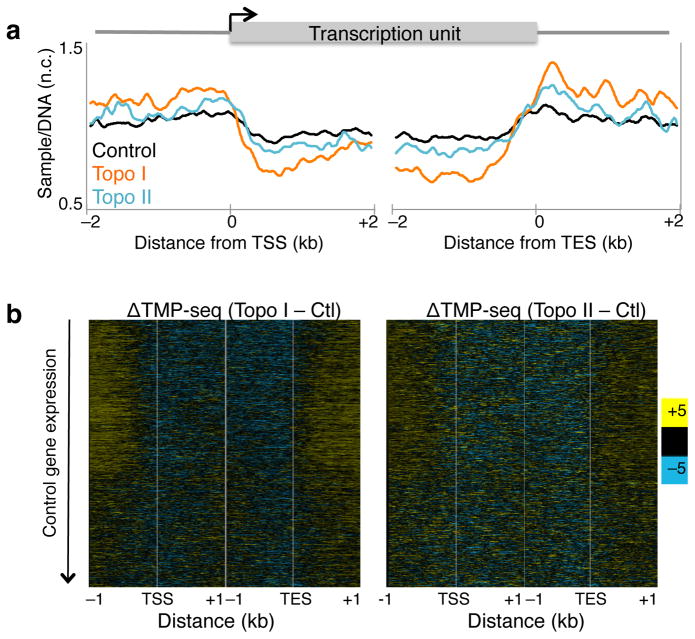
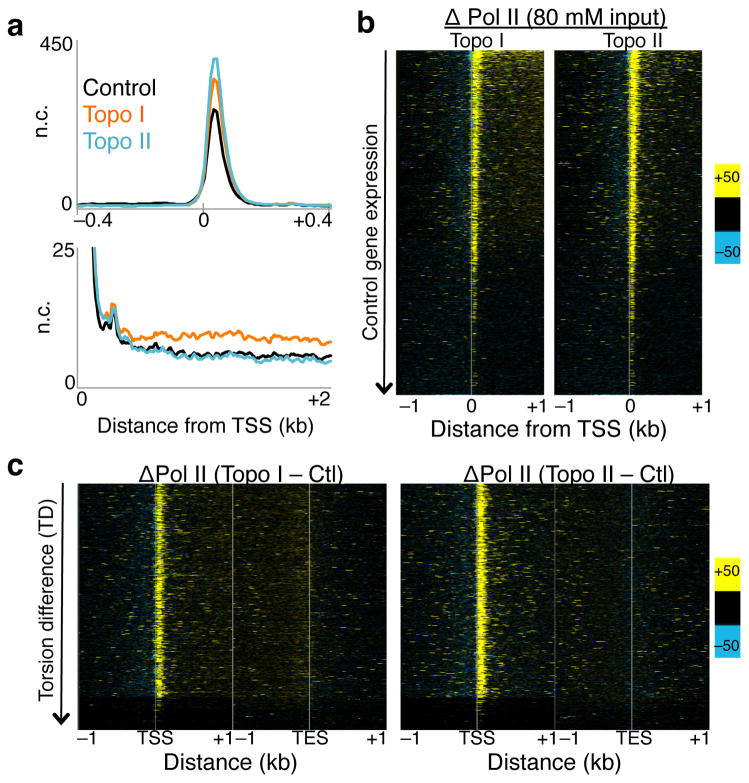
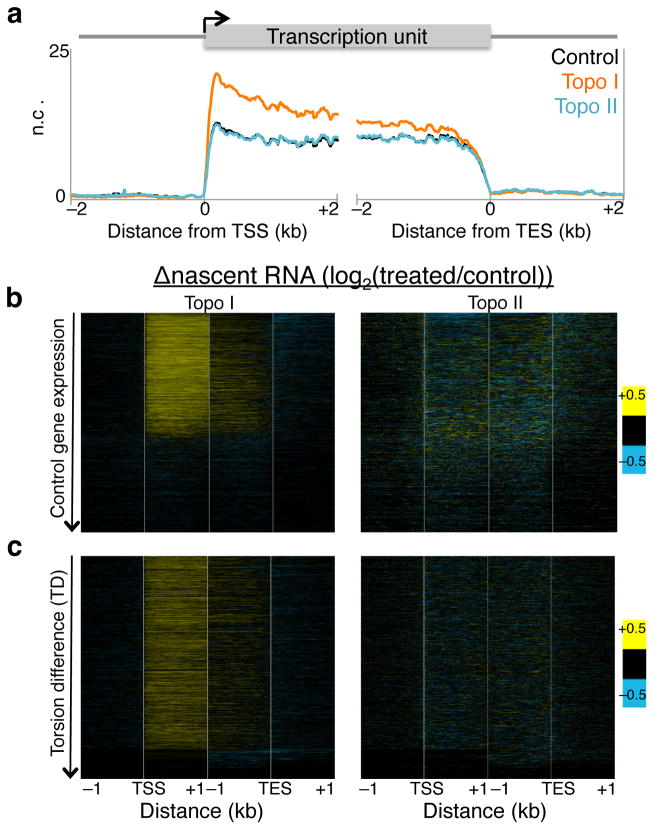
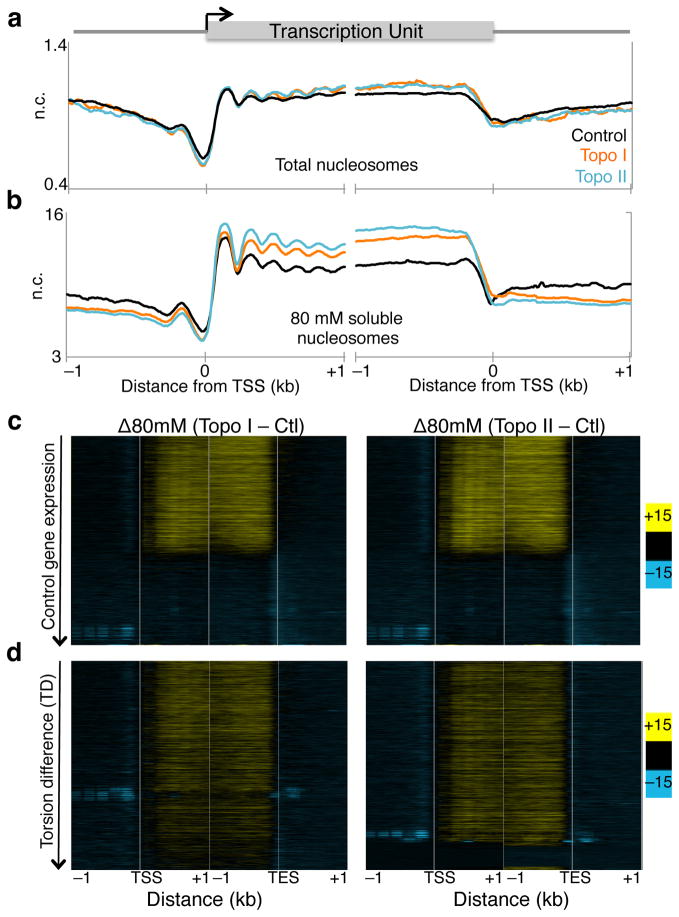
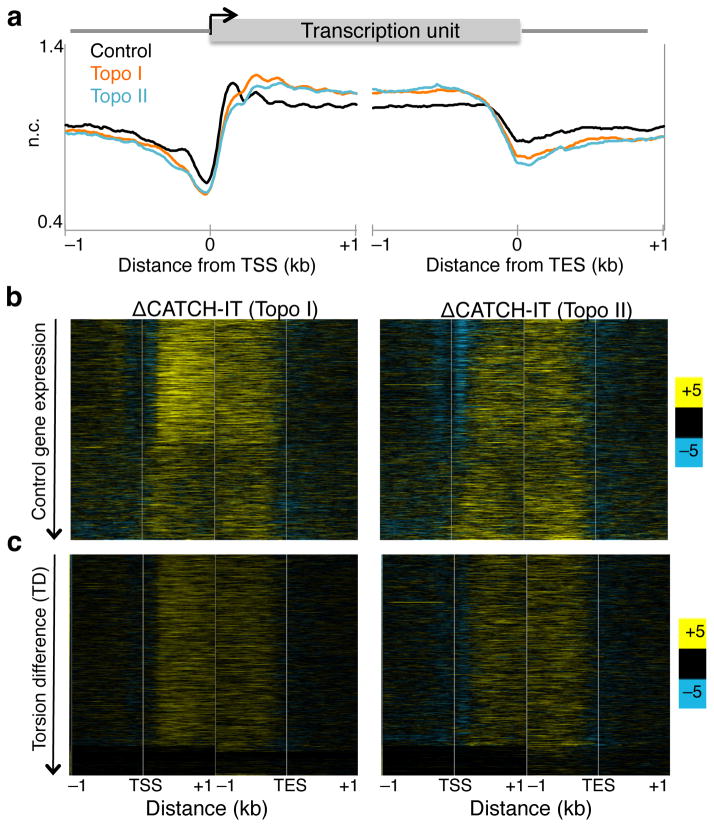
As RNA polymerase II (Pol II) transcribes a gene, it encounters an array of well-ordered nucleosomes. How it traverses through this array in vivo remains unresolved. One model proposes that torsional stress generated during transcription destabilizes nucleosomes ahead of Pol II. Here, we describe a method for high-resolution mapping of underwound DNA, using next-generation sequencing, and show that torsion is correlated with gene expression in Drosophila melanogaster cells. Accumulation of torsional stress, through topoisomerase inhibition, results in increased Pol II at transcription start sites. Whereas topoisomerase I inhibition results in increased nascent RNA transcripts, topoisomerase II inhibition causes little change. Despite the different effects on Pol II elongation, topoisomerase inhibition results in increased nucleosome turnover and salt solubility within gene bodies, thus suggesting that the elongation-independent effects of torsional stress on nucleosome dynamics contributes to the destabilization of nucleosomes.


Figures

Figure 1
Figure 1. High resolution detection of supercoiling states
(a) Strategy for paired-end sequencing of TMP cross-linked DNA fragments. I. Illumina barcoded adapters are ligated to cross-linked fragments. II. The 5′ strand is digested with λ exonuclease. III. Using a primer complementary to the paired-end adapter, 10 rounds of primer extension were performed. IV. Ribo-Gs were added at the 3′ end using Terminal Transferase, V. A double stranded adapter with a 5′ CCC overhang was ligated. VI. One round of primer extension followed by cycles of library amplification were performed. Libraries were sequenced from the CCC overhang end. (b) TMP-seq was performed on control samples with two replicates. Reads were normalized for DNA sequence bias. The average normalized TMP-seq (y-axis Ave. sample/DNA) signal for every 10 bp in a 4 kb region surrounding the transcription start site (TSS) and transcription end site (TES) of all genes is plotted (top), and for expressed and silent genes separately (bottom). n.c. Normalized counts.
Figure 2
Figure 2. Topoisomerase inhibition increases torsional stress genome-wide
(a) TMP-seq was performed on control cells and cells treated with Topo I or II inhibitor with two replicates and samples were normalized for sequence bias. The average normalized signals surrounding the transcription start site (TSS) and transcription end site (TES) were determined. Data for control samples is as represented in Fig. 1b. n.c. Normalized counts. (b) The changes in normalized TMP-seq values were determined by subtracting the control from Topo I- (left) and Topo II- (right) inhibited samples, and were displayed as heat maps with genes ordered by decreasing gene expression in control samples. Contrast = 5. Ctl. control sample
Figure 3
Figure 3. Altered Pol II initiation kinetics upon topoisomerase inhibition
(a) Pol II ChIP-seq, using input from 80 mM salt soluble fraction, was performed on control and treated cells with two replicates. Reads of length 25 – 75 bp were parsed out and mapped onto the genome, and the average signal 800 bp surrounding the transcription start site (TSS) of all genes were determined (top). The same data are shown for the region 2 kb downstream of the TSS (bottom). n.c. Normalized counts. (b) Changes in Pol II signals were determined by subtracting control signals from Topo I- (left), and Topo II-inhibited (right) Pol II ChIP, and values are presented in heat map format with genes arranged by decreasing gene expression in control samples. (c) Heat maps as in (b) arranged by decreasing TD. Contrast = 50. Ctl. control samples.
Figure 4
Figure 4. Altered Pol II elongation kinetics upon topoisomerase inhibition
(a) Nascent RNA-seq was performed on control, Topo I-, and Topo II-inhibited cells, and average profiles were determined for 4 kb surrounding the transcription start site (TSS) and transcription end site (TES) of all genes. A second replicate was performed and analyzed by qPCR (Supplementary Fig. 4c) n.c. Normalized counts. (b) The log-ratio of nascent RNA for Topo I- (left) or II-inhibited (right) samples over control was determined and shown in heat map format with genes ordered by decreasing expression in control samples. (c) Heat maps as in (b) arranged by decreasing TD. Contrast = 0.5.
Figure 5
Figure 5. Topoisomerase inhibition affects low-salt chromatin fractionation
(a) Two replicates of total MNase digested chromatin were sequenced from treated and untreated cells, and the average signal surrounding the transcription start site (TSS) and transcription end site (TES) in all genes for >120 bp reads were plotted. n.c. Normalized counts. (b) Sequenced reads from 80 mM salt soluble fraction for two replicates were mapped onto the genome and the average signals surrounding the TSS and TES were determined. (c) The difference in low-salt soluble signals between control and Topo I- (left), and II-inhibited (right) samples were determined and displayed as heat maps with genes ordered in decreasing expression in control samples for reads of length >120 bp. (c) Heat maps as in (b) arranged by decreasing TD. Contrast = 15.
Figure 6
Figure 6. Altered nucleosome turnover under torsion
(a) Control and treated samples were subjected to CATCH-IT followed by paired end sequencing for two replicates. Mapped reads were averaged surrounding the transcription start site (TSS) and transcription end site (TES) were averaged for all genes. (b) The changes in CATCH-IT values were determined by subtracting the control from Topo I- (left) and Topo II-inhibited (right) signals, and were displayed as heat maps with genes ordered by decreasing expression in control samples. (c) Heat maps as in (b) arranged by decreasing TD. Contrast = 5.
Figure 7
Figure 7. Model for transcription-generated torsional strain and nucleosome turnover
Under normal conditions, RNA Polymerase II (Pol II) generates positive supercoils ahead, and negative supercoils behind, as it elongates a transcript along a gene. Topoisomerases I and II (purple cross labeled I and brown circle labeled II, respectively) mitigate the accumulation of torsional strain. Transcription results in nucleosome turnover and decondensed organization of transcribed nucleosomes. Upon topoisomerase inhibition, torsional strain, both positive and negative, accumulates, resulting in increased Pol II stalling and nucleosome destabilization, as measured by nucleosome turnover and low-salt solubility, within gene bodies. This supports a balance between destabilization of nucleosomes for Pol II passage and maintenance of chromatin structure for chromosomal integrity.

References

    1. Cairns BR. The logic of chromatin architecture and remodelling at promoters. Nature. 2009;461:193–198. - PubMed
    1. Mavrich TN, et al. Nucleosome organization in the Drosophila genome. Nature. 2008;453:358–362. - PMC - PubMed
    1. Zhang Z, Pugh BF. High-resolution genome-wide mapping of the primary structure of chromatin. Cell. 2011;144:175–186. - PMC - PubMed
    1. Izban MG, Luse DS. Factor-stimulated RNA polymerase II transcribes at physiological elongation rates on naked DNA but very poorly on chromatin templates. J Biol Chem. 1992;267:13647–13655. - PubMed
    1. Lorch Y, LaPointe JW, Kornberg RD. Nucleosomes inhibit the initiation of transcription but allow chain elongation with the displacement of histones. Cell. 1987;49:203–210. - PubMed

Publication types

Associated data