. 2014 Jan;21(1):73-81.
doi: 10.1038/nsmb.2718. Epub 2013 Dec 8.

Overlapping chromatin-remodeling systems collaborate genome wide at dynamic chromatin transitions

Affiliations

Overlapping chromatin-remodeling systems collaborate genome wide at dynamic chromatin transitions

Stephanie A Morris et al. Nat Struct Mol Biol. 2014 Jan.

Abstract

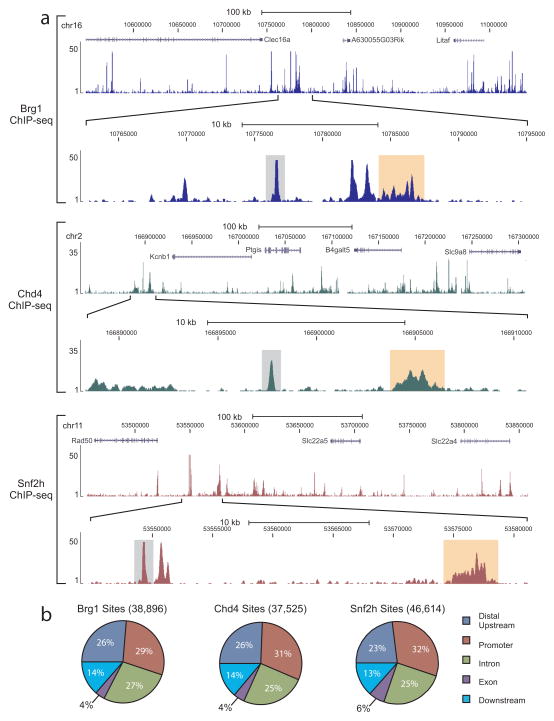
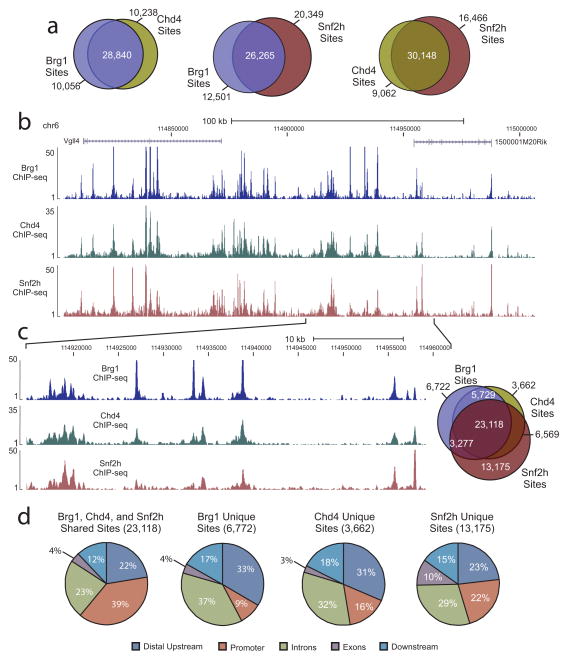
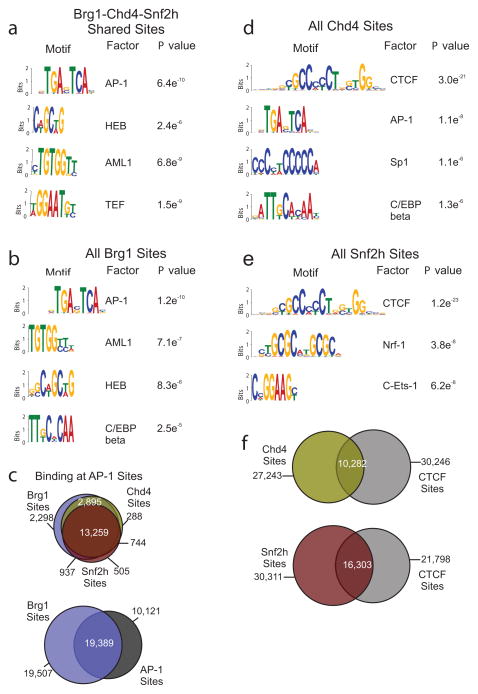
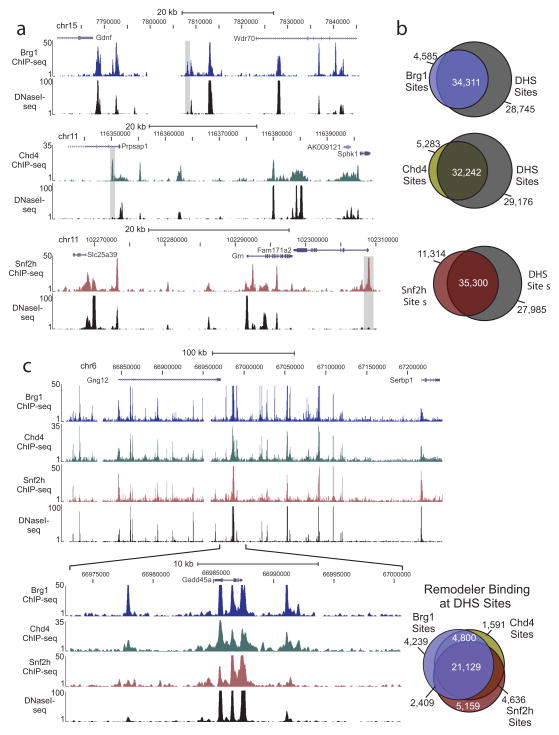
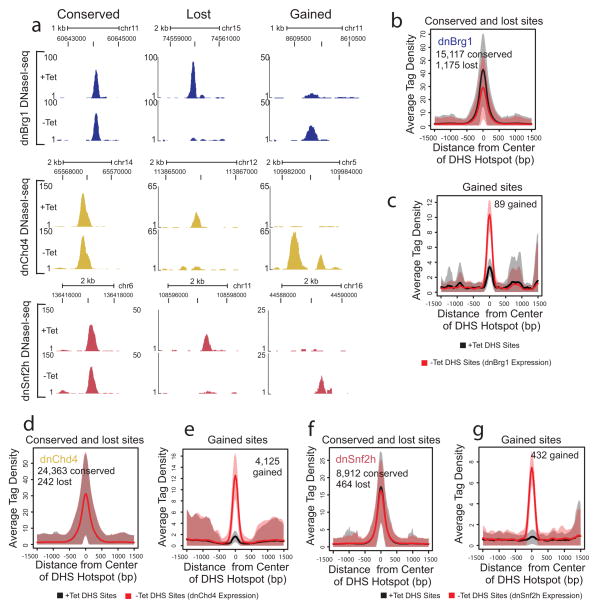
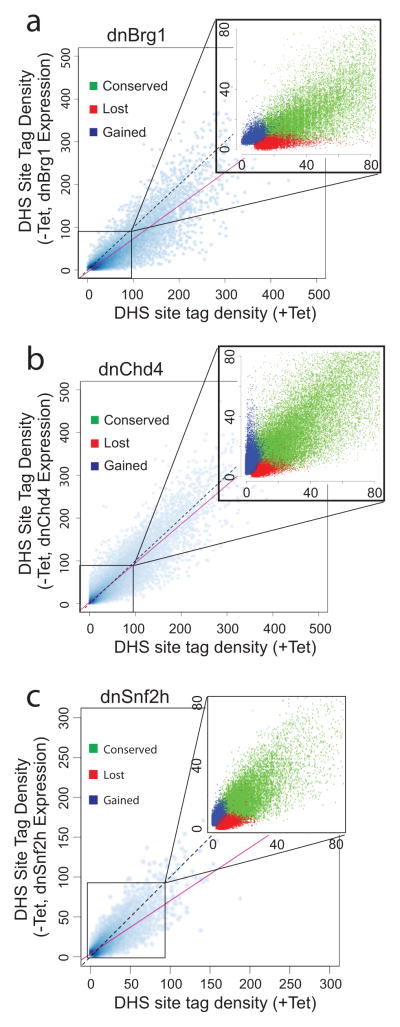
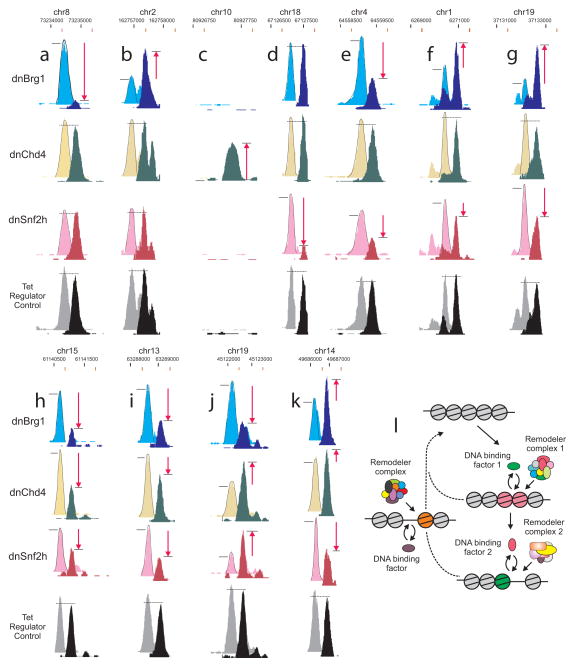
ATP-dependent chromatin remodeling is an essential process required for the dynamic organization of chromatin structure. Here we describe the genome-wide location and activity of three remodeler proteins with diverse physiological functions in the mouse genome: Brg1, Chd4 and Snf2h. The localization patterns of all three proteins substantially overlap with one another and with regions of accessible chromatin. Furthermore, using inducible mutant variants, we demonstrate that the catalytic activity of these proteins contributes to the remodeling of chromatin genome wide and that each of these remodelers can independently regulate chromatin reorganization at distinct sites. Many regions require the activity of more than one remodeler to regulate accessibility. These findings provide a dynamic view of chromatin organization and highlight the differential contributions of remodelers to chromatin maintenance in higher eukaryotes.


Figures

Figure 1
Figure 1. Remodeler proteins bind to distinct regions of chromatin
(a) Example ChIP-seq genome browser views of Brg1 (top, blue tracks), Chd4 (middle, green tracks), and Snf2h (bottom, dark red tracks) occupancy. Images represent tag densities (mapped sequence tags) relative to genome coordinates. For each remodeler, the lower browser image displays an expanded view of the selected region where examples of localized distributions (single peak, <500 bp) are highlighted by grey shading and broad distributions (>500 bp) are highlighted by light orange shading. (b) Distributions of remodeler occupancy at annotated genic regions. Sites are classified as promoter (−/+ 2.5 kb from TSS), exon (> 2.5 kb downstream from TSS, to the last intron, not intron), distal upstream (> 2.5 kb upstream from TSS), downstream (> 2.5 kb downstream from TSS, not exon or intron), or intron.
Figure 2
Figure 2. Brg1, Snf2h, and Chd4 tend to co-occupy the same genomic regions
(a) Venn diagrams displaying overlaps of binding site occupancy between pairs of remodelers. (b) ChIP-seq genome browser view of Brg1 (blue track), Chd4 (green track), and Snf2h (dark red track) occupancy at the same genomic coordinates on chromosome 6. Mapped sequence tags represented as tag density are indicated on the y-axis. (c) An expanded view of the selected region in panel [(b)]. Displayed on the right-side is a three-way Venn diagram demonstrating the overlap between the binding sites of Brg1(blue), Chd4 (dark yellow), and Snf2h (red). (d) Distribution at annotated genic regions of shared and unique remodeler binding sites. Promoter represents region ± 2.5 kb from TSS.
Figure 3
Figure 3. Remodeler binding sites are associated with DNA sequence-specific regulatory elements
(a) Results of de novo motif discovery using the top 2,000 binding sites (based on tag density) co-occupied by Brg1, Chd4, and Snf2h. Shown are the most significantly enriched motifs identified by MEME analysis (P < 10−4). The AP-1 motif is the most highly enriched motif (MEME E value = 1.9e−2110). (b) Results of de novo motif discovery (top 2,000 sites) of all Brg1 sites. AP-1 is the most highly enriched motif for these sites (MEME E value = 5.5e−2277). (c) Venn diagrams of sites shared between remodelers and AP-1. Top, three-way Venn diagram representing the overlap between remodeler sites that specifically co-localize with AP-1 sites. Bottom, Venn diagram of the overlap between Brg1 and AP-1 sites. (d–e) Similar de novo motif analysis as described above was performed for Chd4 [(d)] and Snf2h [(e)]. For both remodelers at each site type, the motif identified as CTCF was found to be the most highly enriched motif (Chd4 MEME E value = 2.0e−490; Snf2h MEME E value = 2.7e−983). (f) Venn diagrams representing the overlap of binding sites for Chd4 or Snf2h with CTCF sites.
Figure 4
Figure 4. Remodeler protein binding highly overlaps with accessible chromatin regions
(a) Genome browser view examples of remodeler ChIP-seq occupancy and DNase I hypersensitivity (measure of chromatin accessibility, DNaseI-seq) patterns. Images represent tag densities (mapped sequence tags) relative to genome coordinates. Examples of binding sites that do not overlap with accessible chromatin are highlighted by grey shading. (b) Venn diagrams representing the overlap of binding sites for each remodeler with DNase I hypersensitive (DHS) sites. (c) Genome browser view of Brg1 (blue track), Chd4 (green track), and Snf2h (dark red track) ChIP-seq occupancy and DNaseI-seq patterns at a region on chromosome 6 are displayed. An expanded view of the selected region is shown below this image. Displayed on the right-side is a three-way Venn diagram representing the overlap between remodeler sites that specifically co-localize with DHS sites.
Figure 5
Figure 5. Remodeler protein distribution at conserved and lost sites
(a) Browser view examples of DHS sites (DNaseI-seq) in the absence (+Tet) or presence (−Tet) of each dnRemodeler. Tag densities (y-axis) are indicated for sites located at the displayed genomic coordinates. (b–g) Aggregate plot of average DHS tag density values over conserved and lost sites for dnBrg1 (b), gained sites for dnBrg1 (c), conserved and lost sites for dnChd4 (d), gained sites for dnChd4 (e), conserved and lost sites for dnSnf2h (f), and gained sites for dnSnf2h (g). The shaded areas are up to +/− standard deviation from the average profile.
Figure 6
Figure 6. Trends in remodeler protein regulation of chromatin accessibility
DNase I hypersensitivity (DHS site tag density) of DHS sites following expression (−Tet, y-axis) of dnBrg1 (a), dnChd4 (b), or dnSnf2h (c) compared to DHS sites in the absence (+Tet, x-axis) of the indicated dnRemodeler. Insets, expanded views of selected scatter plot regions. Conserved (green) are sites that existed prior to and after the expression of dnRemodeler; lost (red) are sites lost following dnRemodeler expression; and gained (blue) are newly opened sites. Solid red line; trend line used to indicate direction of DHS tag density change following dnRemodeler expression. Dotted black line, diagonal line indicating position of trend line if there were no changes in hypersensitivity. Control −Tet/+Tet distributions for parental cells with no dnRemodelers are shown in Supplementary Fig. 8.
Figure 7
Figure 7. Multiple remodelers contribute to the regulation of an individual DHS site
(a–k) Examples of DHS sites affected by expression of each of the indicated dominant-negative remodelers. (a–d) Single remodeler effects. (e–g) Double synergism. (h–k) Triple synergism. For comparison, the −Tet induction of dominant negative tracks are displaced down and to the right (black coordinates +Tet; red coordinates −Tet). −/+ dnBrg1 [(Cyan (−), Blue (+)]; −/+ dnChd4 [(Yellow (−), Green (+)]; −/+ dnSnf2h [(Pink (−), Red (+)]; −/+ Tet regulator control [(Gray (−), Black (+)]. Tet Regulator Control; cell line expressing only the tetracycline transactivator protein demonstrating effects at these DHS sites are due exclusively to the expression of the dominant-negative variant. Red arrows denote increases or decreases in accessibility, while dotted horizontal line indicates no change. (l) Mechanism of dynamic transitions in chromatin structure mediated by transient recruitment of remodelers and their associated activity. Remodeler complexes are targeted to a nucleosomal region by specific DNA-bound factors. Both events, remodeler recruitment and factor binding, are transient. Transitions may involve a unique remodeler, or multiple complexes acting sequentially (right side). Furthermore, some reactions may lead to chromatin closing, rather than opening (left side). Thus, localized chromatin states monitored by current methodologies represent population averages of complex processes that sometimes involve multiple remodeling systems.

References

    1. Bork P, Koonin EV. An expanding family of helicases within the ‘DEAD/H’ superfamily. Nucleic Acids Res. 1993;21:751–752. - PMC - PubMed
    1. Xi H, et al. Identification and characterization of cell type-specific and ubiquitous chromatin regulatory structures in the human genome. PLoS Genet. 2007;3:e136. - PMC - PubMed
    1. Boyle AP, et al. High-resolution mapping and characterization of open chromatin across the genome. Cell. 2008;132:311–322. - PMC - PubMed
    1. Hesselberth JR, et al. Global mapping of protein-DNA interactions in vivo by digital genomic footprinting. Nat Methods. 2009;6:283–289. - PMC - PubMed
    1. John S, et al. Chromatin accessibility pre-determines glucocorticoid receptor binding patterns. Nat Genet. 2011;43:264–268. - PMC - PubMed

Publication types

Associated data