. 2014 Dec 11;33(50):5675-87.
doi: 10.1038/onc.2013.513. Epub 2013 Dec 9.

CDK/CK1 inhibitors roscovitine and CR8 downregulate amplified MYCN in neuroblastoma cells

Affiliations

CDK/CK1 inhibitors roscovitine and CR8 downregulate amplified MYCN in neuroblastoma cells

C Delehouzé et al. Oncogene. .

Abstract

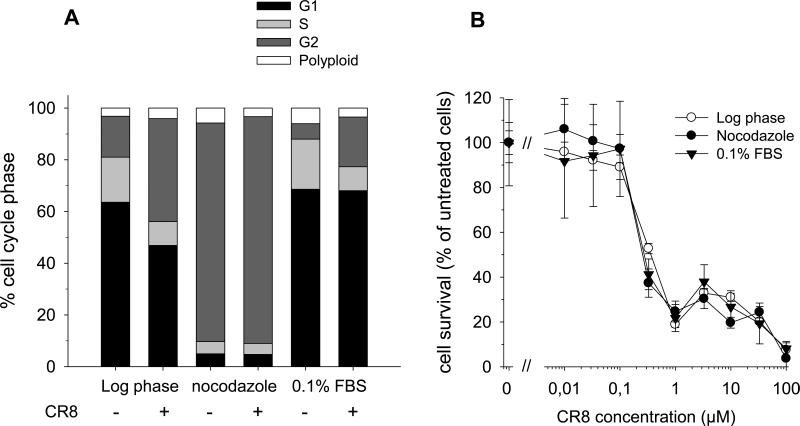
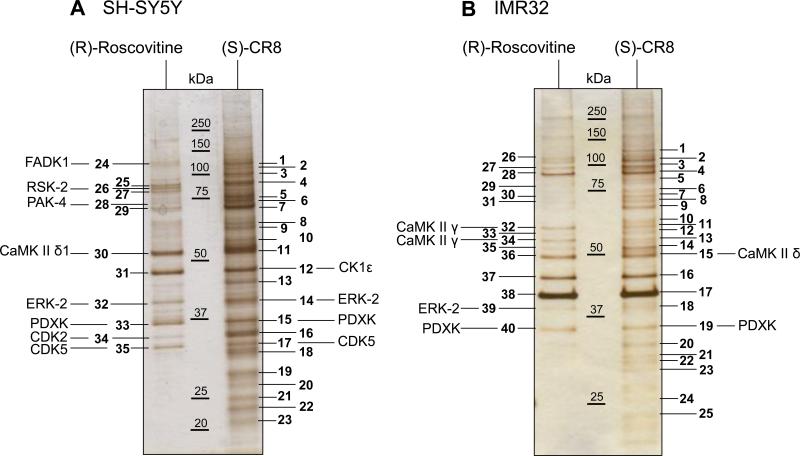
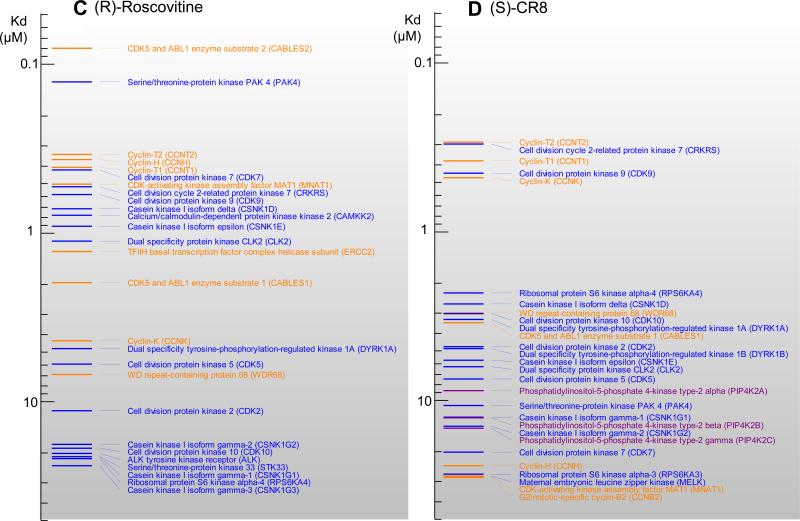
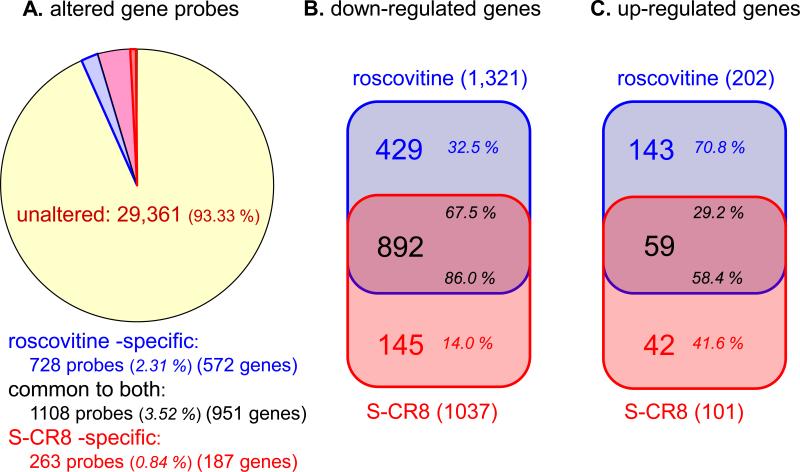
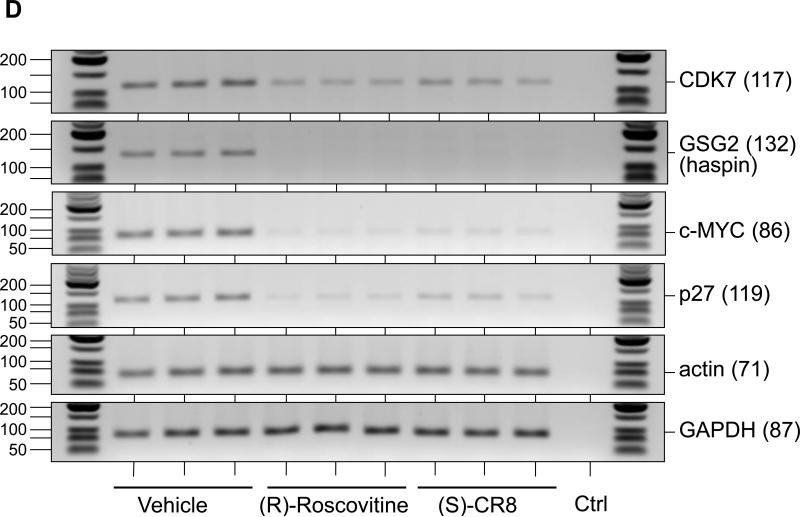
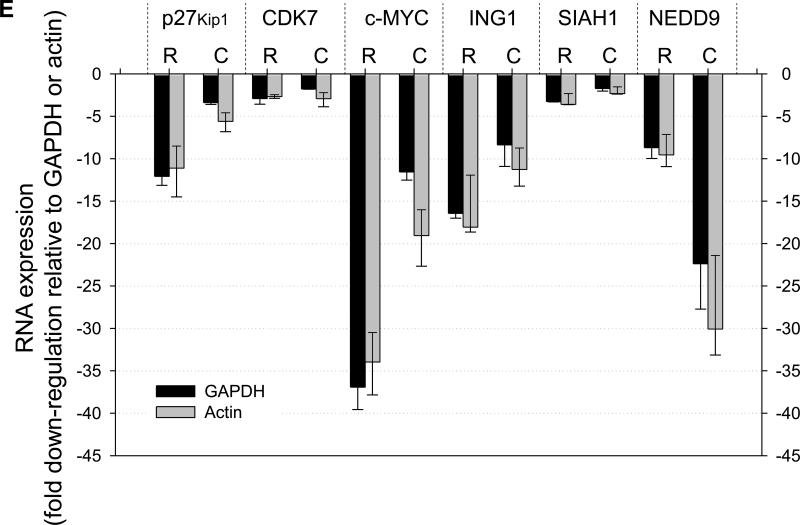
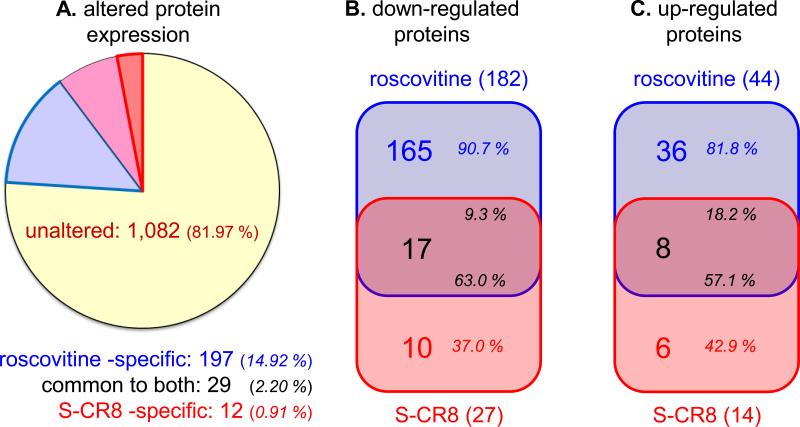
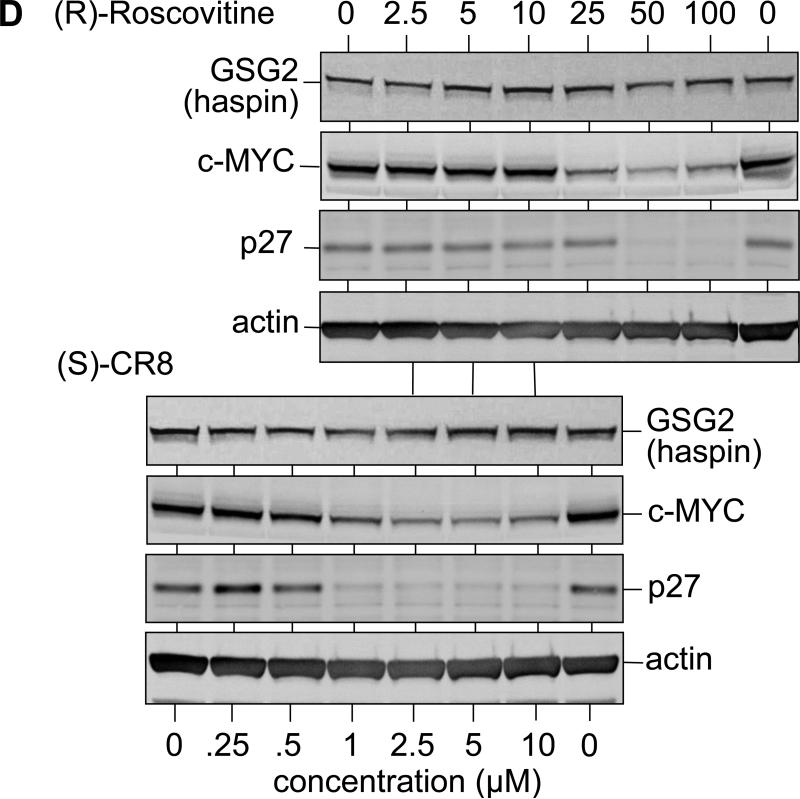
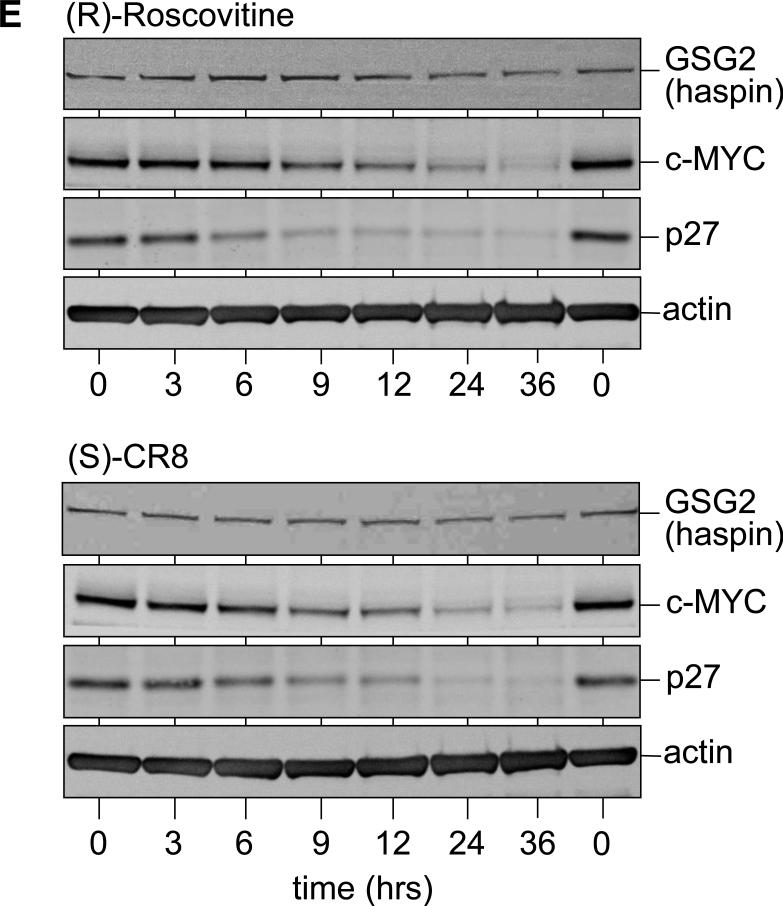
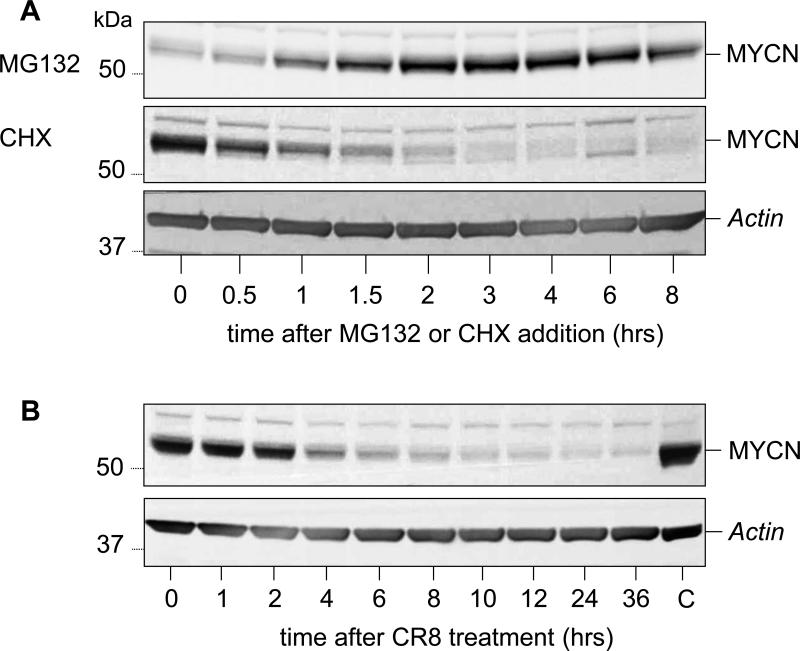
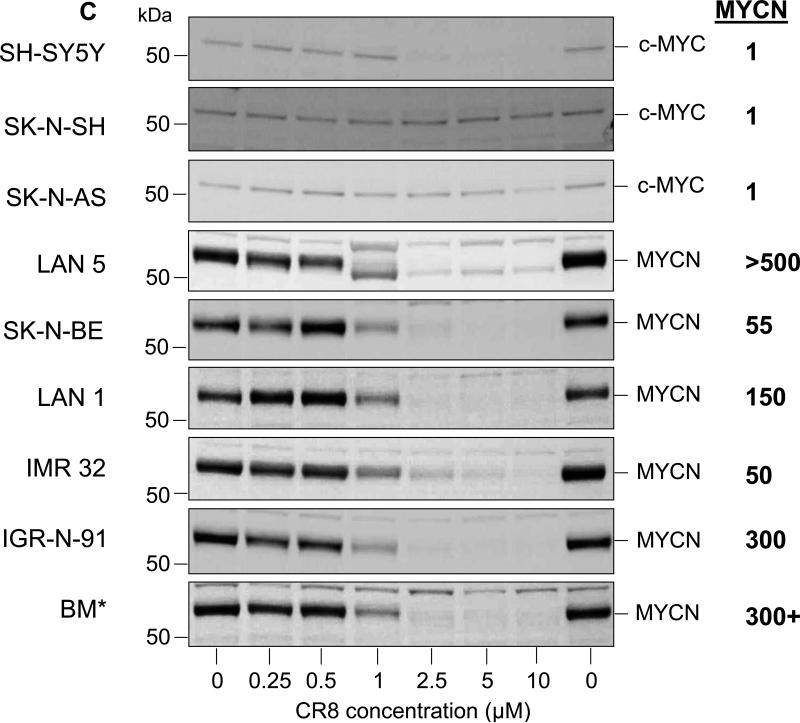
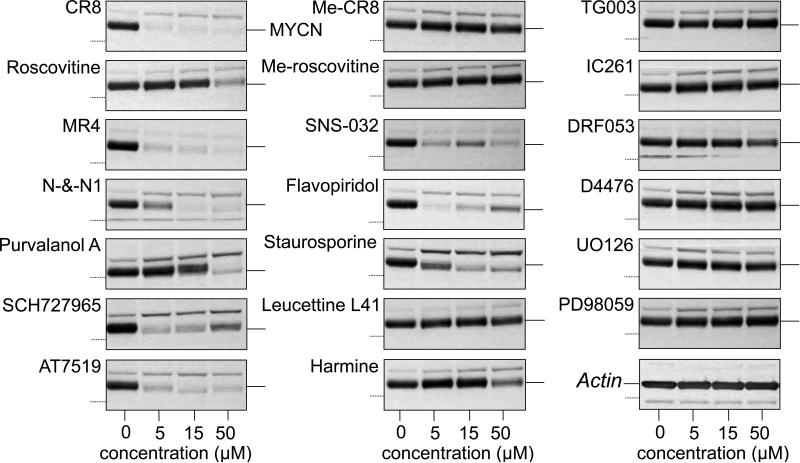
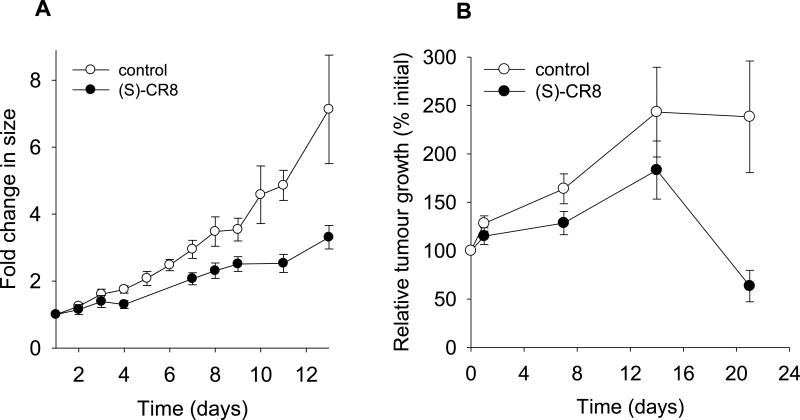
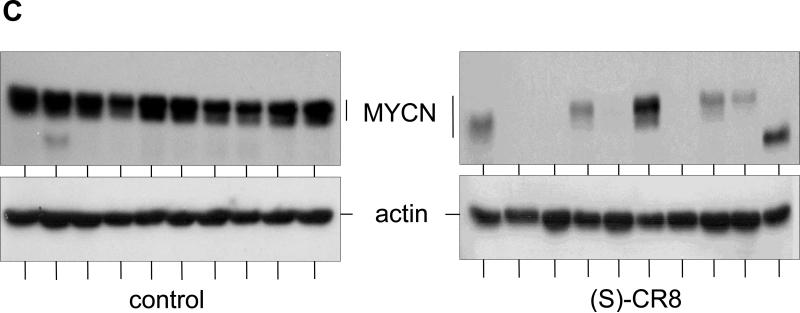
To understand the mechanisms of action of (R)-roscovitine and (S)-CR8, two related pharmacological inhibitors of cyclin-dependent kinases (CDKs), we applied a variety of '-omics' techniques to the human neuroblastoma SH-SY5Y and IMR32 cell lines: (1) kinase interaction assays, (2) affinity competition on immobilized broad-spectrum kinase inhibitors, (3) affinity chromatography on immobilized (R)-roscovitine and (S)-CR8, (4) whole genome transcriptomics analysis and specific quantitative PCR studies, (5) global quantitative proteomics approach and western blot analysis of selected proteins. Altogether, the results show that the major direct targets of these two molecules belong to the CDKs (1,2,5,7,9,12), DYRKs, CLKs and CK1s families. By inhibiting CDK7, CDK9 and CDK12, these inhibitors transiently reduce RNA polymerase 2 activity, which results in downregulation of a large set of genes. Global transcriptomics and proteomics analysis converge to a central role of MYC transcription factors downregulation. Indeed, CDK inhibitors trigger rapid and massive downregulation of MYCN expression in MYCN-amplified neuroblastoma cells as well as in nude mice xenografted IMR32 cells. Inhibition of casein kinase 1 may also contribute to the antitumoral activity of (R)-roscovitine and (S)-CR8. This dual mechanism of action may be crucial in the use of these kinase inhibitors for the treatment of MYC-dependent cancers, in particular neuroblastoma where MYCN amplification is a strong predictor factor for high-risk disease.


Figures

Figure 1
Figure 1. CR8 and IMR32 cell cycle A
IMR32 cells were kept untreated (Log phase), or exposed to 10 μM nocodazole for 18 h or to reduced FBS (0.1%) level for 24 h. They were then exposed to 5 μM for 24 h and their cell cycle phase distribution was analyzed by FACS. (B) Log Phase, G2/M or G1 synchronized IMR32 cells were exposed to various concentrations of CR8 for 24 h and their survival rate was estimated by an MTS assay.
Figure 2
Figure 2. Interactomics studies. A, B. Affinity chromatography purification of roscovitine and CR8 targets from SH-SY5Y and IMR32 neuroblastoma cells
SH-SY5Y (A) and IMR32 (B) neuroblastoma cells were kept in Log phase. Extracts were prepared and loaded on immobilized roscovitine and CR8. Beads were extensively washed and the bound proteins were resolved by SDS-PAGE followed by silver staining and identified by mass spectrometry analysis of tryptic fragments. Identified protein kinases are named in the figure. All analyzed proteins, 1-35 (roscovitine) and 1-40 (CR8), are reported in Supplementary Table S2. C, D. Competition assay identification of roscovitine and CR8 targets from SH-SY5Y neuroblastoma cells. Extracts of SH-SY5Y cells were loaded on affinity beads (KinAffinity®, Evotec) comprising a set of broad-spectrum kinase inhibitors designed to affinity purify endogenously expressed kinases of cells or tissues. Bound proteins were identified following exposure to increasing concentrations of roscovitine (C) or CR8 (D). Kd,free values were calculated and are plotted on a Log scale. Protein kinases (blue), other kinases (violet) and kinase-associated proteins (orange) are ranked from low (top) to high (bottom) Kd,free values. Full results are reported in Supplementary Table S3.
Figure 3
Figure 3. Transcriptomics studies. A-C. Overall effects of roscovitine and CR8 on gene expression in human neuroblastoma SH-SY5Y cells
Cells were exposed for 4 h to either 50 μM roscovitine, 5 μM CR8 or corresponding amounts of DMSO. mRNAs were extracted, purified, reverse-transcribed, amplified, labeled with cyanine-3 CTP dyes, followed by hybridization on Agilent 4x44 K human whole genome slides. Results were analyzed as described in the Material & Methods section. (A) Altered expression (>2 fold) versus non-altered expression (<2 fold) of gene probes: expression of 728 probes (corresponding to 572 genes) was changed specifically by roscovitine, expression of 263 probes (187 genes) was altered specifically by CR8 and expression of 1,108 probes (951 genes) was modified in common by both compounds. 93.33% of all probes displayed no change in expression level following treatment. Gene expression was either down-regulated (B) or up-regulated (C): numbers in parentheses indicate the total number of genes affected by roscovitine or CR8 treatment. The numbers of genes displaying modified expression only in roscovitine treated cells, only in CR8 treated cells or by both treatments are shown in blue, red and black, respectively. Percentages indicate the proportion of these genes relative to the total of genes down- or up-regulated by roscovitine or CR8 treatment. For example, roscovitine induces a >2 fold down-regulation of 1,321 genes, 429 of which (32.5%) are specific to roscovitine treatment, while 892 genes (67.5%) are also down-regulated by CR8 treatment. CR8 induces a >2 fold down-regulation of 1,037 genes, 145 of which (14%) are specific to CR8 treatment, while 892 genes (86%) are also down-regulated by roscovitine treatment. D, E. Selected examples of down-regulated genes. Cells were exposed for 4 h to either 50 μM roscovitine, 5 μM CR8 or corresponding amount of DMSO (vehicle). (D) mRNAs were extracted, purified, reverse-transcribed. Fragments (base pairs number in parentheses) of CDK7, GSG2 (haspin), c-MYC, p27Kip1 were amplified by PCR (28 cycles) and the reaction products were resolved by electrophoresis on agarose. Expression of actin and GAPDH mRNA was used as a reference. Ctrl, no mRNA. (E). Quantitative PCR was also performed with p27Kip1, CDK7, c-MYC, ING1, SIAH1, NEDD9. Expression is displayed relative to vehicle treated cells and normalized according to actin or GAPDH expression.
Figure 4
Figure 4. Proteomics studies. A-C. Overall effects of roscovitine and CR8 on protein expression in human neuroblastoma SH-SY5Y cells
Cells were exposed for 4 h to either 50 μM roscovitine, 5 μM CR8 or corresponding amounts of DMSO. Proteins were extracted, trypsinized, iTRAQ labeled, and samples mixed prior to mass spectrometry analysis. A total of 18,193 peptides corresponding to 1,320 proteins were identified and quantified, of which 18.03% showed a >2 fold change in expression (A) by either one or both drugs. The level of these proteins was either down-regulated (B) (182 proteins by roscovitine and 27 by CR8, of which 17 were down-regulated by both) or up-regulated (C) (44 proteins by roscovitine and 14 by CR8, of which 8 were up-regulated by both). Numbers in parentheses represent the total number of proteins affected by roscovitine or CR8 treatment. The number of proteins displaying modified expression only in roscovitine treated cells, only in CR8 treated cells or by both treatments are shown in blue, red and black, respectively. Percentages indicate the proportion of these proteins relative to the total of proteins down- or up-regulated by roscovitine or CR8 treatment. D, E. Selected examples of down-regulated proteins. Effects of dose (D) and time (E) of exposure to roscovitine or CR8 on the levels of GSG2 (haspin), c-MYC, p27Kip1 and actin. Cells were exposed (D) to various concentrations of roscovitine or CR8 for 24 h or (E) for various times to 50 μM roscovitine, 5 μM CR8 or corresponding amounts of DMSO. Proteins were extracted, resolved by SDS-PAGE and analyzed by Western blotting using appropriate antibodies.
Figure 5
Figure 5. MYCN, an unstable protein, is massively down-regulated following exposure to CR8
(A) Proteasome inhibition (upper panel) strongly stabilizes MYCN, while protein synthesis inhibition (lower panel) down-regulates MYCN protein level. IMR32 cells were exposed to MG132 (10 μM) or cycloheximide (CHX) (12 μg/mL) at time 0. Cells were sampled at various times after drug addition and proteins were resolved by SDS-PAGE followed by Western blotting with anti-MYCN antibodies. (B) CR8 triggers rapid down-regulation of MYCN in IMR32 cells. Cells were exposed for various times to 5 μM CR8 (C, control: corresponding volume of DMSO). Proteins were extracted, resolved by SDS-PAGE and analyzed by Western blotting using anti-MYCN antibodies. (C) CR8 triggers dose-dependent down-regulation of MYCN in MYCN overexpressing neuroblastoma cell lines. Nine different neuroblastoma cell lines were exposed to increasing concentrations of CR8 for 24 h. Proteins were resolved by SDS-PAGE followed by Western blotting with anti-c-MYC (3 upper panels) or anti-MYCN (6 lower panels) antibodies. The level of MYCN amplification in the 9 cell lines is indicated on the right. No MYCN was detected in the 3 non-amplified MCYN cell lines.
Figure 6
Figure 6. Effect of different CDK and non-CDK inhibitors on MYCN levels
MYCN in IMR32 exposed for 10 hrs to 3 concentrations of CR8, roscovitine, MR4, N-&-N1, purvalanol A, SCH727965, AT7519, N6-methyl-CR8 and N6-methyl-roscovitine (kinase inactive derivatives of CR8 and roscovitine, respectively), SNS-032, flavopiridol, staurosporine (general kinase inhibitor), Leucettine L41 and harmine (DYRK1A inhibitors), TG003 (CLK1), IC261, DRF053 and D4476 (CK1), UO126 and PD098059 (MEK1). All drugs were tested at 5, 15 and 50 μM, except staurosporine (0.2, 0.6 and 2 μM). Cells were harvested and proteins were resolved by SDS-PAGE followed by Western blotting with anti-MYCN antibodies. Actin was used as a loading control.
Figure 7
Figure 7. CR8 down-regulates MYCN and reduces tumor growth of xenografted IMR32 cells in NOD scid gamma mice
(A, B), Time course of tumor growth following subcutaneous injection of IMR32 cells in NOD scid gamma mice. In experiment A, cells were injected as a free suspension while in experiment B, cells were injected as a Matrigel/cells slurry. Ten mice were treated by daily intraperitoneal injection of CR8 (final concentration: 6.7 mg/kg) or a corresponding volume of the DMSO/PEG300/water vehicle. Tumor size was monitored throughout the experiments. In B, only the CR8-sensitive tumors were kept in the graph. (C) Control and CR8-treated tumors (sensitive tumors only) were all collected at day 21 and their proteins analyzed by SDS-PAGE followed by Western blotting against MYCN and actin.

Similar articles

Cited by

References

    1. Weinmann H, Metternich R. Drug discovery process for kinase inhibitors. ChemBioChem. 2005;6:455–459. - PubMed
    1. Eglen RM, Reisine T. The current status of drug discovery against the human kinome. Assay Drug Dev Technol. 2009;7:22–43. - PubMed
    1. Eglen R, Reisine T. Drug discovery and the human kinome: recent trends. Pharmacol Ther. 2011;130:144–156. - PubMed
    1. Via MC. Kinase-Targeted Therapeutics: Development Pipelines, Challenges, and Opportunities. Cambridge Healthtech Institute; 2011. p. 124.
    1. Petrelli A, Giordano S. From single- to multi-target drugs in cancer therapy: when aspecificity becomes an advantage. Curr Med Chem. 2008;15:422–432. - PubMed

Publication types

MeSH terms