. 2014 Jan 23;505(7484):569-73.
doi: 10.1038/nature12811. Epub 2013 Dec 8.

Structural basis of the alternating-access mechanism in a bile acid transporter

Affiliations

Structural basis of the alternating-access mechanism in a bile acid transporter

Xiaoming Zhou et al. Nature. .

Abstract

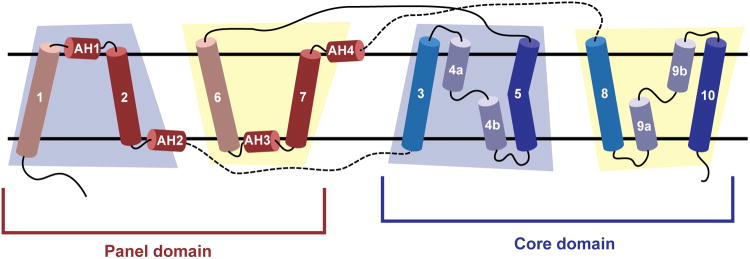
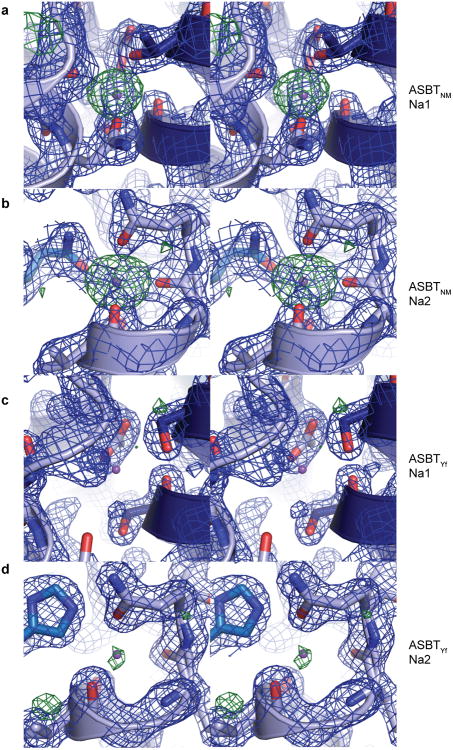
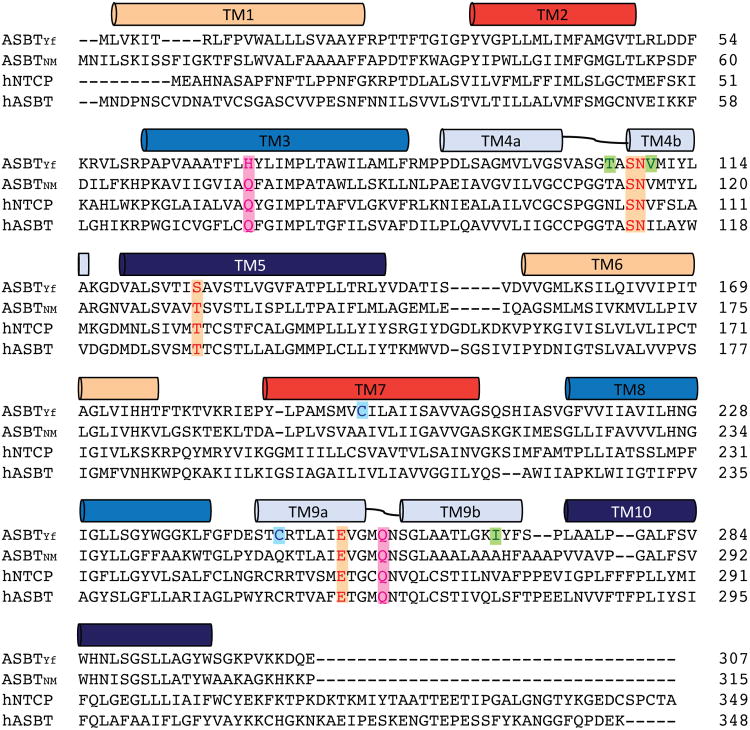
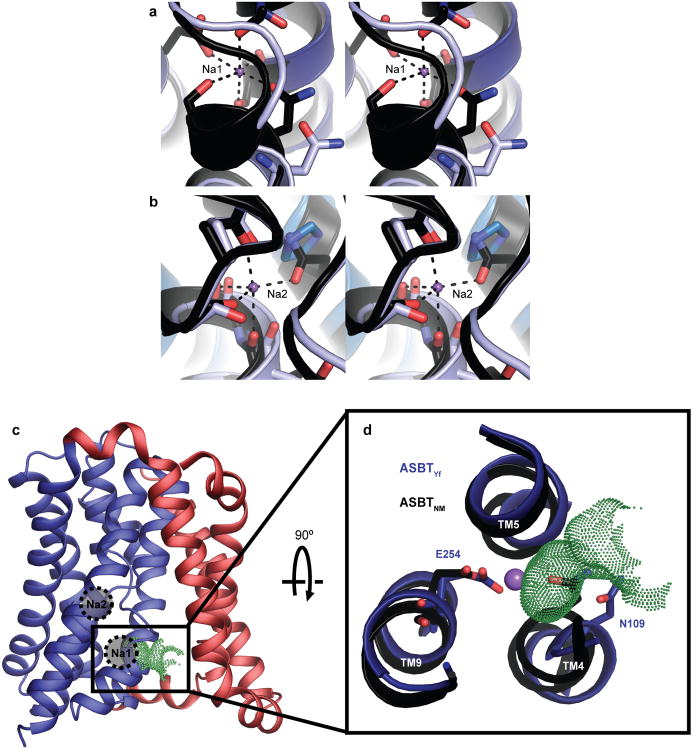
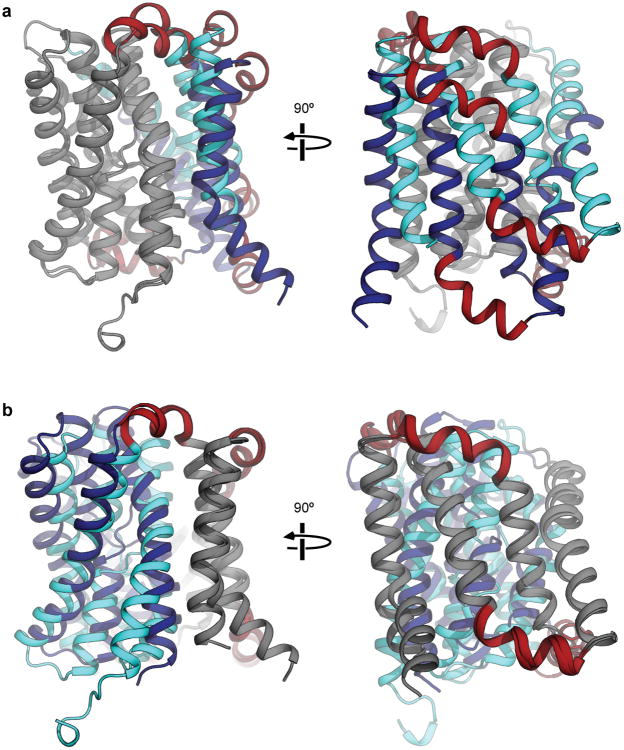
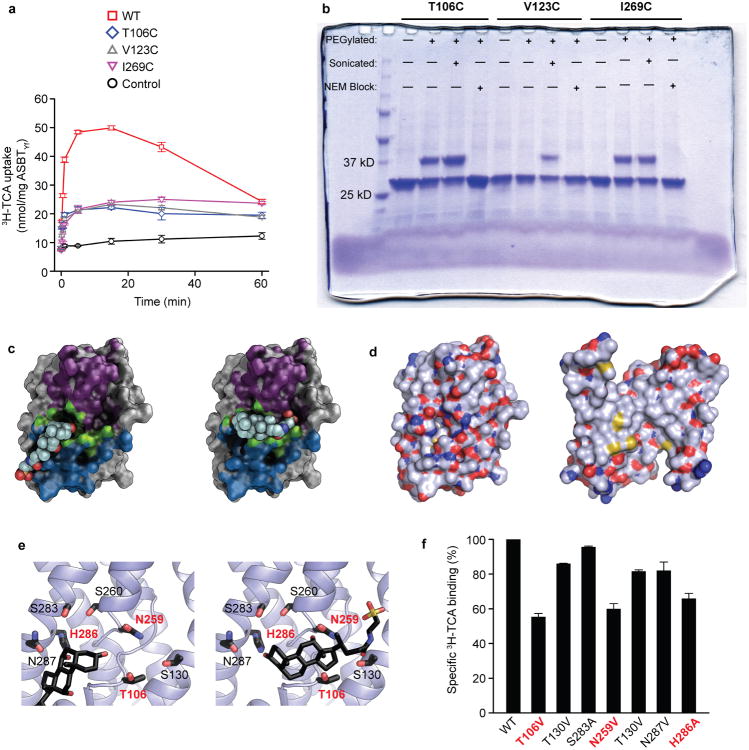
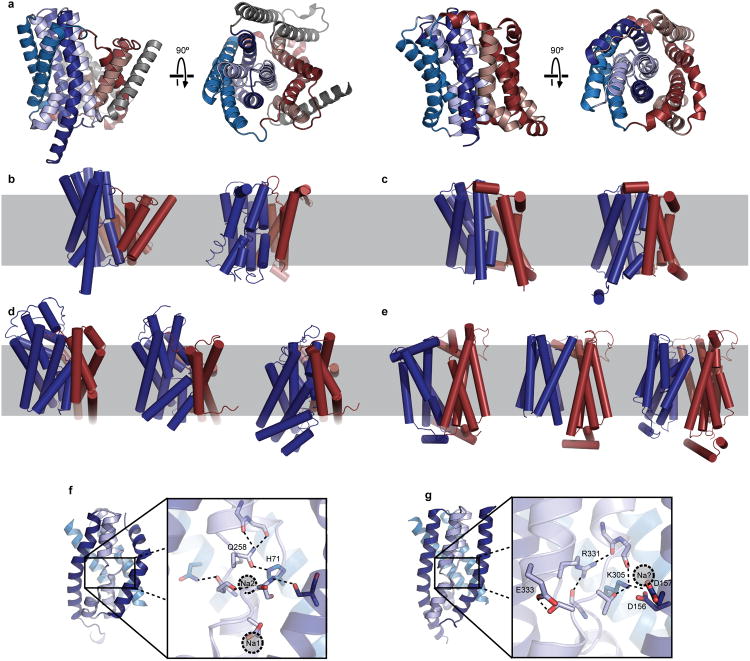
Bile acids are synthesized from cholesterol in hepatocytes and secreted through the biliary tract into the small intestine, where they aid in absorption of lipids and fat-soluble vitamins. Through a process known as enterohepatic recirculation, more than 90% of secreted bile acids are then retrieved from the intestine and returned to the liver for resecretion. In humans, there are two Na(+)-dependent bile acid transporters involved in enterohepatic recirculation, the Na(+)-taurocholate co-transporting polypeptide (NTCP; also known as SLC10A1) expressed in hepatocytes, and the apical sodium-dependent bile acid transporter (ASBT; also known as SLC10A2) expressed on enterocytes in the terminal ileum. In recent years, ASBT has attracted much interest as a potential drug target for treatment of hypercholesterolaemia, because inhibition of ASBT reduces reabsorption of bile acids, thus increasing bile acid synthesis and consequently cholesterol consumption. However, a lack of three-dimensional structures of bile acid transporters hampers our ability to understand the molecular mechanisms of substrate selectivity and transport, and to interpret the wealth of existing functional data. The crystal structure of an ASBT homologue from Neisseria meningitidis (ASBT(NM)) in detergent was reported recently, showing the protein in an inward-open conformation bound to two Na(+) and a taurocholic acid. However, the structural changes that bring bile acid and Na(+) across the membrane are difficult to infer from a single structure. To understand the structural changes associated with the coupled transport of Na(+) and bile acids, here we solved two structures of an ASBT homologue from Yersinia frederiksenii (ASBTYf) in a lipid environment, which reveal that a large rigid-body rotation of a substrate-binding domain gives the conserved 'crossover' region, where two discontinuous helices cross each other, alternating accessibility from either side of the cell membrane. This result has implications for the location and orientation of the bile acid during transport, as well as for the translocation pathway for Na(+).


Figures

Extended Data Figure 1
Extended Data Figure 1. Purification and functional characterization of WT and Na+-site mutant ASBTYf
a, The elution profiles of WT, E254A, Q258A, and E254A/Q258A ASBTYf from a size exclusion column. Inset shows SDS-PAGE gel of FPLC-purified WT ASBTYf before (lane 2) and after (lane 3) cleavage of the affinity tag with TEV protease. b, Chemical structures of bile acids. The primary bile acid cholic acid (top) contains a steroid nucleus, with a five-carbon side chain terminating in a carboxylic acid attached to carbon 17. Further modification of cholic acid by attachment of the amino acid taurine to the side chain results in the conjugated bile acid taurocholic acid (TCA, bottom). c-e, Time courses of 1 μM 3H-TCA (20 Ci/mmol) uptake into proteoliposomes reconstituted with WT (red) or E254A (blue) ASBTYf, or control liposomes (black) without protein, in the presence of 100 mM external NaCl. Uptake was measured under three conditions: c, in intact liposomes with an inwardly-directed Na+ gradient; d, in the presence of 25 μg/mL of the Na+-selective ionophore gramicidin, collapsing the Na+ gradient; and e, in the presence of 25 μg/mL gramicidin and 0.05% of the detergent n-dodecyl-β-D-maltopyranoside. Under the latter condition, the liposomes are permeabilized, and only 3H-TCA bound to the lipids and protein is measured.
Extended Data Figure 2
Extended Data Figure 2. Topology diagram of the bile acid transporter fold
A schematic of the membrane topology of ASBTYf, oriented with the periplasm on top. The helices are grouped by domain, and the blue and yellow trapezoids denote transmembrane helices in the first and second inverted repeats, respectively. Pseudo-symmetry equivalent transmembrane helices are colored identically.
Extended Date Figure 3
Extended Date Figure 3. The WT ASBTYf structure is in a Na+ -free state
a-d, Stereo images of the residues forming Na1 (a, c) and Na2 (b, d) in the ASBTNM (a, b) and ASBTYf (c, d) structures, shown with the 2Fo-Fc electron density maps in blue and the Fo-Fc density maps in green. Contour levels are set at 1.5 and 3.0 σ, respectively, and the sodium ions were omitted from the Fo-Fc map calculation for the ASBTNM structure. The purple spheres in all four images correspond to the positions of Na+ in the ASBTNM structure.
Extended Data Figure 4
Extended Data Figure 4. Sequence conservation of the bile acid transporter family
Sequence alignments of human NTCP, ASBT and bacterial homologs from Neisseria meningitidis and Yersinia frederiksenii were calculated with CLUSTALW. The colored bars mark the locations of transmembrane helices in ASBTYf. Residues forming Na1 and Na2 are highlighted with orange and pink, respectively. Residues in ASBTYf mutated to cysteine for the accessibility experiments are colored green; native cysteines that were mutated to serine to make the cysteine-free background are colored cyan.
Extended Data Figure 5
Extended Data Figure 5. Na+-induced conformational changes in the Na+-binding sites and crossover region
a-b, Stereoimages of the Na+-binding sites Na1 (a) and Na2 (b) are shown in the superposed ASBTYf (light blue) and ASBTNM (black) structures. Purple spheres correspond to the sodium ions in the ASBTNM structure. c, The ABSTYf structure colored by domain, with the locations of the Na+ binding sites from ASBTNM marked with circles. Green dots mark a solvent accessible invagination in the surface of the core domain. TM1 is hidden for clarity. d, Closer view of Na1, formed by residues from helices TM4, TM5, and TM9 of the core domain, shown in the overlaid ASBTYf (dark blue) and ASBTNM (black) structures, as viewed from periplasmic side. The purple sphere corresponds to the Na+ position in the ASBTNM structure. Green dots mark a solvent accessible invagination in the surface of the core domain leading to the central cavity in ASBTYf, which is blocked by the residue equivalent to N109 in the Na+-bound ASBTNM structure.
Extended Data Figure 6
Extended Data Figure 6. The core domain of ASBTYf moves relative to the membrane to form the outward-open state
a, If the inward-open and outward-open ASBTYf structures are aligned on the core domain only (gray), a rigid motion of the panel domain (blue) moves the amphipathic helices (red) out of the inferred bilayer/periplasm and bilayer/cytoplasm interfaces. b, If the inward-open and outward-open ASBTYf structures are aligned on the panel domain only (gray), a rigid-body motion of the core domain (blue) leaves the amphipathic helices largely unaffected.
Extended Data Figure 7
Extended Data Figure 7. Accessibility of residues in the crossover region and potential substrate binding sites
a, Empty liposomes or proteoliposomes reconstituted with 1:100 (mg:mg) WT, C196S/C248S/T106C, C196S/C248S/V123C, or C196S/C248S/I269C ASBTYf were assayed for uptake of 1 μM 3H-TCA (10 Ci/mmol) in the presence of 100 mM NaCl for the indicated time periods. b, Accessibility of the T106C, V123C, and I269C residues to modification by mPEG-Mal-5K, assessed by a shift in mobility on a Coomassie blue-stained SDS-PAGE gel (same as in Fig 2d, shown here uncropped). Each cysteine mutant was overexpressed in E. coli and subjected to four different conditions prior to purification: no addition of mPEG-Mal-5K; addition of mPEG-Mal-5K to the outside of whole cells, addition of mPEG-Mal-5K after sonication to rupture the cell membranes, and addition of mPEG-Mal-5K to whole cells after block of cysteines with N-ethylmaleimide. c, The core domain of ASBTYf, viewed from the central cavity-facing side, with the inward accessible, outward accessible, and dual accessible surface areas colored as in Figure 2c. A molecule of TCA is shown modeled into two potential binding sites: (left) the binding site observed in the ASBTNM structure, and (right) a laterally-oriented binding site based on the location of residues accessible to solution in both the inward open and outward open ASBTYf crystal structures. d, Surface representations of the core and panel domains of ASBTYf, both oriented with the cavity-facing sides in front, colored by element. Carbon atoms are shown as blue-gray, oxygen atoms as red, nitrogens as dark blue, and sulfurs as yellow. e, Locations of polar residues near the crossover region. TCA is shown based on the ASBTNM structure (left) and accessibility in the ASBTYf structures (right). f, Binding of 1 μM 3H-TCA in the presence of 150 mM NaCl by WT and mutant ASBTYf measured by SPA. Mutations that reduce binding by more than 20% relative to the WT protein are labeled in red.
Extended Data Figure 8
Extended Data Figure 8. Comparison of ASBTYf to the NhaA/NapA, XylE, and GltPh transporters
a, Cartoon representation of the NapA structure (4BWZ) shown from two perpendicular directions. The transmembrane helices are colored in pseudosymmetry-related pairs according to the same scheme used for the ASBT fold in Extended Data Fig. 2. Helices in the interface domain with no equivalent in the ASBT fold are colored gray. ASBTYf is shown in the two rightmost panels for comparison. b, Outward-open (4BWZ, left) and inward-open (1ZCD, right) structures of Na+/H+ antiporters with the mobile core domain colored dark blue and the immobile interface domain colored red. c, Outward-open (left) and inward-open (right) structures of ASBTYf with the mobile core domain colored dark blue and the immobile panel domain colored red. d, Outward-open (1XFH, left), intermediate (3V8G, middle), and inward-open (3KBC, right) structures of GltPh with the mobile substrate binding domain colored dark blue and the immobile interface domain colored red. e, Outward-open (4GBY, left), partially inward-open (4JA3, middle), and inward-open (4JA4, right) structures of E. coli XylE with the mobile C-terminal domain colored dark blue and the immobile N-terminal domain colored red. f-g, The core domains of ASBTYf (f) and NapA (g) are shown viewed from the side facing the panel domain, with magnified views of the crossover regions. Polar and charged residues stabilizing the exposed backbone atoms in the unwound regions are shown as sticks in both structures. The gray circles correspond to the Na+ binding sites in ASBTNM or to the approximate location of the putative Na+ binding site in NapA.
Extended Data Figure 9
Extended Data Figure 9. Citrate in the crossover region of the WT ASBTYf structure
a, Location of the bound citrate molecule in the WT ASBTYf structure. The green surface corresponds to the Fo-Fc omit density for the citrate, contoured at 3.0 σ. Helix TM1 is hidden for clarity. b, Specific binding of 0.48 μM [22Na]Cl (5.92 Ci/mmol) to WT ASBTYf measured by SPA in the presence and absence of 5 mM potassium citrate. c, A close-up stereo-view of the area marked with a black rectangle in panel a. Likelihood weighted 2Fo-Fc (1.5 σ) and Fo-Fc (3.0 σ) electron density is shown as blue and green mesh, respectively. The citrate molecule was omitted from the Fo-Fc map calculation. Potential hydrogen bonds to the protein and ordered solvent molecules are marked with dotted lines.
Figure 1
Figure 1. Function and 1.95 Å crystal structure of ASBTYf
a. Time-course of uptake of 3H-TCA into empty or ASBTYf-containing proteoliposomes in the presence of 100 mM external NaCl or choline chloride. b. Uptake of 3H-TCA 30 seconds after addition to ASBTYf-containing proteoliposomes in the presence of 100 mM external NaCl or choline chloride, as a function of the initial external 3H-TCA concentration. c. Cartoon representation of the ASBTYf structure shown from two perpendicular directions in the plane of the membrane with the periplasm on top (left and middle), and from the extracellular side (right). The transmembrane helices are colored in pseudosymmetry related pairs. d. A cutaway surface representation of ASBTYf showing the locations of the discontinuous helices TM4 and TM9 relative to the intracellular cavity. Locations of the Na+ binding sites in the previously reported ASBTNM structure are marked with dotted circles. Inset on the right shows a magnified view of residues that coordinate Na+ in the ASBTNM structure. e. Alignment of the discontinuous helices TM4 and TM9 in the ASBTYf (light blue) and ASBTNM (dark blue) structures. The partly unwound region of TM4b is marked with a black arrow. f. Na+ binding kinetics of ASBTYf and the Na+-site mutants. Equilibrium binding of 0.95 μM [22Na]Cl (5.92 Ci/mmol) to 250 ng of WT, E254A, or Q258A ASBTYf was measured with the SPA in the presence of increasing NaCl concentrations ranging from 0 – 100 mM. Isotopic replacement of 22Na+ was plotted as a function of the concentration of non-labeled NaCl. The means of triplicate measurements ± SEM were subjected to non-linear regression fitting in Prism 5 (GraphPad).
Figure 2
Figure 2. Structure and validation of the outward-open conformation of ASBTYf
a. The WT (left) and E254A (right) structures are shown side by side. Black lines correspond to the approximate position of the lipid bilayer inferred from the amphipathic helices. The core domain is marked with a blue silhouette, and regions acting as hinges in the conformational change between the two structures are marked with green arrows in the E254A structure. b. Cutaway view of the surfaces of the WT (left) and E254A (right) structures, showing the intracellular and extracellular cavities. Insets show key helices forming the interface between the panel and core domain; blue rectangles show the location of the inter-domain interface in both structures. c. Surface representations of the core (left) and panel (right) domains of the WT ASBTYf structure. The sides of both domains facing the central cavity are colored according to whether they are accessible to the cytoplasm in the WT structure (blue), accessible to the periplasm in the E254A structure (violet), or are solvent accessible in both conformations (green). A stick representation of TCA marks the location of the substrate in the ASBTNM structure. d. Cartoon representation of the WT ASBTYf structure with the locations of Thr106, Val123, and Ile269 marked with spheres. e. SDS-PAGE gel showing results of PEGylation experiments for the three ASBTYf cysteine mutants. Pluses and minuses mark whether or not samples were incubated with mPEG-Mal-5K, were sonicated prior to PEGylation to rupture the cell membranes, or were incubated with N-ethylmaleimide prior to PEGylation to prevent further modification of the cysteine residues.
Figure 3
Figure 3. Proposed ASBTYf transport mechanism
a. Binding of 3H-TCA to detergent-solubilized WT ASBTYf as a function of NaCl concentration, as measured by SPA. b. Binding of 22Na+ to detergent-solubilized WT and E254A ASBTYf in the presence and absence of 100 μM TCA. c. Key conformational states of ASBT during the translocation of substrates. Distinct conformations captured by crystallography are indicated with the name of the relevant protein, whereas hypothetical structural states are surrounded with a dashed grey line. In the ligand-free state (I), corresponding to the E254A ASBTYf structure, the crossover region is exposed to the periplasm. Na+ then binds to Na1 and Na2 (II), facilitating the binding of TCA, likely to the dual-accessibility region (III). Conversion to the inward-open conformation (IV) allows TCA access to the binding site observed in the ASBTNM structure (V). Exposure to lower Na+ concentrations in the cytoplasm drives release of Na+, possibly by the pathway opened by the rotation of TM4b in the ASBTYf structure (VI), which in turn triggers release of TCA.

References

    1. Dawson PA. Role of the intestinal bile acid transporters in bile acid and drug disposition. Handbook of experimental pharmacology. 2011:169–203. - PMC - PubMed
    1. Claro da Silva T, Polli JE, Swaan PW. The solute carrier family 10 (SLC10): Beyond bile acid transport. Molecular aspects of medicine. 2013;34:252–269. - PMC - PubMed
    1. West KL, Ramjiganesh T, Roy S, Keller BT, Fernandez ML. 1-[4-[4[(4R,5R)-3,3-Dibutyl-7-(dimethylamino)-2,3,4,5-tetrahydro-4-hydroxy-1,1-di oxido-1-benzothiepin-5-yl]phenoxy]butyl]-4-aza-1-azoniabicyclo[2.2.2]octane methanesulfonate (SC-435), an ileal apical sodium-codependent bile acid transporter inhibitor alters hepatic cholesterol metabolism and lowers plasma low-density lipoprotein-cholesterol concentrations in guinea pigs. The Journal of pharmacology and experimental therapeutics. 2002;303:293–299. - PubMed
    1. Braun A, et al. Inhibition of intestinal absorption of cholesterol by ezetimibe or bile acids by SC-435 alters lipoprotein metabolism and extends the lifespan of SR-BI/apoE double knockout mice. Atherosclerosis. 2008;198:77–84. - PMC - PubMed
    1. Hagenbuch B, Stieger B, Foguet M, Lubbert H, Meier PJ. Functional expression cloning and characterization of the hepatocyte Na+/bile acid cotransport system. Proceedings of the National Academy of Sciences of the United States of America. 1991;88:10629–10633. - PMC - PubMed

Publication types