. 2014 Jan 31;289(5):2801-14.
doi: 10.1074/jbc.M113.499913. Epub 2013 Dec 6.

Hepatic apolipoprotein M (apoM) overexpression stimulates formation of larger apoM/sphingosine 1-phosphate-enriched plasma high density lipoprotein

Affiliations

Hepatic apolipoprotein M (apoM) overexpression stimulates formation of larger apoM/sphingosine 1-phosphate-enriched plasma high density lipoprotein

Mingxia Liu et al. J Biol Chem. .

Abstract

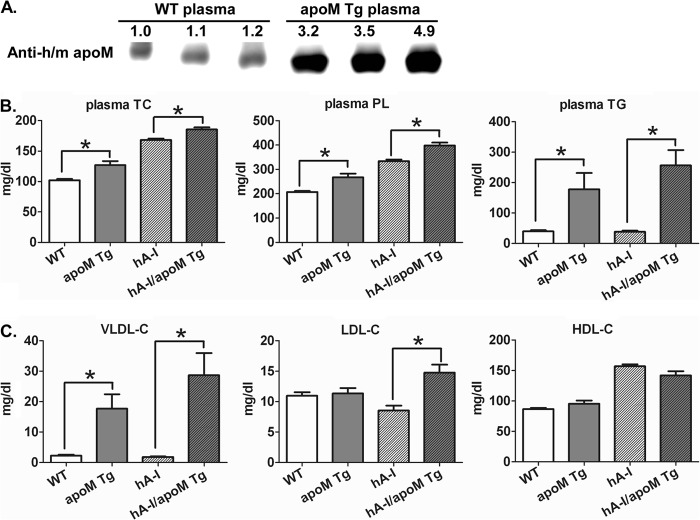
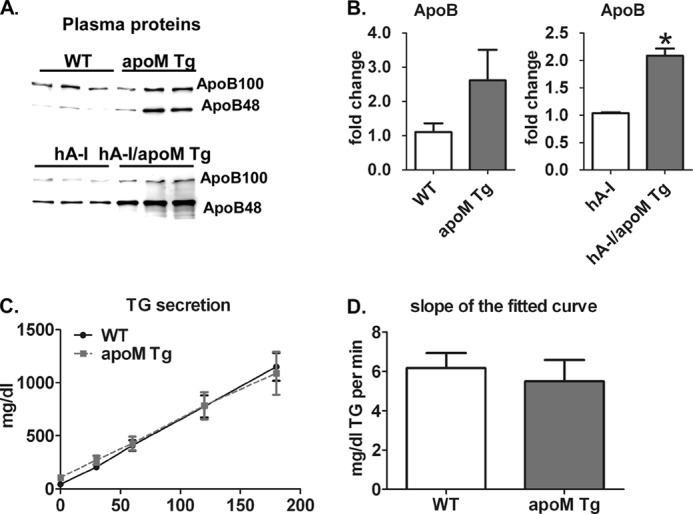
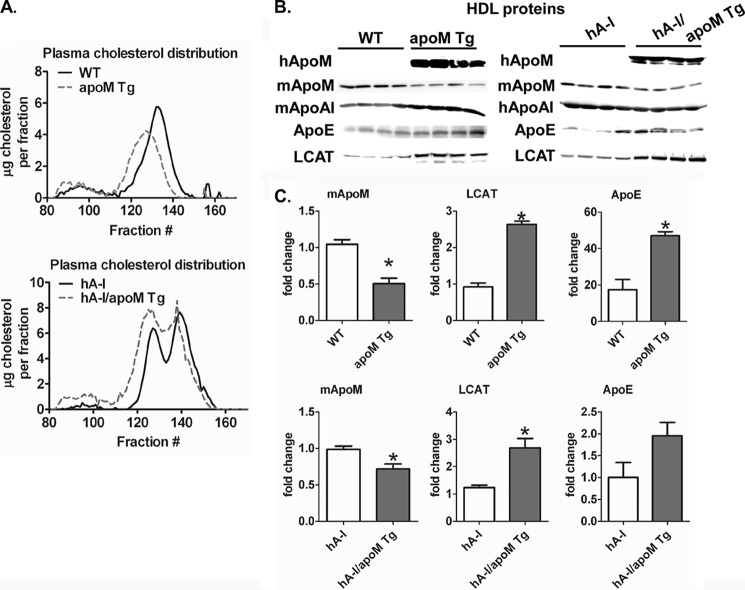
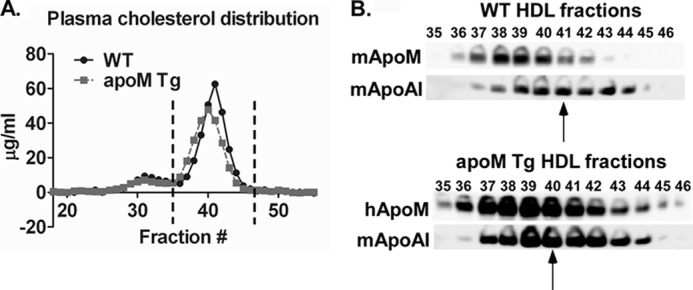
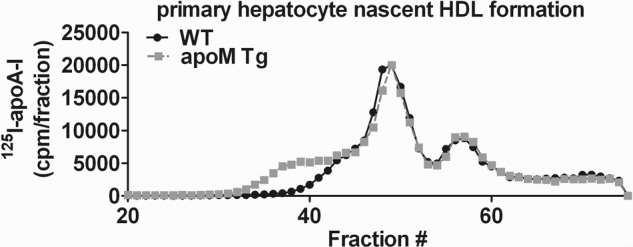
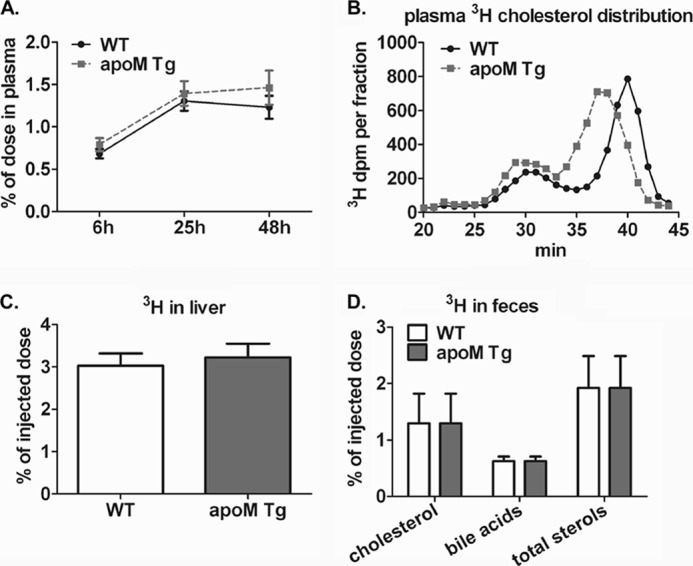
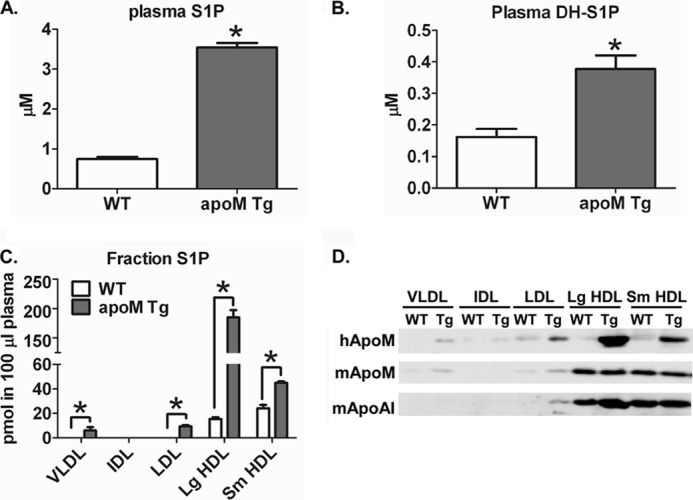
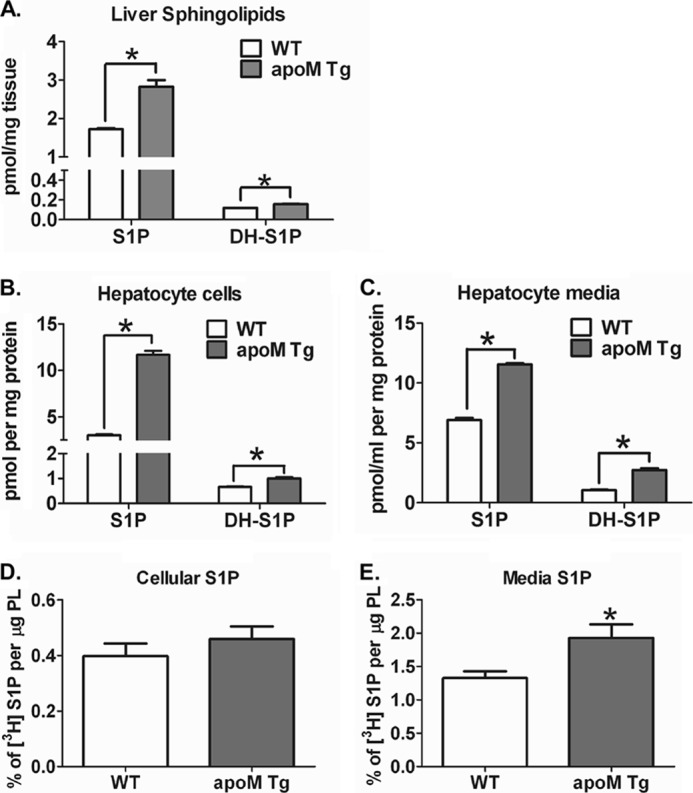
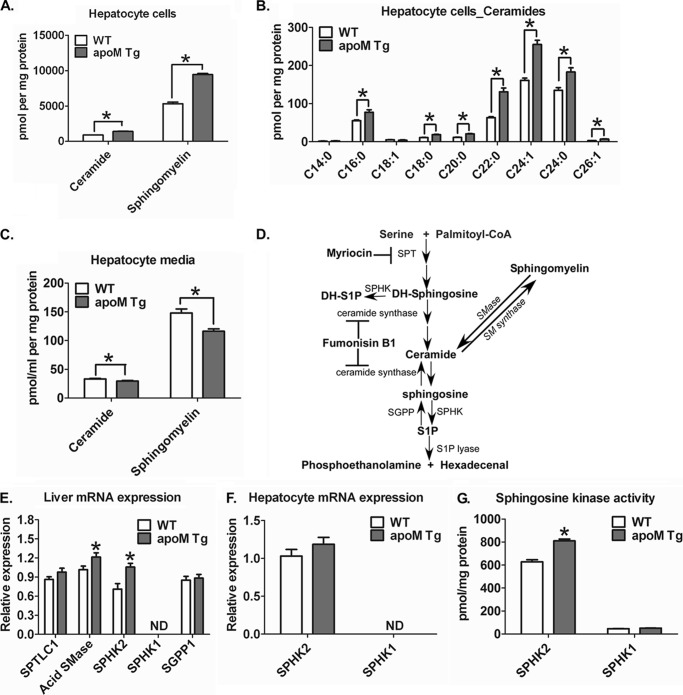
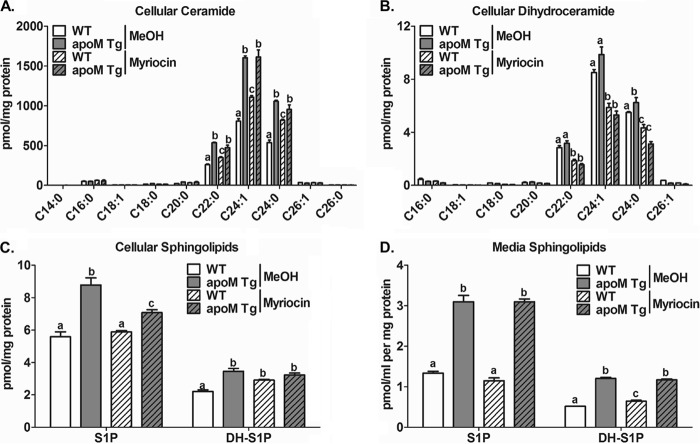
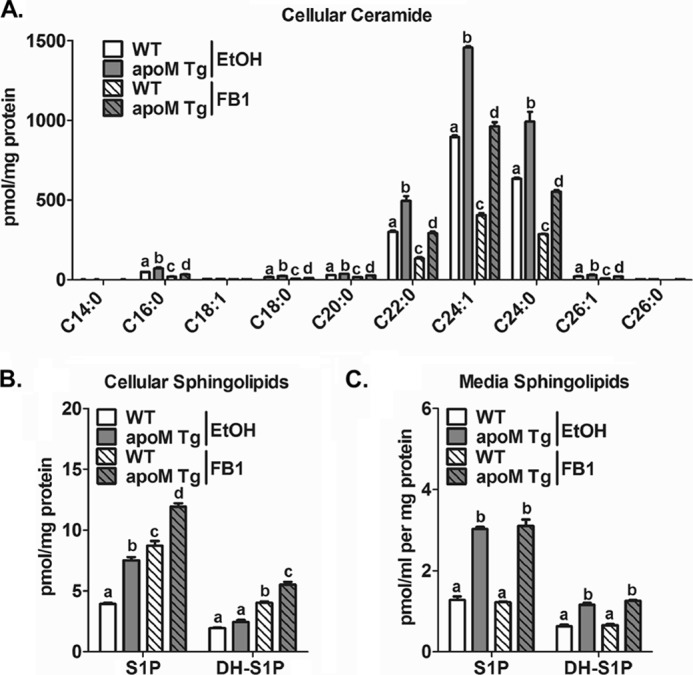
Apolipoprotein M (apoM), a lipocalin family member, preferentially associates with plasma HDL and binds plasma sphingosine 1-phosphate (S1P), a signaling molecule active in immune homeostasis and endothelial barrier function. ApoM overexpression in ABCA1-expressing HEK293 cells stimulated larger nascent HDL formation, compared with cells that did not express apoM; however, the in vivo role of apoM in HDL metabolism remains poorly understood. To test whether hepatic apoM overexpression increases plasma HDL size, we generated hepatocyte-specific apoM transgenic (APOM Tg) mice, which had an ∼3-5-fold increase in plasma apoM levels compared with wild-type mice. Although HDL cholesterol concentrations were similar to wild-type mice, APOM Tg mice had larger plasma HDLs enriched in apoM, cholesteryl ester, lecithin:cholesterol acyltransferase, and S1P. Despite the presence of larger plasma HDLs in APOM Tg mice, in vivo macrophage reverse cholesterol transport capacity was similar to that in wild-type mice. APOM Tg mice had an ∼5-fold increase in plasma S1P, which was predominantly associated with larger plasma HDLs. Primary hepatocytes from APOM Tg mice generated larger nascent HDLs and displayed increased sphingolipid synthesis and S1P secretion. Inhibition of ceramide synthases in hepatocytes increased cellular S1P levels but not S1P secretion, suggesting that apoM is rate-limiting in the export of hepatocyte S1P. Our data indicate that hepatocyte-specific apoM overexpression generates larger nascent HDLs and larger plasma HDLs, which preferentially bind apoM and S1P, and stimulates S1P biosynthesis for secretion. The unique apoM/S1P-enriched plasma HDL may serve to deliver S1P to extrahepatic tissues for atheroprotection and may have other as yet unidentified functions.

Keywords: ApoM; Apolipoproteins; Hepatocyte; High Density Lipoprotein (HDL); Liver; Sphingolipid; Sphingosine 1-Phosphate.


Figures

FIGURE 1.
FIGURE 1.
Lipid and lipoprotein characteristics of APOM Tg mice. A, Western blot analysis of 2 μl of WT and APOM Tg mouse plasma using an antibody that detects both mouse and human apoM. Band intensities were quantified using MultiGauge software. The intensity of the least intense band for WT and APOM Tg plasma was set to 1, and other bands were normalized to its intensity and are shown above the bands. B, plasma total cholesterol (TC), phospholipid (PL), and triglycerides (TG) from male mice were analyzed by enzymatic assays. C, plasma lipoproteins were fractionated by FPLC, and cholesterol concentration in VLDL, LDL, and HDL was determined by enzymatic assays. B and C, n = 13, 9, 11, and 12 for WT, APOM Tg, hA-I, and hA-I/APOM Tg mice, respectively. *, p < 0.05, APOM Tg mice versus their control (WT or hA-I) counterparts. hA-I = human apoA-I transgenic mouse.
FIGURE 2.
FIGURE 2.
APOM Tg and WT mice have comparable hepatic TG secretion. A, plasma samples from mice of the indicated genotypes were Western-blotted for apolipoprotein B. B, Western blot results were quantified using MultiGauge software. Total apoBs from apoB100 and apoB48 were calculated, normalized to total apoB in WT sample on the 1st lane as fold change, and plotted; *, p < 0.05. C and D, mice fasted for 4 h were retro-orbitally injected with tyloxapol (500 mg/kg) to block TG lipolysis acutely. Blood was collected before injection (0) and 30, 60, 120, and 180 min after injection. C, plasma TG levels at each time point were determined by enzymatic assay and plotted; n = 5. D, slope of the line of best fit for each mouse was calculated by linear regression analysis using GraphPad Prism software; *, p < 0.05.
FIGURE 3.
FIGURE 3.
APOM Tg mice have larger HDL enriched in LCAT, apoM, and apoE. A, representative lipoprotein cholesterol distribution profiles were acquired from high resolution FPLC size fractionation of equal volumes of plasma from mice of the indicated genotypes. B, FPLC fractionated HDL (A) was pooled (fractions 110–150) and an equivalent fraction of each HDL peak was TCA-precipitated and subjected to SDS-PAGE and Western blot analysis. h, human; m, mouse. C, quantification of Western blot band intensities in B was performed with MultiGauge software. Fold change of each protein is expressed relative to the expression levels in WT samples. *, p < 0.05.
FIGURE 4.
FIGURE 4.
ApoM predominantly associates with large HDL. A, equivalent amount of plasma from WT and APOM Tg mice was fractionated using FPLC, and cholesterol concentrations were determined using enzymatic assay. B, HDL fractions from 35–46 (dashed vertical lines) were collected and TCA-precipitated for Western blot analysis of mouse and human apoM and mouse apoA-I. The arrows identify the fractions corresponding to the peak of HDL cholesterol.
FIGURE 5.
FIGURE 5.
Primary hepatocytes from APOM Tg mice generated larger nascent HDL. Primary hepatocytes from WT and APOM Tg mice were isolated and incubated with 125I-apoA-I (10 μg/ml) in serum-free DMEM for 24 h. Media were collected and fractionated using a Superdex-200 FPLC column, and the radiolabel in each fraction was quantified.
FIGURE 6.
FIGURE 6.
APOM Tg and WT mice have similar in vivo macrophage reverse cholesterol transport. J774 macrophages loaded with acetylated LDL and [3H]cholesterol were injected into the peritoneal cavity of WT and APOM Tg mice (2.9 × 10⁶ dpm in 500 μl of cell suspension/mouse; n = 7 for each genotype). Blood samples were collected as indicated, and mice were sacrificed 48 h after injection for terminal blood and liver harvest; feces were collected throughout the 48-h study. Data were normalized to the percentage of injected dose. A, plasma radioactivity. B, equivalent volumes of terminal plasma were fractionated by FPLC, and radioactivity in each fraction was quantified. C, liver lipids were extracted as described (41), and lipid radioactivity was quantified. D, cholesterol and bile acids were extracted from feces, and radioactivity was quantified.
FIGURE 7.
FIGURE 7.
APOM Tg mice have increased S1P in large sized HDLs. Plasma S1P (A) and DH-S1P (B) in WT and APOM Tg mice were quantified by mass spectrometry. n = 3 for each genotype, *, p < 0.05. C, plasma lipoproteins were fractionated by FPLC, and aliquots of the indicated lipoprotein fractions were quantified for S1P using mass spectrometry; results were normalized to 100 μl of plasma. n = 3 for each genotype; *, p < 0.05. D, lipoprotein fractions from equivalent volumes of plasma were TCA-precipitated, subjected to SDS-PAGE, and Western-blotted for human and mouse apoM and mouse apoA-I. Lg, large. Sm, small.
FIGURE 8.
FIGURE 8.
APOM Tg mice have increased hepatic S1P production and secretion. A, liver tissues were subjected to lipid extraction, and S1P and DH-S1P were analyzed by LC-ESI-MS/MS. B and C, hepatocytes from WT and APOM Tg mice were incubated in 1 ml of serum-free medium for 6 h. Lipids were extracted from cells (B) and media (C), and sphingolipids were analyzed by LC-ESI-MS/MS. A–C, data were normalized to liver or cellular protein content; n = 3 for each genotype; *, p < 0.05. D and E, primary hepatocytes were isolated from WT and APOM Tg mice and incubated in serum-free media for 2 h at 37 °C before addition of 0.225 μCi of [3H]sphingosine and 1.5 mm sphingosine for 10 min to radiolabel cells. Medium was replaced with serum-free DMEM, and cells were incubated at 37 °C for 2 h before media and cells were collected for lipid extraction. Cell (D) and media (E) [3H]S1P radiolabel were quantified by liquid scintillation spectroscopy after differential extraction (48). Data are presented as [3H]S1P/total 3H radiolabel × 100%, normalized to cellular PL content measured by phosphorus assay. n = 3/genotype; *, p < 0.05.
FIGURE 9.
FIGURE 9.
Hepatocytes from APOM Tg mice have increased sphingolipid content. Lipids were extracted from hepatocytes (A and B) and media (C) as described in Fig. 7B, and ceramide and sphingomyelin content was quantified by LC-ESI-MS/MS. B, different chain length species of ceramide are shown; numbers indicate chain length followed by the number of double bonds in the fatty acid. Data were normalized by cellular protein content; *, p < 0.05. D, simplified pathway of sphingolipid synthesis. SPT, serine palmitoyltransferase; SPHK, sphingosine kinase; SGPP, S1P phosphatase; S1P, sphingosine 1-phosphate; SMase, sphingomyelinase. Myriocin is an inhibitor of de novo (i.e. SPT) sphingolipid synthesis, and fumonisin B1 is an inhibitor of ceramide synthase (i.e. sphingosine N-acyltransferase). E and F, RNA was isolated from liver (E) and primary hepatocytes (F) of WT and APOM Tg mice, transcribed into cDNA, and quantified by quantitative real time PCR. E, expression of serine palmitoyltransferase long chain 1 (SPTLC1), acid sphingomyelinase (acid SMase), sphingosine kinase 2 (SphK2), sphingosine kinase 1 (SphK1), and sphingosine 1-phosphate phosphatase 1 (SGPP1), normalized to GAPDH. n = 6/genotype. *, p < 0.05. F, expression of primary hepatocyte SphK1 and SphK2 mRNA, normalized to GAPDH. n = 4 for each genotype. ND, not detected. G, activities of sphingosine kinase 1 and 2 were measured in hepatocytes from WT and APOM Tg mice following procedures described in Ref. . n = 9 for each genotype. *, p < 0.05.
FIGURE 10.
FIGURE 10.
Effect of myriocin on sphingolipid biosynthesis in hepatocytes overexpressing apoM. Primary hepatocytes were isolated from WT and APOM Tg mice and treated with vehicle or 10 μm myriocin for 6 h in 1 ml of serum-free media. Lipids were extracted from cells (A–C) and media (D) and the indicated sphingolipids determined by LC-ESI-MS/MS. Different chain length species of ceramide (A) and dihydroceramides (B) are shown; numbers indicate chain length followed by the number of double bonds in the fatty acid. Unlike letters in the figure indicate significant differences (p < 0.05) between genotypes or between vehicle and myriocin treatment.
FIGURE 11.
FIGURE 11.
Inhibition of hepatocyte ceramide synthases in APOM Tg mice increases cellular levels of S1P and DH-S1P without affecting their secretion. Primary hepatocytes were isolated from WT and APOM Tg mice and treated with vehicle or 25 μm fumonisin B1 for 6 h in 1 ml of serum-free media. Lipids were extracted from hepatocytes (A and B) and media (C) and the indicated sphingolipids determined by LC-ESI-MS/MS. A, different chain length species of ceramide are shown; numbers indicate chain length, followed by the number of double bonds in the fatty acid. Unlike letters in the figure indicate significant differences (p < 0.05) between genotypes or between vehicle and myriocin treatment.

References

    1. Fisher E. A., Feig J. E., Hewing B., Hazen S. L., Smith J. D. (2012) High-density lipoprotein function, dysfunction, and reverse cholesterol transport. Arterioscler. Thromb. Vasc. Biol. 32, 2813–2820 - PMC - PubMed
    1. AIM-HIGH Investigators, Boden W. E., Probstfield J. L., Anderson T., Chaitman B. R., Desvignes-Nickens P., Koprowicz K., McBride R., Teo K., Weintraub W. (2011) Niacin in patients with low HDL cholesterol levels receiving intensive statin therapy. N. Engl. J. Med. 365, 2255–2267 - PubMed
    1. Voight B. F., Peloso G. M., Orho-Melander M., Frikke-Schmidt R., Barbalic M., Jensen M. K., Hindy G., Hólm H., Ding E. L., Johnson T., Schunkert H., Samani N. J., Clarke R., Hopewell J. C., Thompson J. F., Li M., Thorleifsson G., Newton-Cheh C., Musunuru K., Pirruccello J. P., Saleheen D., Chen L., Stewart A., Schillert A., Thorsteinsdottir U., Thorgeirsson G., Anand S., Engert J. C., Morgan T., Spertus J., Stoll M., Berger K., Martinelli N., Girelli D., McKeown P. P., Patterson C. C., Epstein S. E., Devaney J., Burnett M. S., Mooser V., Ripatti S., Surakka I., Nieminen M. S., Sinisalo J., Lokki M. L., Perola M., Havulinna A., de Faire U., Gigante B., Ingelsson E., Zeller T., Wild P., de Bakker P. I., Klungel O. H., Maitland-van der Zee A. H., Peters B. J., de Boer A., Grobbee D. E., Kamphuisen P. W., Deneer V. H., Elbers C. C., Onland-Moret N. C., Hofker M. H., Wijmenga C., Verschuren W. M., Boer J. M., van der Schouw Y. T., Rasheed A., Frossard P., Demissie S., Willer C., Do R., Ordovas J. M., Abecasis G. R., Boehnke M., Mohlke K. L., Daly M. J., Guiducci C., Burtt N. P., Surti A., Gonzalez E., Purcell S., Gabriel S., Marrugat J., Peden J., Erdmann J., Diemert P., Willenborg C., König I. R., Fischer M., Hengstenberg C., Ziegler A., Buysschaert I., Lambrechts D., Van de Werf F., Fox K. A., El Mokhtari N. E., Rubin D., Schrezenmeir J., Schreiber S., Schäfer A., Danesh J., Blankenberg S., Roberts R., McPherson R., Watkins H., Hall A. S., Overvad K., Rimm E., Boerwinkle E., Tybjaerg-Hansen A., Cupples L. A., Reilly M. P., Melander O., Mannucci P. M., Ardissino D., Siscovick D., Elosua R., Stefansson K., O'Donnell C. J., Salomaa V., Rader D. J., Peltonen L., Schwartz S. M., Altshuler D., Kathiresan S. (2012) Plasma HDL cholesterol and risk of myocardial infarction: a mendelian randomisation study. Lancet 380, 572–580 - PMC - PubMed
    1. Glomset J. A. (1968) The plasma lecithins:cholesterol acyltransferase reaction. J. Lipid Res. 9, 155–167 - PubMed
    1. Mineo C., Shaul P. W. (2012) Novel biological functions of high-density lipoprotein cholesterol. Circ. Res. 111, 1079–1090 - PMC - PubMed

Publication types

MeSH terms

LinkOut - more resources