. 2014 Feb;13(2):606-20.
doi: 10.1074/mcp.M113.033704. Epub 2013 Dec 7.

Correlation of actin crosslinker and capper expression levels with stereocilia growth phases

Affiliations

Correlation of actin crosslinker and capper expression levels with stereocilia growth phases

Matthew R Avenarius et al. Mol Cell Proteomics. 2014 Feb.

Abstract

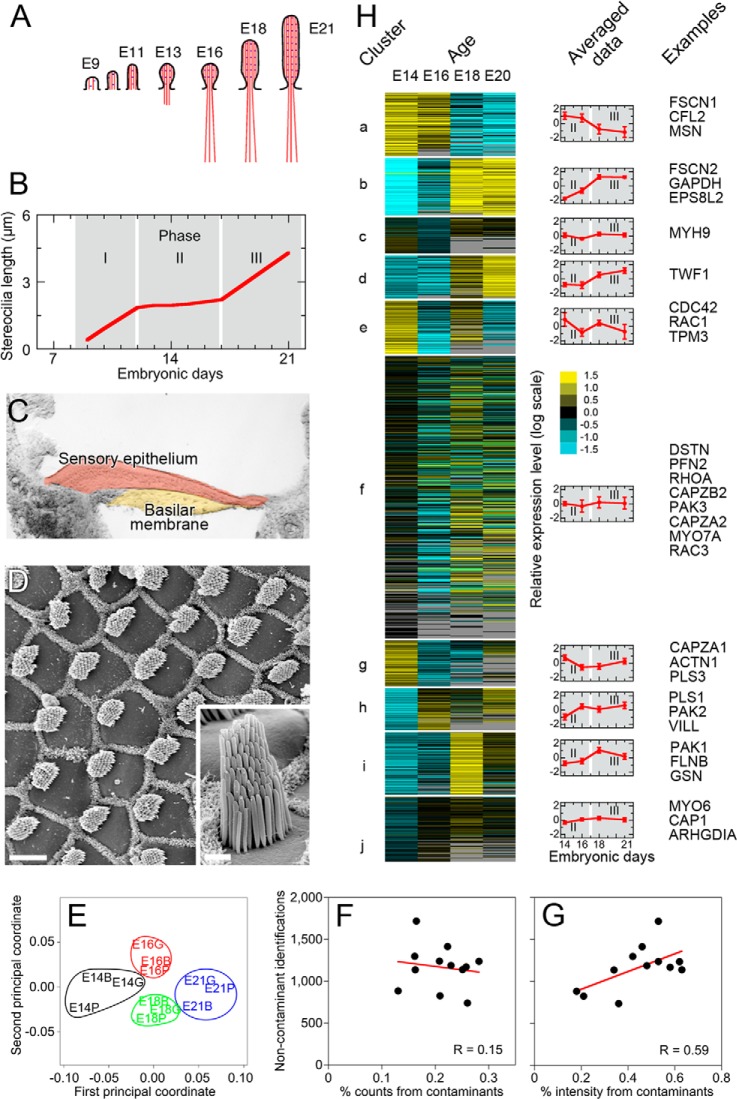
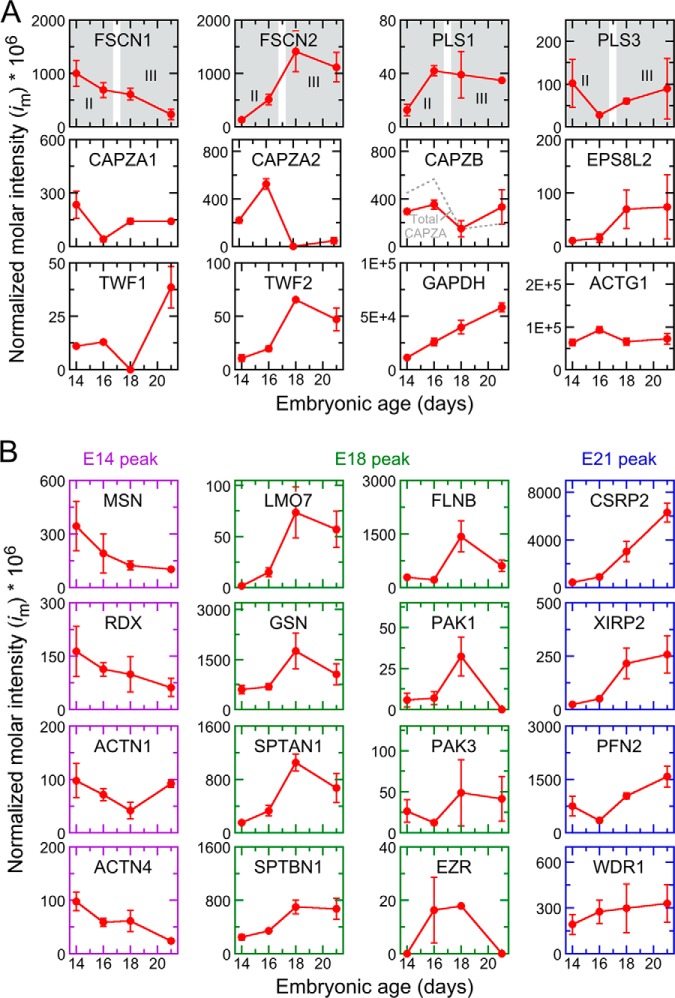
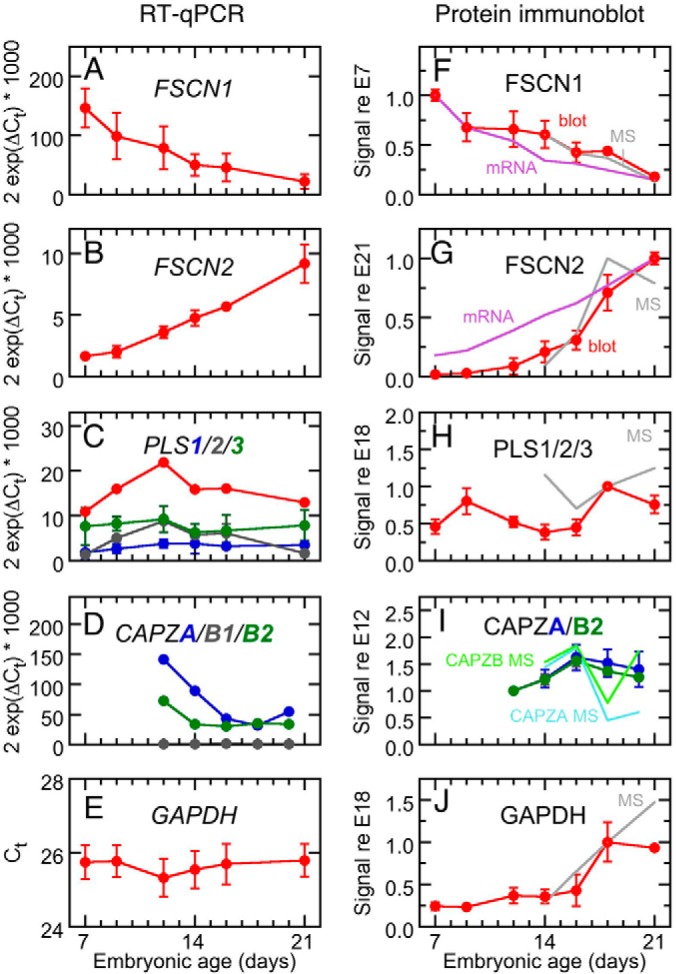
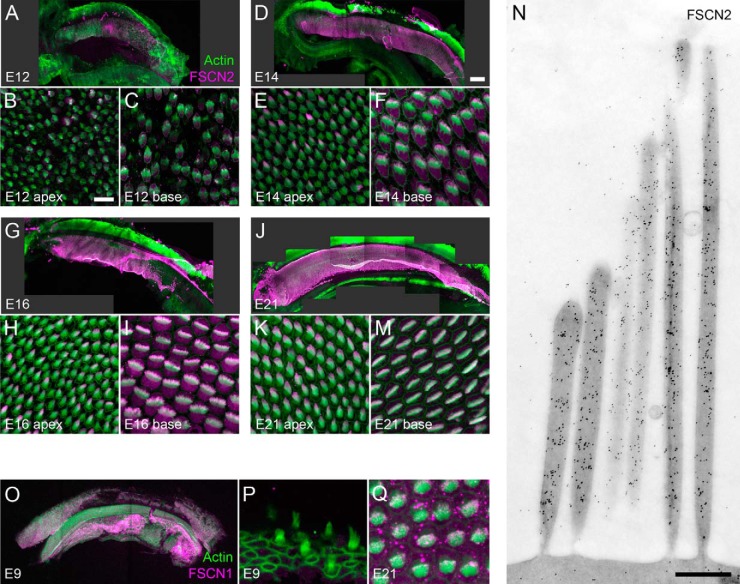
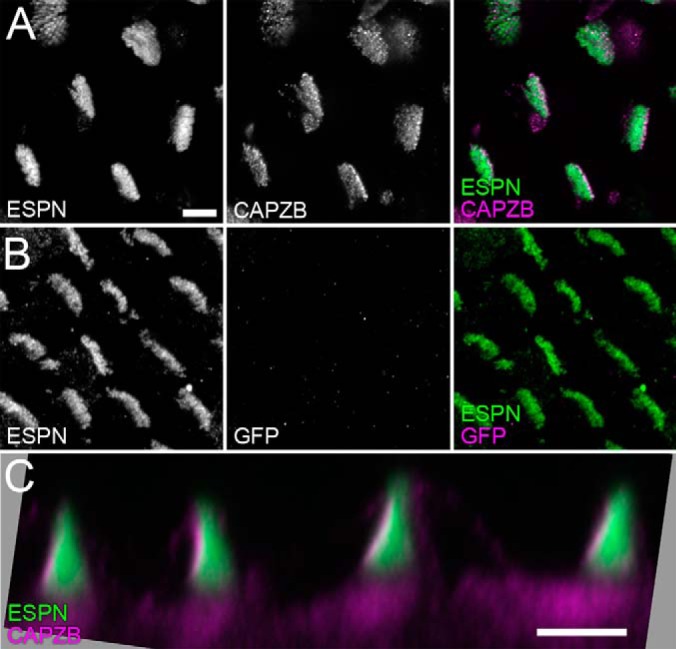
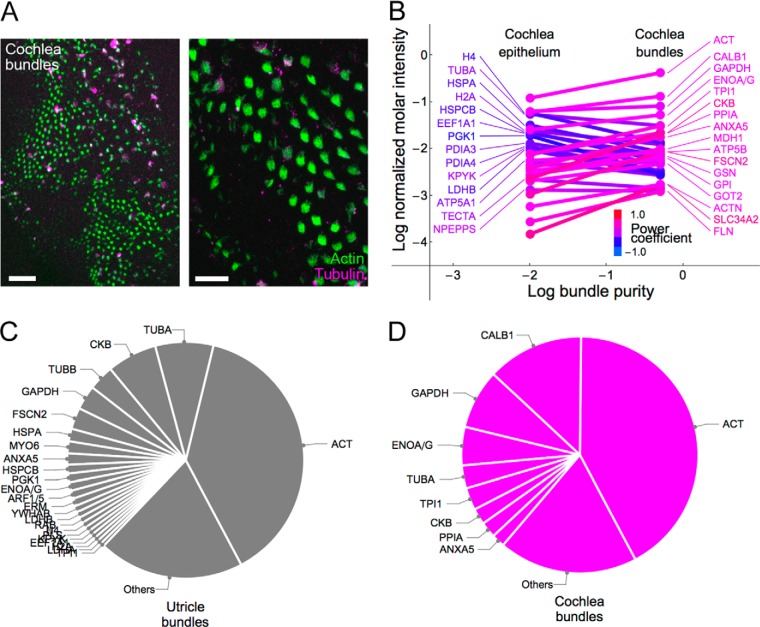
During development of the chick cochlea, actin crosslinkers and barbed-end cappers presumably influence growth and remodeling of the actin paracrystal of hair cell stereocilia. We used mass spectrometry to identify and quantify major actin-associated proteins of the cochlear sensory epithelium from E14 to E21, when stereocilia widen and lengthen. Tight actin crosslinkers (i.e. fascins, plastins, and espin) are expressed dynamically during cochlear epithelium development between E7 and E21, with FSCN2 replacing FSCN1 and plastins remaining low in abundance. Capping protein, a barbed-end actin capper, is located at stereocilia tips; it is abundant during growth phase II, when stereocilia have ceased elongating and are increasing in diameter. Capping protein levels then decline during growth phase III, when stereocilia reinitiate barbed-end elongation. Although actin crosslinkers are readily detected by electron microscopy in developing chick cochlea stereocilia, quantitative mass spectrometry of stereocilia isolated from E21 chick cochlea indicated that tight crosslinkers are present there in stoichiometric ratios relative to actin that are much lower than their ratios for vestibular stereocilia. These results demonstrate the value of quantitation of global protein expression in chick cochlea during stereocilia development.


Figures

Fig. 1.
Fig. 1.
Mass spectrometric analysis of protein expression during development of chick cochlear hair bundles. A, Cartoon illustrating development of stereocilia actin filaments from E9-E21. Modified from ref (1). B, Stereocilia lengthening phases during development. Elongation halts between E12 and E17 (phase II). Data are from Fig. 5 in ref (3). C, Differential interference contrast image of chick cochlea cryosection. The sensory epithelium (orange), which sits on the basilar membrane (yellow), forms the epithelial peels used for mass spectrometry. The tectorial membrane is absent from this sample. Whole chick cochlea, used in other experiments, includes the sensory epithelium, basilar membrane, tectorial membrane, and some surrounding tissue. D, Surface preparation of E21 chick cochlea imaged with scanning electron microscopy. Hair bundles appear in a regular array, protruding from the smooth surface of hair cells; supporting cell apical surfaces are packed with microvilli and thus appear as a ruff surrounding each hair cell. Scale bar, 10 μm. Inset, one hair bundle. Scale bar, 1 μm. E, Analysis of protein profile similarities among biological samples. Colored symbols represent samples; color represents developmental age (E14, black; E16, red; E18, green; E21, blue). The distances among protein profiles of samples are shown using a multidimensional scaling plot. The distances were computed using 644 proteins that had at least two measurements per sample; missing data were imputed by 10-nearest-neighbor averaging method. Note that biological samples from a given time point cluster together (circles). F, Plot showing relationship between contaminant counts and total noncontaminant counts. Each point represents one biological sample. No correlation. G, Plot showing relationship between contaminant intensity and total noncontaminant intensity. More proteins were detected in samples with larger contaminant fractions, suggesting that increased contaminant intensity in those fractions resulted from improved mass spectrometer sensitivity, not an increase in the amount of contamination in the biological sample. H, Developmental expression profiles of chick cochlear proteins (from sensory epithelium peels at indicated ages) segregated into 10 groups by k-means clustering. Heat map on left displays all clustered proteins. Blue corresponds to decreased relative expression; yellow corresponds to increased relative expression. Black, no change; gray, missing data. Graphs in middle show averaged data for each cluster. Examples on right indicate representative actin-associated proteins in each cluster.
Fig. 2.
Fig. 2.
Expression of actin-associated proteins during cochlear development as determined by quantitative mass spectrometry. A, Normalized molar intensity profiles for actin and actin-capping or actin-crosslinking proteins. Stereocilia elongation phases are indicated in gray in the top row of panels. Mean from three biological replicates ± S.E. are plotted; some points correspond to detection in only one of three biological replicates. im = 0 indicates that the protein was not detected at that stage. In the CAPZB panel, the sum of CAPZA1 and CAPZA2 signals is shown by a dashed gray line. B, Profiles for other actin-associated proteins. The frame color indicates the developmental stage showing peak protein expression (purple, E14; green, E18; blue, E21).
Fig. 3.
Fig. 3.
Expression analysis of tight crosslinkers and cappers during cochlear development. A–E, qPCR. F–J, protein immunoblotting. F, FSCN1 signal referenced to signal at E7. Gray line indicates mass spectrometry data (MS). G, FSCN2 referenced to E21. H, Pan-plastin referenced to E18. Note that the lack of correspondence with the mass spectrometry data. I, CAPZA (dark blue) and CAPZB (dark green), referenced to E12. Light blue and green lines show mass spectrometry data for CAPZA and CAPZB. J, GAPDH referenced to E18.
Fig. 4.
Fig. 4.
Localization of FSCN2 and FSCN1 during chick cochlear development. A–M, Immunofluorescence of FSCN2 in chick cochlea. A–C, E12 cochlea. D–F, E14 cochlea. G–I, E16 cochlea. J–M, E21 cochlea. N, Immunogold electron microscopy of FSCN2 in E21 cochlea. O–Q, Immunofluorescence of FSCN1 in chick cochlea. Scale bar in B is 10 μm and applies to panels C, E, F, H, I, K, M, P, and Q as well. Scale bar in D is 200 μm and applies to panels A, G, J, O as well. Scale bar in N is 200 nm. Color coding in A applies to B–Q as well.
Fig. 5.
Fig. 5.
Localization of CAPZB2 in E21 chick cochlea hair bundles. A, CAPZB2 localization with ESPN counterstaining of stereocilia actin. Scale bar (5 μm) applies to B as well. B, Anti-GFP monoclonal antibody signal under identical conditions to A. C, Profile view of CAPZB2 staining. Note that the left-hand edge of each bundle, where stereocilia tips are located, is labeled strongly. Scale bar is 5 μm.
Fig. 6.
Fig. 6.
Chick cochlea hair bundle proteins. A, Isolated chick cochlea hair bundles, stained with phalloidin (green) to highlight stereocilia and anti-tubulin (magenta) to show contamination and kinocilia. Note recovery of bundles is variable from region to region and there is significant contamination in some areas. Left panel scale bar, 100 μm; right panel scale bar, 20 μm. B, Mole fractions of proteins in cochlear epithelium (left) and bundle (right); the slope of the line connecting them represents bundle-to-epithelium enrichment. Proteins most highly enriched in the epithelium are indicated at left, whereas bundle-enriched proteins are at right. Hue represents relative enrichment (power coefficient of fit connecting points) for each protein. C, Utricle bundle proteins; the most abundant proteins that collectively account for ∼80% of the total im are labeled. The last twelve protein symbols, which overlap in the figure, are ARF1/5, ERM, YWHAB, LDHB, RAB, H4, PLS, KPYK, EEF1A1, H2A, LDHA, and TPI1. D, Cochlea bundle proteins; those accounting for ∼80% of the total im are indicated.

References

    1. Tilney L. G., Tilney M. S., DeRosier D. J. (1992) Actin filaments, stereocilia, and hair cells: how cells count and measure. Ann. Rev. Cell Biol. 8, 257–274 - PubMed
    1. Kaltenbach J. A., Falzarano P. R., Simpson T. H. (1994) Postnatal development of the hamster cochlea. II. Growth and differentiation of stereocilia bundles. J. Comp. Neurol. 350, 187–198 - PubMed
    1. Tilney L. G., DeRosier D. J. (1986) Actin filaments, stereocilia, and hair cells of the bird cochlea. IV. How the actin filaments become organized in developing stereocilia and in the cuticular plate. Dev. Biol. 116, 119–129 - PubMed
    1. Stokes D. L., DeRosier D. J. (1991) Growth conditions control the size and order of actin bundles in vitro. Biophys. J. 59, 456–465 - PMC - PubMed
    1. DeRosier D. J., Tilney L. G., Egelman E. (1980) Actin in the inner ear: the remarkable structure of the stereocilium. Nature. 287, 291–296 - PubMed

Publication types

MeSH terms

LinkOut - more resources