. 2014 Mar;12(3):408-420.
doi: 10.1158/1541-7786.MCR-13-0206-T. Epub 2013 Dec 6.

NF-κB activation-induced anti-apoptosis renders HER2-positive cells drug resistant and accelerates tumor growth

Affiliations

NF-κB activation-induced anti-apoptosis renders HER2-positive cells drug resistant and accelerates tumor growth

Shannon T Bailey et al. Mol Cancer Res. 2014 Mar.

Abstract

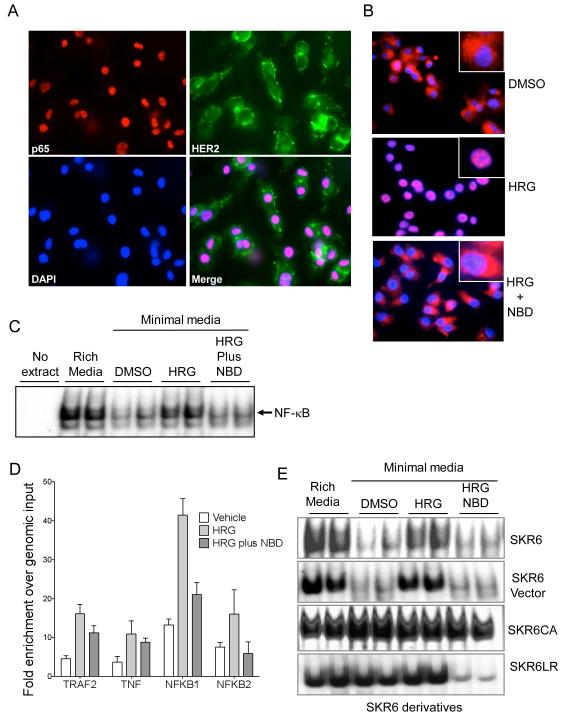
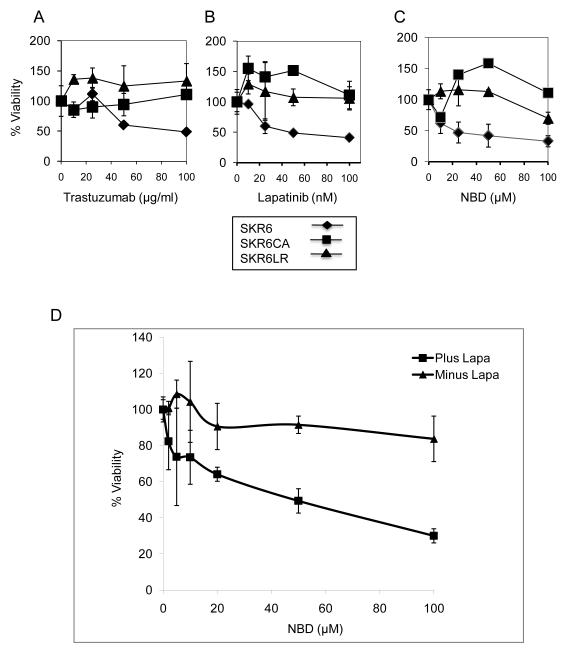
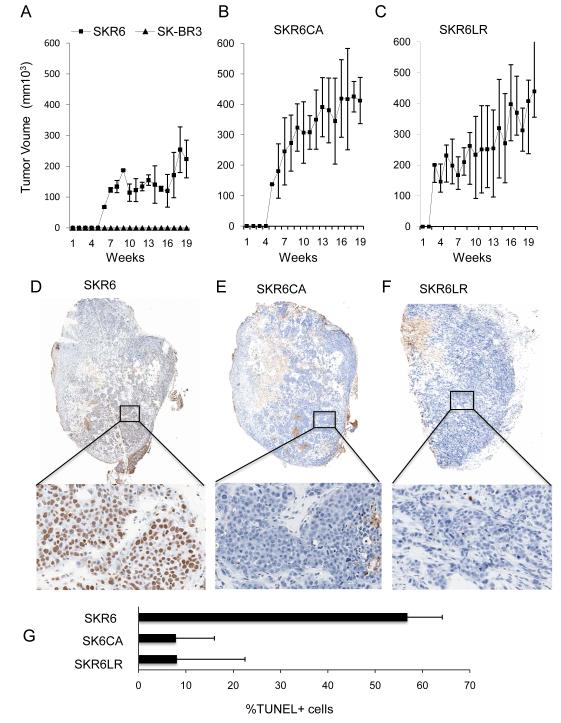
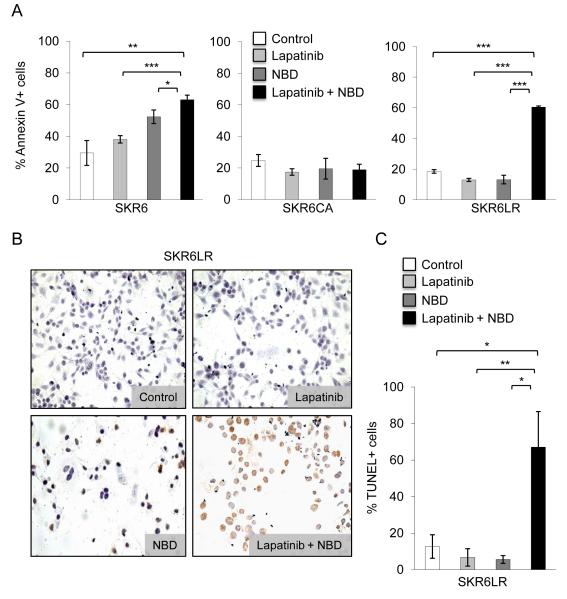
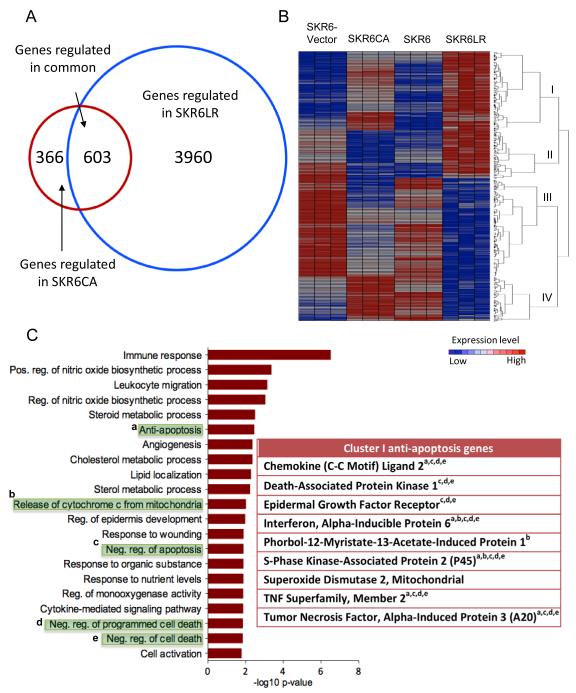
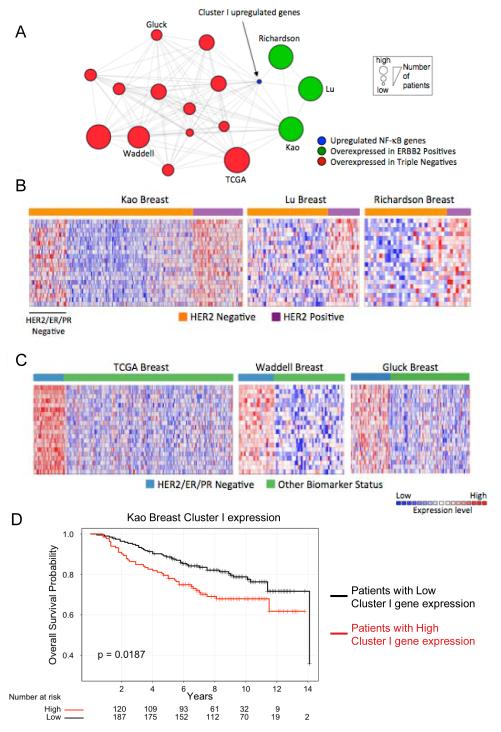
Breast cancers with HER2 overexpression are sensitive to drugs targeting the receptor or its kinase activity. HER2-targeting drugs are initially effective against HER2-positive breast cancer, but resistance inevitably occurs. We previously found that NF-κB is hyperactivated in a subset of HER2-positive breast cancer cells and tissue specimens. In this study, we report that constitutively active NF-κB rendered HER2-positive cancer cells resistant to anti-HER2 drugs and cells selected for lapatinib resistance upregulated NF-κB. In both circumstances, cells were antiapoptotic and grew rapidly as xenografts. Lapatinib-resistant cells were refractory to HER2 and NF-κB inhibitors alone but were sensitive to their combination, suggesting a novel therapeutic strategy. A subset of NF-κB-responsive genes was overexpressed in HER2-positive and triple-negative breast cancers, and patients with this NF-κB signature had poor clinical outcome. Anti-HER2 drug resistance may be a consequence of NF-κB activation, and selection for resistance results in NF-κB activation, suggesting that this transcription factor is central to oncogenesis and drug resistance. Clinically, the combined targeting of HER2 and NF-κB suggests a potential treatment paradigm for patients who relapse after anti-HER2 therapy. Patients with these cancers may be treated by simultaneously suppressing HER2 signaling and NF-κB activation.

Implications: The combination of an inhibitor of IκB kinase (IKK) inhibitor and anti-HER2 drugs may be a novel treatment strategy for drug-resistant human breast cancers.


Figures

Figure 1
Figure 1
Functional assessment of NF-κB activation in SKBR3 cells. A, Intracellular localization of NF-κB p65 and HER2 was determined by immunofluorescence. p65 (red, upper left) is found in the nucleus of SKBR3 cells growing exponentially in rich medium. Membranous staining of HER2 (green, upper right) reflects the cell surface localization of the receptor-like protein. Nuclei are stained with DAPI (blue, bottom left). The merged image of p65, HER2 and DAPI is shown (bottom right). B, Cells grown in minimal medium were treated with DMSO (vehicle, top panel), stimulated with 2nM HRG for 18 hours (middle panel), or HRG-stimulated cells were treated with 10μM NBD for 72h. NF-κB p65 is in red and nuclei were stained with DAPI. The inset shows a higher magnification of a single cell. C, The NF-κB DNA binding activity in 10μg of nuclear protein from parental SKBR3 cells cultured in the indicated conditions: Minimal medium stripped of growth factors, rich or complete media, minimal media supplemented with DMSO, minimal media plus 2nM HRG for 18 hours, or HRG plus 10 μg NBD for an additional 72 hours. NF-kB p65 DNA binding was assessed by EMSA. D, DNA Binding activity of indicated genes in SKR6 cells by chromatin immunoprecipitation assay (ChIP). TNF, tumor necrosis factor; TRAF2, TNF-receptor activating Factor 2; NFKB1, nuclear factor kappa B 1; and nuclear factor kappa B 2. E, NF-kB DNA binding activity by EMSA in nuclear proteins. 10μg of nuclear extracts from SKR6 and SKR6 Vector and 5μg of nuclear extracts from SKR6CA and SKR6LR cells were used. Each derivative was grown in rich medium, minimal medium, or minimal medium supplemented as in panel C.
Figure 2
Figure 2
Sensitivity of SKR6 and derivative cells to anti-HER2 treatment or to the specific IKK inhibitor, NBD. SKR6, SKR6CA, and SKR6LR cells were grown in rich medium treated as indicated. A, Trastuzumab at the doses indicated. B, Lapatinib at the doses indicated. C, NBD at the doses indicated. Cells were treated for 72 hours and viability measured by the MTS assay. Error bars are one standard deviation, each assay was done in triplicate. D, SKR6LR cells were grown in the presence of DMSO only (Minus Lapa) or 500nM Lapatinib (Plus Lapa) with increasing concentrations of NBD (μM). The cell viability was measured by the MTS assay after 72 hours; error bars represent 1 standard deviation of triplicates.
Figure 3
Figure 3
Xenograft growth and apoptotic fractions of SKBR3 and its derivatives. A, Growth of SKBR3 or its HER2-enhanced clonal derivative SKR6. B, SKR6CA. C, SKR6LR. 3×10⁶ cells were suspended in 0.25ml PBS mixed with 0.25 ml of matrigel and implanted subcutaneously on the dorsal surface of nu/nu mice. Tumor volume was measured weekly; error bars are 1 standard deviation of the mean of 10 tumors. At 8-10 weeks, tumors from SKR6CA and SKR6LR cells, and at 17 weeks tumors from SKR6 were excised, formalin fixed and paraffin embedded. Sections were stained with Apop Tag™ for apoptotic nuclei. Representative images are shown at 1.5X magnification, and expanded to 20X to visualize the apoptotic fraction. D, Representative section from SKR6 xenografts. E, Representative section from SKR6CA xenografts. F, Representative section from SKR6LR xenografts. G, Mean apoptotic fractions from SKR6, SKR6CA and SKR6LR xenografts were determined by analysis of five independent sections from each of three tumors quantified by image analysis. Error bars are 1 standard deviation of the mean apoptotic fraction.
Figure 4
Figure 4
Apoptotic fraction of the drug treated cultured cells. A, SKR6, SKR6CA, and SKR6LR cells were grown in minimal media in the presence of DMSO, Lapatinib (100nM), NBD (10μM) or Lapatinib (100nM) plus NBD (10μM) for 18h. Cells were stained with AnnexinV-FITC and propidium iodide and analyzed by FACS. Error bars represent 1 standard deviation of triplicate determinations. B, SKR6LR cells were grown in rich media in the presence of DMSO (control), Lapatinib (100nM), NBD (10μM) or Lapatinib (100nM) plus NBD (10μM) for 18h. Apoptosis was visualized using Apop Tag™ and displayed at 20X. C, Quantitation of the apoptotic fraction of SKR6LR measured by TUNEL-FACS using from cells treated as in B was measured by TUNELFACS analysis using APO BrdU™. Error bars represent 1 standard deviation of triplicate determinations.
Figure 5
Figure 5
Overlapping gene expression in SKR6CA and SKR6LR cells. A, Venn diagram showing the number of differentially expressed genes in SKR6CA vs. SKR6 Vector (red circle) and SKR6LR vs. SKR6 cells (blue circle). 603 genes were found in differentially expressed in both SKR6CA and SKR6LR. B, Hierarchical clustering diagram of the 603 differentially expressed genes in common. Four top clusters were identified: Cluster I, up-regulated in both SKR6CA and SKR6LR cells; Cluster II, down-regulated in SKR6CA and up-regulated in SKR6LR cells; Cluster III, down-regulated in SKR6CA and SKR6LR cells; Cluster IV, up-regulated in SKR6CA and down-regulated in SKR6LR cells. C, Gene ontology of Cluster I genes demonstrates enrichment for genes associated with apoptosis. The table lists genes found in the following GO categories (shaded in green): a, anti-apoptosis; b, release of cytochrome c from mitochondria; c, negative regulation of apoptosis; d, negative regulation of programmed cell death; e, negative regulation of death.
Figure 6
Figure 6
Cluster I genes overexpressed in SKR6CA and SKR6LR are associated with HER2-positive and triple-negative human breast cancer. A, Oncomine Concepts Map analysis (https://www.oncomine.com). Cluster I genes were interrogated in publically available primary breast tumor gene expression datasets to determine significant overexpression in tumor subsets. These associations were represented in a network using Cytoscape (http://www.cytoscape.org). In this network, edges connect datasets that are significantly associated with cluster I genes (shown in blue). Significant associations were found with datasets from patients with triple-negative breast cancer (red circles) and those with HER2-positive breast cancer (green circles). Each node size is proportional to the number of patients demonstrating association in each dataset. B, Heatmaps of the Kao, Lu, and Richardson datasets (shown as green nodes in A) demonstrate the relative expression of the cluster I genes in HER2-positive versus HER2-negative patients (Materials and Methods for references). C) Heatmaps of Cluster I gene expression in the TCGA, Waddell, and Gluck breast datasets, representative of the HER2/ER/PR-negative datasets (Triple-negative, are shown as red nodes in A) demonstrate their relative expression in HER2/ER/PR-negative patients. D, Kaplan-Meier analysis of the probability of overall survival in HER2-positive and HER2/ER/PR-negative patients based on expression of Cluster I genes, dichotomized by the median gene expression into High and Low expression groups. The p-value was calculated with the log-rank test.

References

    1. Cancer Genome Atlas N Comprehensive molecular portraits of human breast tumours. Nature. 2012 Oct 4;490(7418):61–70. PubMed PMID: 23000897. Pubmed Central PMCID: 3465532. - PMC - PubMed
    1. Baselga J, Swain SM. Novel anticancer targets: revisiting ERBB2 and discovering ERBB3. Nature reviews Cancer. 2009 Jul;9(7):463–75. PubMed PMID: 19536107. Epub 2009/06/19. eng. - PubMed
    1. Yarden Y, Sliwkowski MX. Untangling the ErbB signalling network. Nature reviews Molecular cell biology. 2001 Feb;2(2):127–37. PubMed PMID: 11252954. Epub 2001/03/17. eng. - PubMed
    1. Hynes NE, Lane HA. ERBB receptors and cancer: the complexity of targeted inhibitors. Nature reviews Cancer. 2005 May;5(5):341–54. PubMed PMID: 15864276. - PubMed
    1. Spector N, Xia W, El-Hariry I, Yarden Y, Bacus S. HER2 therapy. Small molecule HER-2 tyrosine kinase inhibitors. Breast Cancer Res. 2007 Mar 2;9(2):205. PubMed PMID: 17338834.

Publication types

MeSH terms