. 2013 Jul 1;108(503):10.1080/01621459.2013.789695.
doi: 10.1080/01621459.2013.789695.

Latent Supervised Learning

Affiliations

Latent Supervised Learning

Susan Wei et al. J Am Stat Assoc. .

Abstract

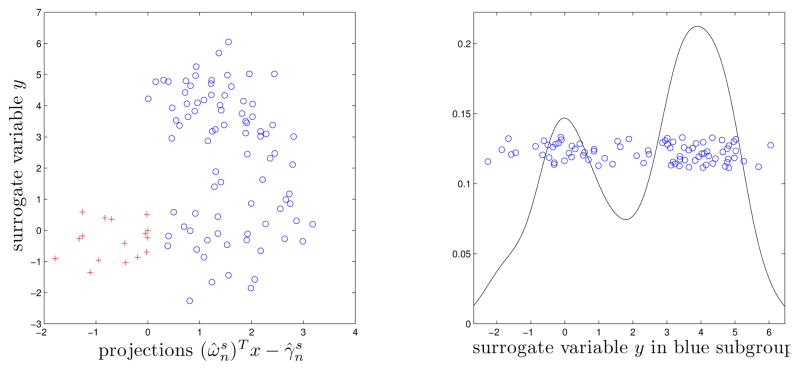
A new machine learning task is introduced, called latent supervised learning, where the goal is to learn a binary classifier from continuous training labels which serve as surrogates for the unobserved class labels. A specific model is investigated where the surrogate variable arises from a two-component Gaussian mixture with unknown means and variances, and the component membership is determined by a hyperplane in the covariate space. The estimation of the separating hyperplane and the Gaussian mixture parameters forms what shall be referred to as the change-line classification problem. A data-driven sieve maximum likelihood estimator for the hyperplane is proposed, which in turn can be used to estimate the parameters of the Gaussian mixture. The estimator is shown to be consistent. Simulations as well as empirical data show the estimator has high classification accuracy.

Keywords: Classification and Clustering; Glivenko-Cantelli classes; Sieve Maximum Likelihood Estimation; Sliced Inverse Regression; Statistical Learning.


Figures

Figure 1
Figure 1
Toy example illustrating the differences between SIR and the proposed method of incorporating the surrogate variable described in Section 5.3. The estimate ν̂n(ω0, γ0) is less accurate than the SIR estimate in the first two dimensions but a better overall estimate across all three dimensions.
Figure 2
Figure 2
Estimated subgroups when there is actually only one component in the model. The plot here shows that the method gives a reasonable answer when there is only one component.
Figure 3
Figure 3
Left panel shows estimated subgroups when the decision boundary is not linear but quadratic. Right panel shows the bimodality of the red subgroup. These plots suggest an easy visual tool to diagnose this type of assumption violation.
Figure 4
Figure 4
Diabetes dataset. First panel shows the projections onto the estimated separating hyperplane versus the surrogate variable, 2-hour insulin. The second and third panels show the distribution of the surrogate variable in each of the discovered subgroups.
Figure 5
Figure 5
Heart dataset. First panel shows the projections onto the estimated separating hyperplane versus the surrogate variable, maximum-heart-rate achieved. The second and third panels show the distribution of the surrogate variable in each of the discovered subgroups.
Figure 6
Figure 6
Scatterplot of the continuous covariates in the Prostate dataset. A complete list of the full names of the variables is given in the Appendix. The symbols represent the subgroups found by the proposed method where the circle subgroup has higher lpsa values on average. Note that the circle group has higher log cancer volume (lcavol) and higher log prostate weight (lweight), two variables that are linked to the severity of the cancer.
Figure 7
Figure 7
Distributions of the subgroups discovered by the proposed method in the Prostate dataset for the categorical variables SVI and Gleason score. Note that the circle subgroup (higher lpsa) mostly comprises the higher end of the Gleason score and comprises the presence for SVI entirely.

References

    1. Carlstein E, Müller H, Siegmund D. Number v. 23 in Lecture notes-monograph series. Institute of Mathematical Statistics; 1994. Change-Point Problems.
    1. Fleming TR. Surrogate Endpoints And FDA’s Accelerated Approval Process. Health A3. 2005;24(1):67–78. - PubMed
    1. Frank A, Asuncion A. UCI machine learning repository. 2010.
    1. Geman S, Hwang CR. Nonparametric Maximum Likelihood Estimation by the Method of Sieves. The Annals of Statistics. 1982;10(2):401–414.
    1. Grenander U. Abstract Inference. Wiley; 1981.

Publication types

LinkOut - more resources