. 2013 Nov 11:2013:519080.
doi: 10.1155/2013/519080. eCollection 2013.

Nexfin noninvasive continuous hemodynamic monitoring: validation against continuous pulse contour and intermittent transpulmonary thermodilution derived cardiac output in critically ill patients

Affiliations

Nexfin noninvasive continuous hemodynamic monitoring: validation against continuous pulse contour and intermittent transpulmonary thermodilution derived cardiac output in critically ill patients

Koen Ameloot et al. ScientificWorldJournal. .

Abstract

Introduction: Nexfin (Bmeye, Amsterdam, Netherlands) is a noninvasive cardiac output (CO) monitor based on finger arterial pulse contour analysis. The aim of this study was to validate Nexfin CO (NexCO) against thermodilution (TDCO) and pulse contour CO (CCO) by PiCCO (Pulsion Medical Systems, Munich, Germany).

Patients and methods: In a mix of critically ill patients (n = 45), NexCO and CCO were measured continuously and recorded at 2-hour intervals during the 8-hour study period. TDCO was measured at 0-4-8 hrs.

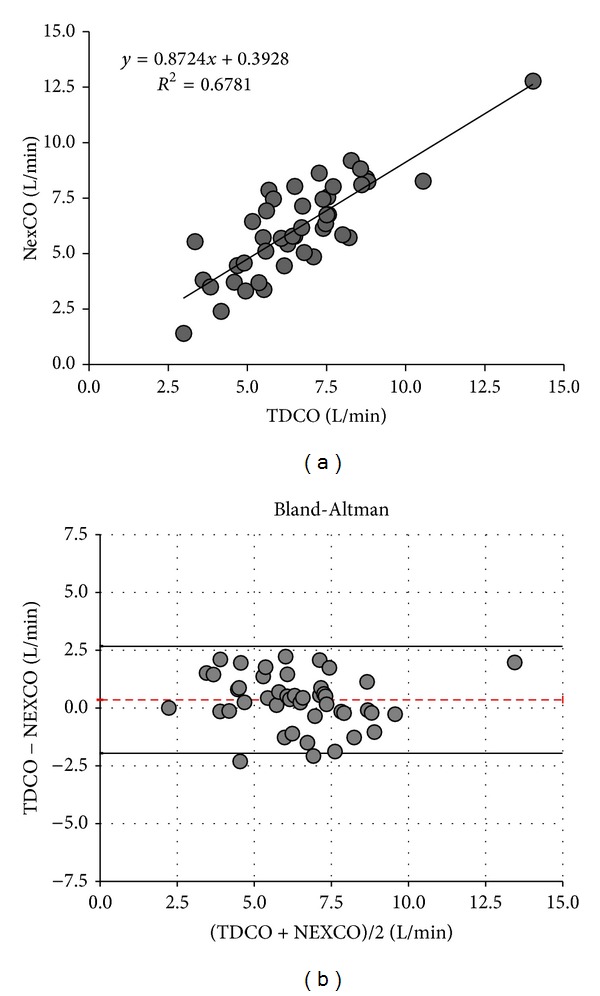
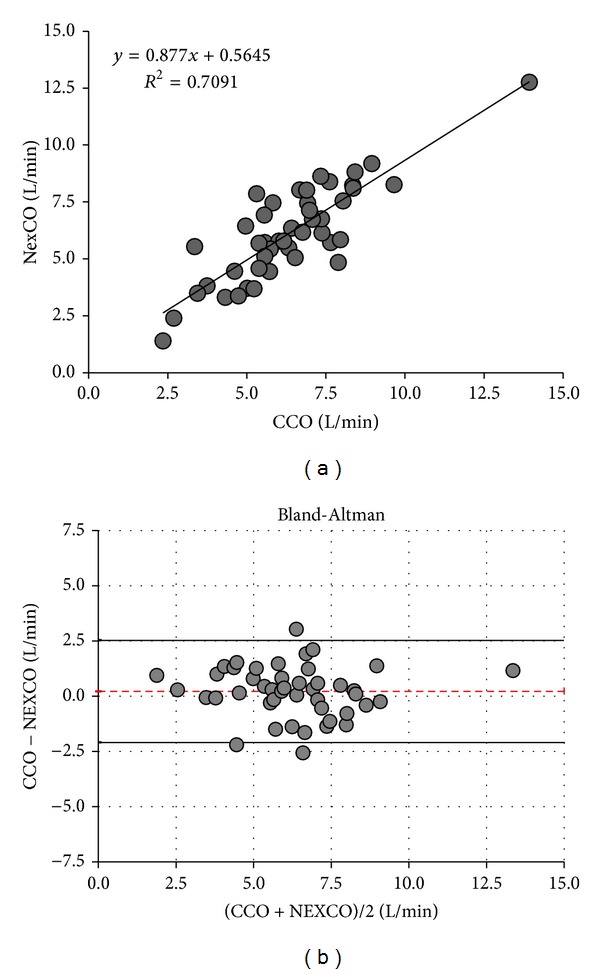
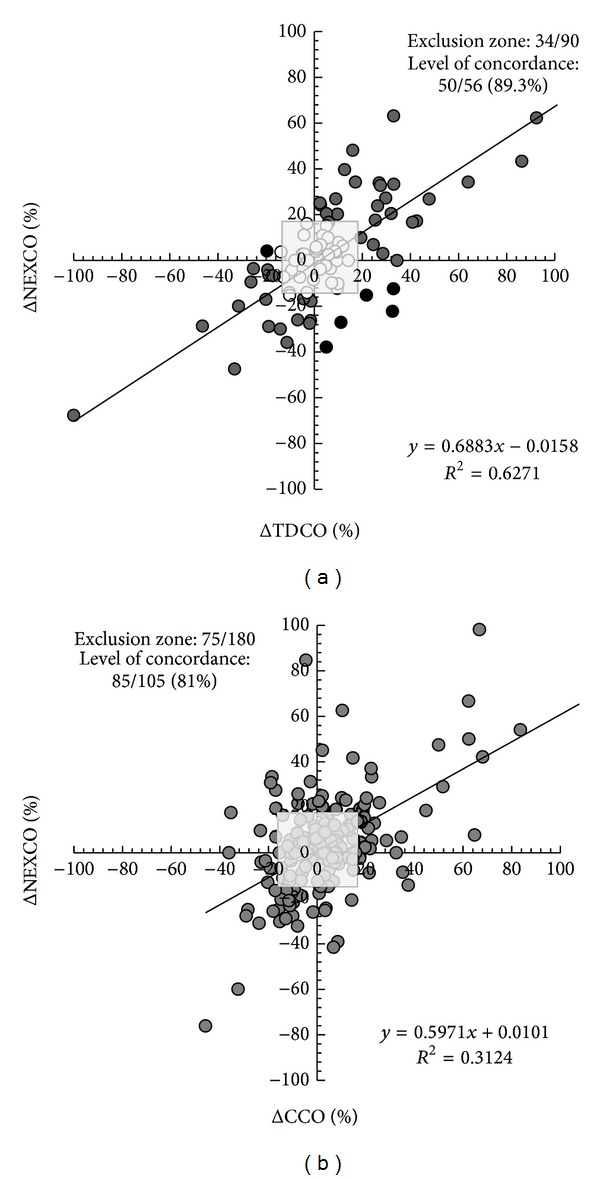
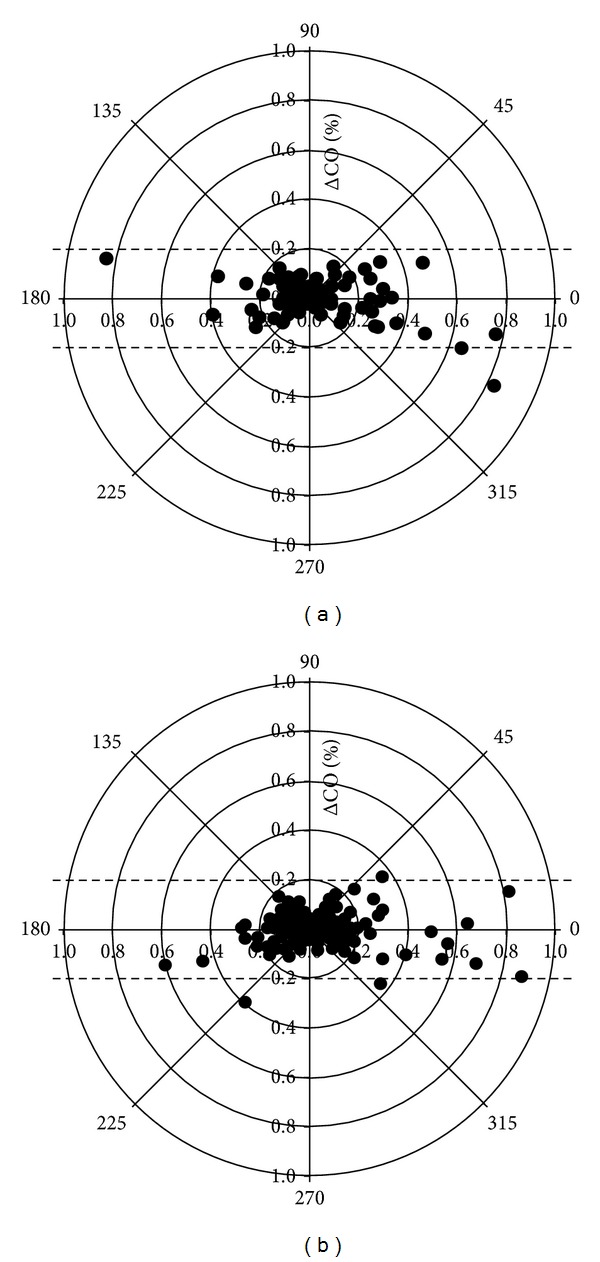
Results: NexCO showed a moderate to good (significant) correlation with TDCO (R (2) 0.68, P < 0.001) and CCO (R (2) 0.71, P < 0.001). Bland and Altman analysis comparing NexCO with TDCO revealed a bias (± limits of agreement, LA) of 0.4 ± 2.32 L/min (with 36% error) while analysis comparing NexCO with CCO showed a bias (±LA) of 0.2 ± 2.32 L/min (37% error). NexCO is able to follow changes in TDCO and CCO during the same time interval (level of concordance 89.3% and 81%). Finally, polar plot analysis showed that trending capabilities were acceptable when changes in NexCO (ΔNexCO) were compared to ΔTDCO and ΔCCO (resp., 89% and 88.9% of changes were within the level of 10% limits of agreement).

Conclusion: we found a moderate to good correlation between CO measurements obtained with Nexfin and PiCCO.


Figures

Figure 1
Figure 1
Cardiac output measurements: TDCO versus NexCO. Only one average value per patient is plotted. (a) Regression analysis. (b) Bland-Altman analysis. Patient averages with the mean cardiac output ranges (x-axis) and bias errors (y-axis) during the 8-hour study period. Dotted line indicates bias and solid lines indicate lower and upper limit of agreement. NexCO: Nexfin cardiac output. TDCO: thermodilution cardiac output.
Figure 2
Figure 2
Cardiac output measurements: CCO versus NexCO. Only one average value per patient is plotted. (a) Regression analysis. (b) Bland-Altman analysis. Patient averages with the mean cardiac output ranges (x-axis) and errors (y-axis) during the 8-hour study period. Dotted line indicates bias and solid lines indicate lower and upper limit of agreement. CCO: pulse contour continuous cardiac output NexCO: Nexfin cardiac output.
Figure 3
Figure 3
Four quadrants trend plot. (a) Plot for 90 paired measurements of ΔNeXCO and ΔTDCO. From the 90 initial paired measurements, 34 pairs were excluded (exclusion zone is indicated as grey dots within grey-shaded square) because either ΔNexCO or ΔTDCO was ≤ ±15% or because ΔNexCO or ΔTDCO was equal to zero. The calculated level of concordance was 89.3% (50/56) (6 pairs felt within the upper left or lower right quadrant and correspond to poor concordance, black dots). See text for explanation. (b) Plot for 180 paired measurements of ΔNeXCO and ΔCCO. From the 180 initial paired measurements, 75 pairs were excluded (exclusion zone is indicated as grey-shaded square) because either ΔNexCO or ΔCCO was ≤ ±15% change or because ΔNexCO or ΔCCO was equal to zero. The calculated level of concordance was 81% (85/105). See text for explanation.
Figure 4
Figure 4
Polar plot. The distance from the center of the plot represents the mean change in cardiac output (ΔCO, expressed as %, with 1,0 referring to 100% change from baseline) and the angle θ with the horizontal (0-degree radial) axis represents agreement. The less the disagreement between CO measurements, the closer data pairs will lie along the horizontal radial axis. Data with good trending will lie within 10% limits of agreement. However, data with poor trending will be scattered throughout the plot and lie outside the limits of good and acceptable agreement (i.e., 10% and 20%, resp.). See text for explanation. (a) Polar plot for 90 paired measurements of mean ΔCO (%), calculated as absolute value of (ΔNeXCO + ΔTDCO)/2. From the 90 initial data 98.9% of the data points lie within the 20% lines and 89% within the 10% lines, suggesting acceptable trending capabilities. (b) Polar plot for 180 paired measurements of mean ΔCO (%), calculated as absolute value of (ΔNeXCO + ΔCCO)/2. From the 180 initial data 98.3% of the data points lie within the 20% lines and 88.9% within the 10% lines, suggesting acceptable trending capabilities.

References

    1. Calvin JE, Driedger AA, Sibbald WJ. Does the pulmonary capillary wedge pressure predict left ventricular preload in critically ill patients? Critical Care Medicine. 1981;9(6):437–443. - PubMed
    1. Malbrain M, De Potter P, Deeren D. Cost effectiveness of minimally invasive hemodynamic monitoring. In: Vincent JL, editor. Yearbook of Intensive Care and Emergency Medicine. 2005. pp. 603–618.
    1. Michard F. Do we need to know cardiac preload? In: Vincent JL, editor. Yearbook of Intensive Care and Emergency Medicine. 2004. pp. 694–701.
    1. Oren-Grinberg A. The piCCO monitor. International Anesthesiology Clinics. 2010;48(1):57–85. - PubMed
    1. Genahr A, McLuckie A. Transpulmonary thermodilution in the critically ill. British Journal of Intensive Care. 2004;14(1):6–10.

LinkOut - more resources