Comparative Study
. 2013 Sep 26;1(4):283-92.
doi: 10.1016/j.stemcr.2013.08.007. eCollection 2013.

Direct comparison of autologous and allogeneic transplantation of iPSC-derived neural cells in the brain of a non-human primate

Affiliations
Comparative Study

Direct comparison of autologous and allogeneic transplantation of iPSC-derived neural cells in the brain of a non-human primate

Asuka Morizane et al. Stem Cell Reports. .

Abstract

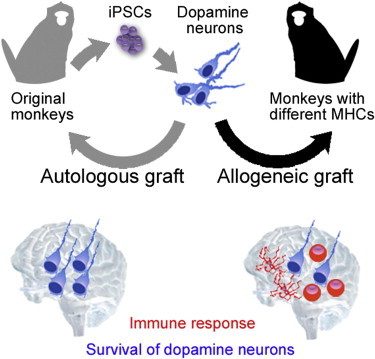
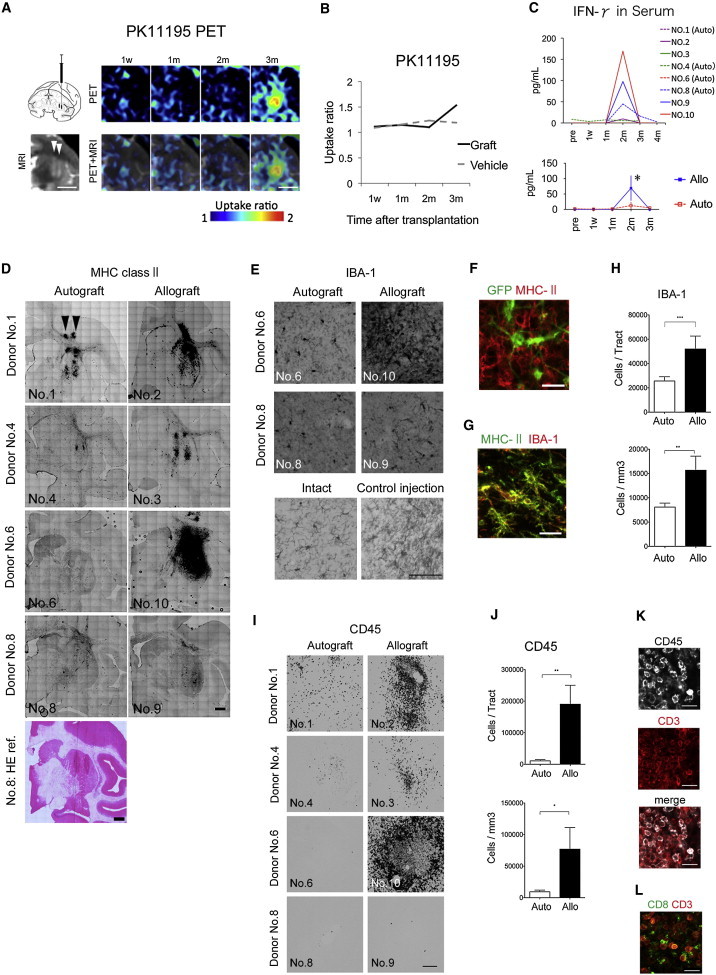
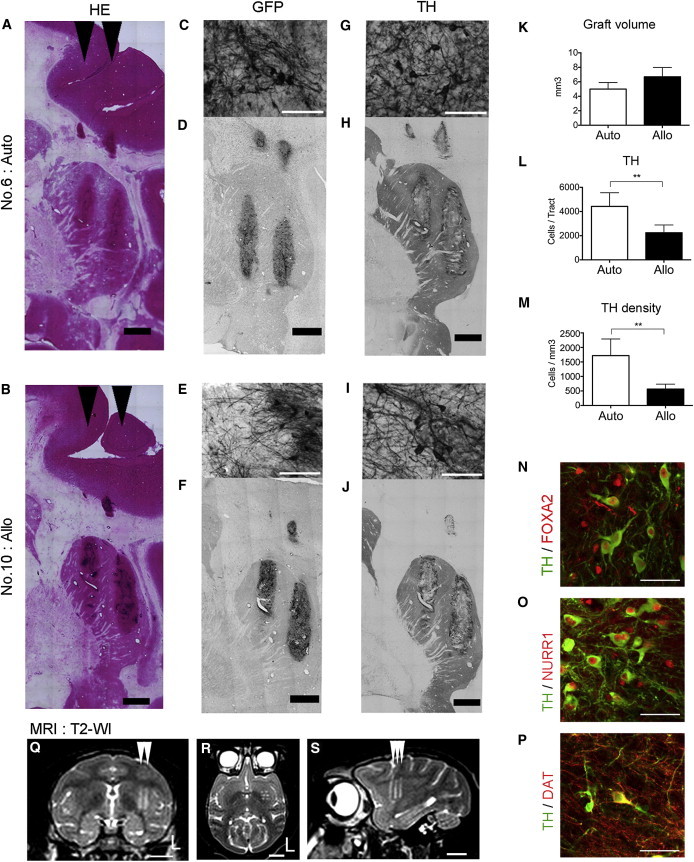
Induced pluripotent stem cells (iPSCs) provide the potential for autologous transplantation using cells derived from a patient's own cells. However, the immunogenicity of iPSCs or their derivatives has been a matter of controversy, and up to now there has been no direct comparison of autologous and allogeneic transplantation in the brains of humans or nonhuman primates. Here, using nonhuman primates, we found that the autologous transplantation of iPSC-derived neurons elicited only a minimal immune response in the brain. In contrast, the allografts caused an acquired immune response with the activation of microglia (IBA-1(+)/MHC class II(+)) and the infiltration of leukocytes (CD45(+)/CD3(+)). Consequently, a higher number of dopaminergic neurons survived in the autografts. Our results suggest that the autologous transplantation of iPSC-derived neural cells is advantageous for minimizing the immune response in the brain compared with allogeneic grafts.


Figures

None
Graphical abstract
Figure 1
Figure 1
Characterization of Primate iPSCs and iPSC-Derived Neurons (A–H) Phase-contrast images (A, B, and G) and immunostaining for pluripotent markers (C–F) of iPSCs (T7). GFP was detected during live imaging (G and H) in the same field. (I–M) Teratoma formation at 3 months after transplantation in the testes of SCID mice. H&E staining of the sections showed histological features of the neuroepithelium (J), cartilage (K), muscle (L) and gut-like epithelium (M). (N) The protocol used for neural differentiation. (O) Expression analyses of neural markers and Oct4 by flow cytometry. The negative control was a cell sample stained only by secondary antibody (PSA-NCAM) or the isotype control (TUBβIII and OCT4). The positive control for OCT4 was undifferentiated (day 0) iPSCs. (P) qPCR for the differentiation of donor cells. The data are shown as the means ± SD (n = 4 independent experiments). (Q) Immunostaining of primate iPSC-derived neurons on day 39. (R) Quantification of immunocytochemical analyses for each iPSC line. Data are shown as the means ± SD (n = 3 independent experiments). SER, serotonin, TUBβIII, β-tubulin class III. Scale bars: 200 μm in (A)–(H), 50 μm in insets of (C)–(F), 100 μm in (J)–(M) and (Q). See also Figure S1 and Tables S2 and S3.
Figure 2
Figure 2
Identification of MHC Expression and Typing of Donor Cells (A) Flow-cytometric analyses for MHC-I (HLA-A, HLA-B, and HLA-C). Incubation of the cells with IFN-γ for 48 hr increased the MHC-I expression (green). (B) Temporal MHC-I expression analysis of monkey iPSCs by qPCR. The data were obtained from three (n = 3 for fibro iPSCs) or five (n = 5 for blood iPSCs) different experiments. Data are shown as the means ± SD. (C and E) Monkey MHC-I (Mafa) allele sequences detected by next-generation sequencing (C) and cluster analysis of the monkey MHCs (E). The colored letters indicate a comparatively high expression level of the MHC-I allele, comprising >10% of cDNA sequence reads. The gray background indicates the MHC-A allele, and the others indicate the MHC-B allele. (D) Combinations of donor cells and recipient animals. Episomal v., established with episomal vectors; P, passage number just before starting the differentiation of donor cells; Retro v., established with retrovirus vectors. See also Figure S4D and Tables S1–S3.
Figure 3
Figure 3
Immune Responses following Autologous or Allogeneic Transplantation (A and B) [11C]PK11195 PET study of the allografts in animal No. 10, in which the highest immune response was observed histologically. The illustration in (A) shows the method used for cell injection. (C) Temporal changes in the serum level of IFN-γ. Bottom: a two-way ANOVA was performed with Bonferroni’s multiple-comparisons test; n = 4 animals, p < 0.05. Data are shown as the means ± SEM. (D–H) Histological analyses of the host-resident microglia. The image of H&E staining of animal No. 8 is shown as an anatomical reference for coronal sections (D). The arrowheads in (A) and (D) indicate the direction of the cell injections. (I–L) Histological analyses of infiltrating leukocytes. Scale bars: 1 cm (A), 2 mm (D), 100 μm (E and I), and 20 μm (F, G, K, and L). Quantitative data are presented as the means ± SEM (n = 22 tracts). Ratio paired t tests were performed for the auto- and allo-tracts. ∗∗∗p = 0.0003 (H, upper), ∗∗p = 0.0015 (H, lower), ∗∗p = 0.0035 (J, upper), p = 0.0122 (J, lower). All of the PET, MRI, and histological images show coronal sections. See also Figures S2–S4 and Table S3.
Figure 4
Figure 4
Graft Survival in a Primate Brain (A–P) Histological analyses of a brain section with H&E staining, and the immunohistochemical findings. (K) Quantitative analyses of the graft volume. (L and M) Survival of TH+ neurons in the grafts. (N and O) The TH+ neurons expressed markers of the midbrain phenotype: Foxa2 (N) and Nurr1 (O). (P) The DAT was also positively stained. (Q–S) Magnetic resonance images of a representative animal (No. 6, autograft) at 3 months after the transplant. The arrowheads indicate the directions of the cell injections. (Q) coronal, (R) axial, and (S) sagittal. The letter L indicates the left side. Scale bars: 2 mm (A, B, D, F, H, and J), 50 μm (C, E, G, I, N, O, and P), and 1 cm (Q–S). Quantitative data are presented as the mean ± SEM (n = 22 tracts). Ratio paired t tests were performed for the auto- and allo-tracts: ∗∗p = 0.0021 (L), ∗∗p = 0.0088 (M). See also Figure S4 and Table S3.

Comment in

References

    1. Akesson E., Wolmer-Solberg N., Cederarv M., Falci S., Odeberg J. Human neural stem cells and astrocytes, but not neurons, suppress an allogeneic lymphocyte response. Stem Cell Res. (Amst.) 2009;2:56–67. - PubMed
    1. Araki R., Uda M., Hoki Y., Sunayama M., Nakamura M., Ando S., Sugiura M., Ideno H., Shimada A., Nifuji A., Abe M. Negligible immunogenicity of terminally differentiated cells derived from induced pluripotent or embryonic stem cells. Nature. 2013;494:100–104. - PubMed
    1. Chambers S.M., Qi Y., Mica Y., Lee G., Zhang X.J., Niu L., Bilsland J., Cao L., Stevens E., Whiting P. Combined small-molecule inhibition accelerates developmental timing and converts human pluripotent stem cells into nociceptors. Nat. Biotechnol. 2012;30:715–720. - PMC - PubMed
    1. Chastain E.M., Duncan D.S., Rodgers J.M., Miller S.D. The role of antigen presenting cells in multiple sclerosis. Biochim. Biophys. Acta. 2011;1812:265–274. - PMC - PubMed
    1. Debruyne J.C., Versijpt J., Van Laere K.J., De Vos F., Keppens J., Strijckmans K., Achten E., Slegers G., Dierckx R.A., Korf J., De Reuck J.L. PET visualization of microglia in multiple sclerosis patients using [11C]PK11195. Eur. J. Neurol. 2003;10:257–264. - PubMed

Publication types

MeSH terms