. 2014 Apr;171(8):2147-58.
doi: 10.1111/bph.12549.

Mitochondrial function and energy metabolism in neuronal HT22 cells resistant to oxidative stress

Affiliations

Mitochondrial function and energy metabolism in neuronal HT22 cells resistant to oxidative stress

Annika Pfeiffer et al. Br J Pharmacol. 2014 Apr.

Abstract

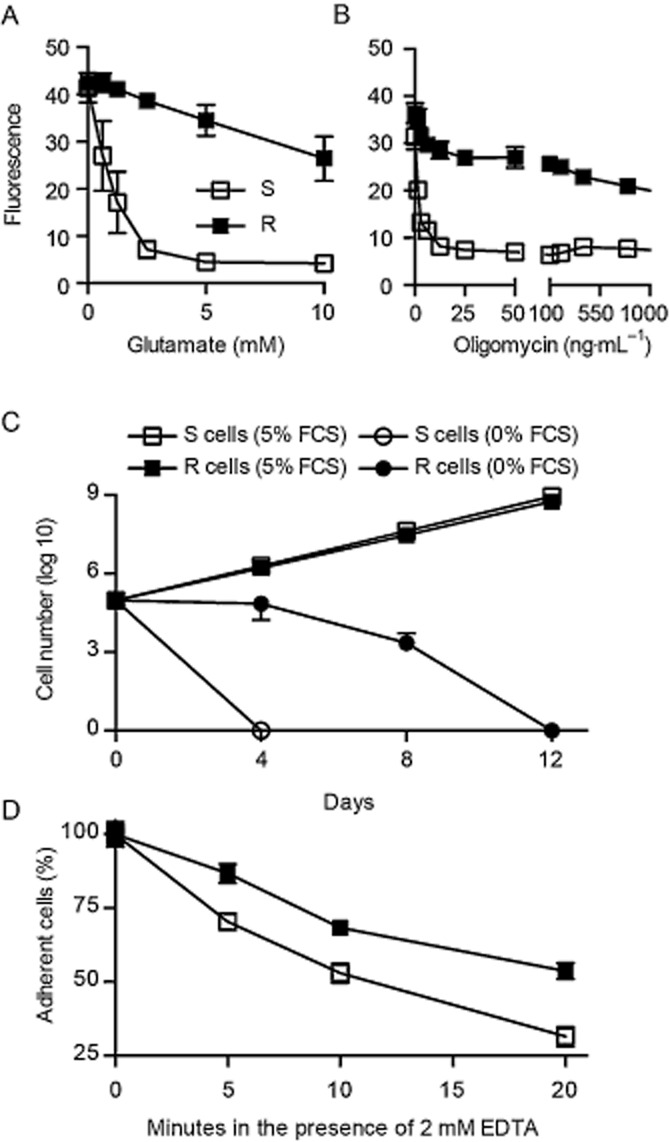
Background and purpose: The hippocampal cell line HT22 is an excellent model for studying the consequences of endogenous oxidative stress. Extracellular glutamate depletes cellular glutathione by blocking the glutamate/cystine antiporter system xc-. Glutathione depletion induces a well-defined programme of cell death characterized by an increase in reactive oxygen species and mitochondrial dysfunction.

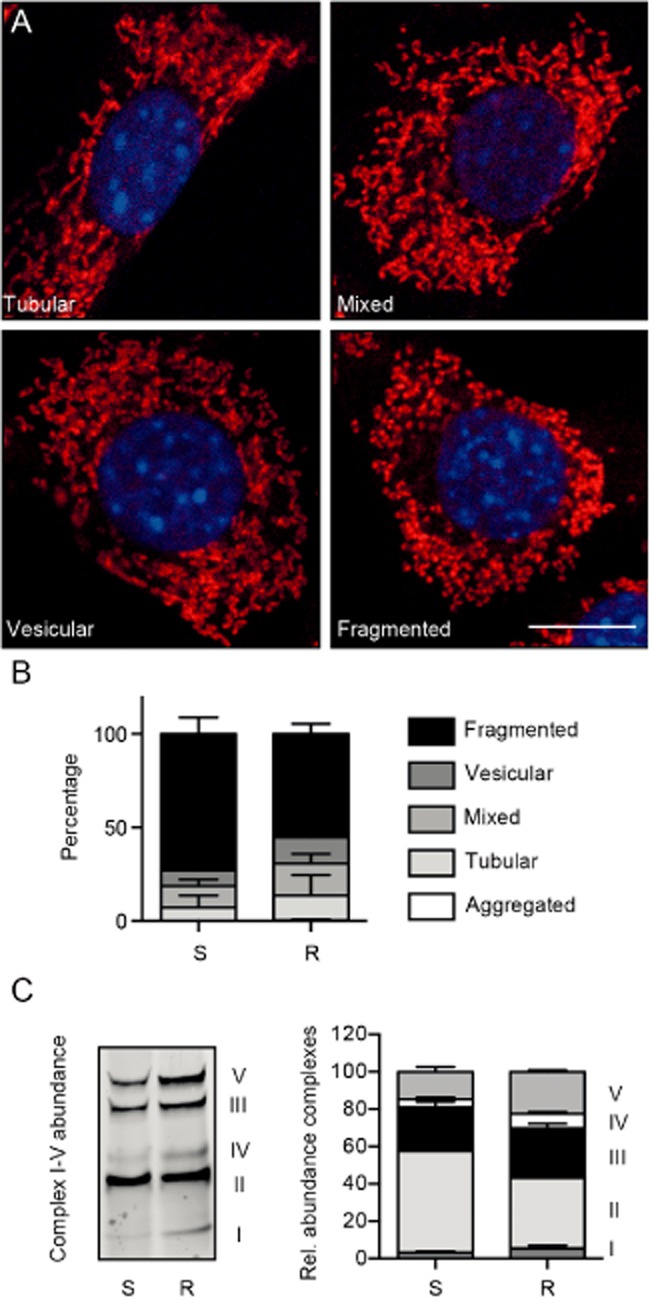
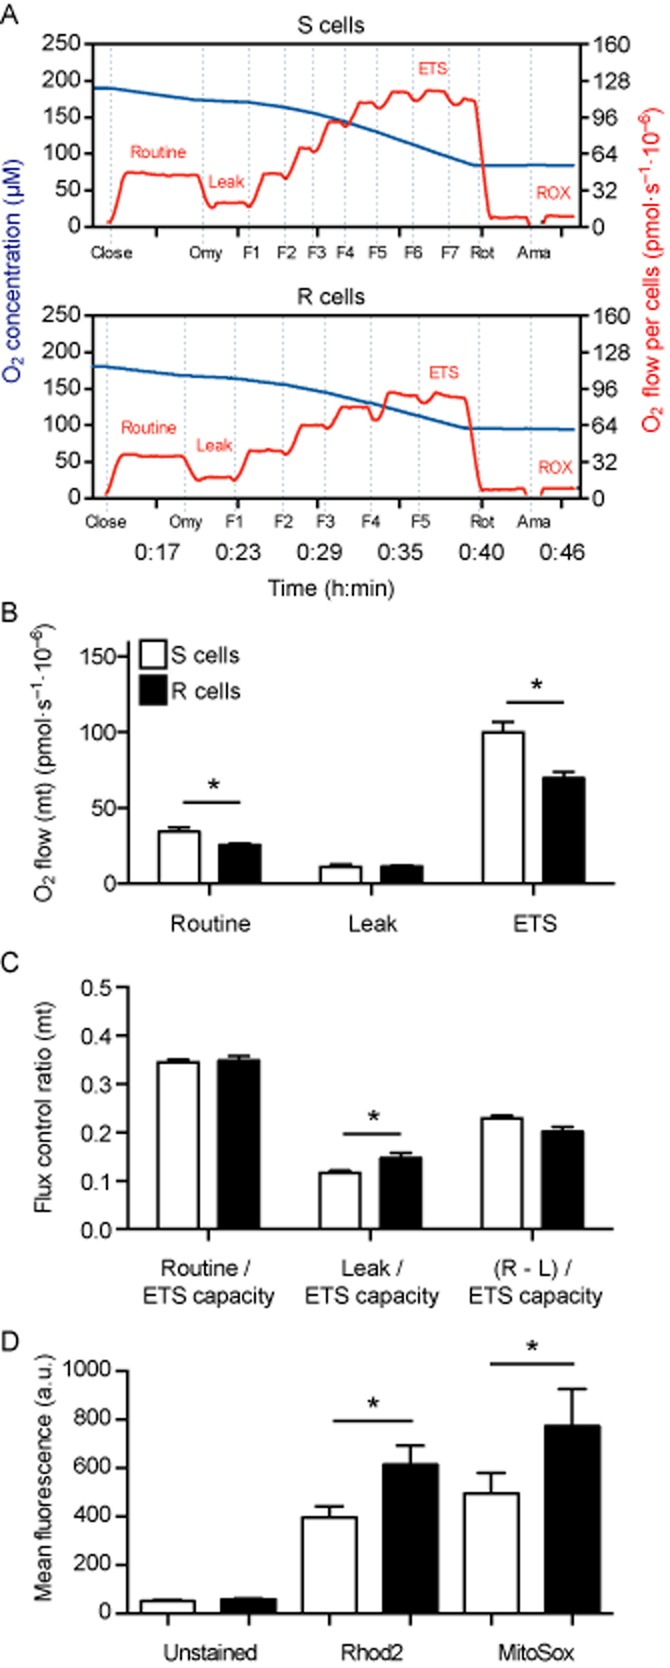
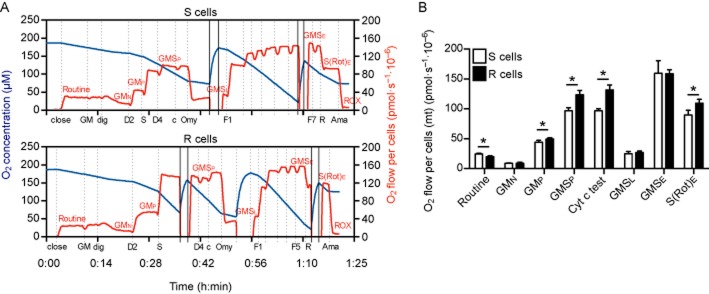
Experimental approach: We compared the mitochondrial shape, the abundance of mitochondrial complexes and the mitochondrial respiration of HT22 cells, selected based on their resistance to glutamate, with those of the glutamate-sensitive parental cell line.

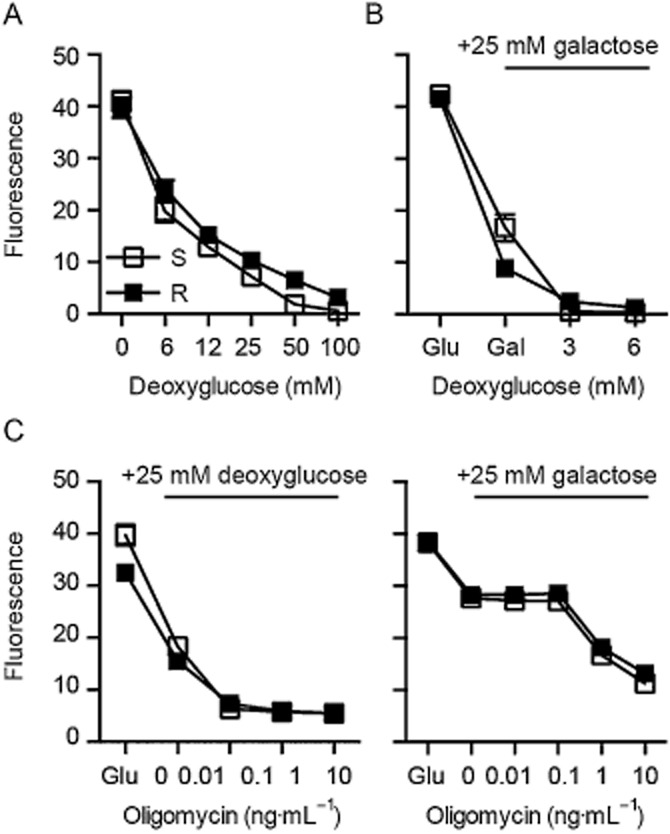
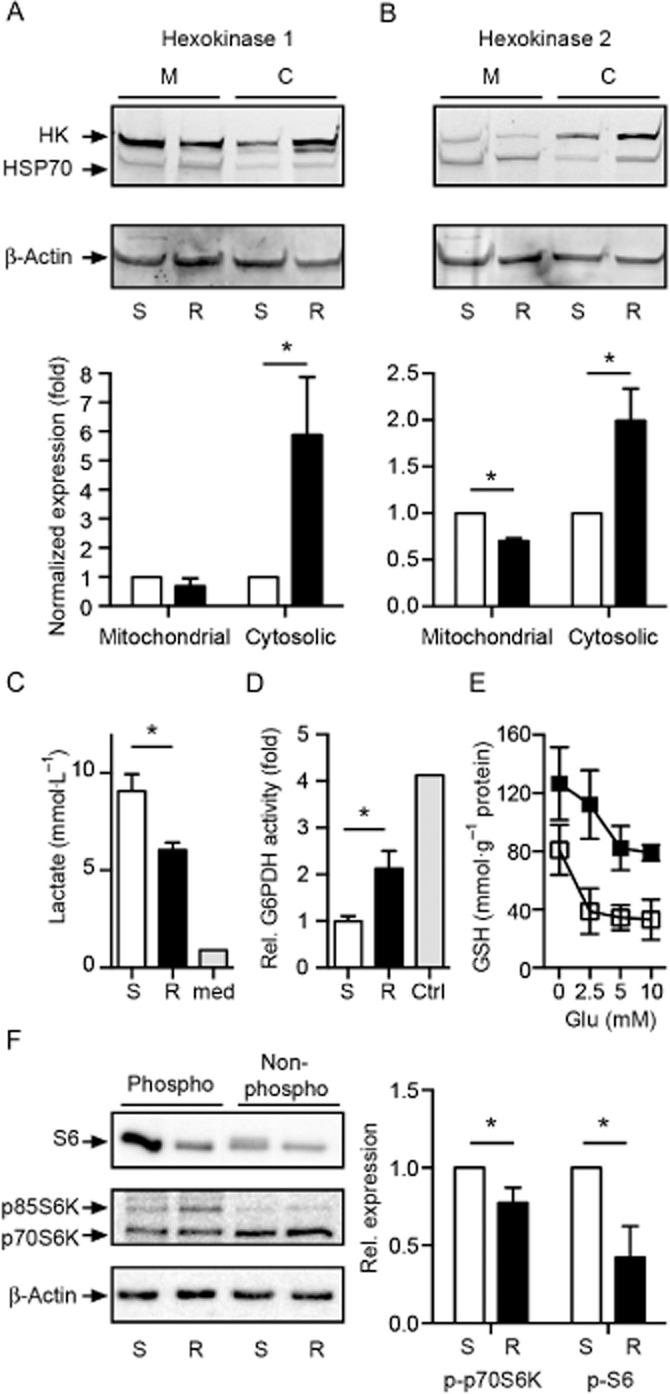
Key results: Glutamate-resistant mitochondria were less fragmented and displayed seemingly contradictory features: mitochondrial calcium and superoxide were increased while high-resolution respirometry suggested a reduction in mitochondrial respiration. This was interpreted as a reverse activity of the ATP synthase under oxidative stress, leading to hydrolysis of ATP to maintain or even elevate the mitochondrial membrane potential, suggesting these cells endure ineffective energy metabolism to protect their membrane potential. Glutamate-resistant cells were also resistant to oligomycin, an inhibitor of the ATP synthase, but sensitive to deoxyglucose, an inhibitor of hexokinases. Exchanging glucose with galactose rendered resistant cells 1000-fold more sensitive to oligomycin. These results, together with a strong increase in cytosolic hexokinase 1 and 2, a reduced lactate production and an increased activity of glucose-6-phosphate dehydrogenase, suggest that glutamate-resistant HT22 cells shuttle most available glucose towards the hexose monophosphate shunt to increase glutathione recovery.

Conclusions and implications: These results indicate that mitochondrial and metabolic adaptations play an important role in the resistance of cells to oxidative stress.

Keywords: cell death; fusion/fission; glycolysis; mitochondria; oxidative phosphorylation; oxidative stress.


Figures

Figure 1
Figure 1
Hippocampal cells resistant to oxidative stress are similarly resistant to inhibition of the mitochondrial ATP synthase. (A, B) 5 x 10³ glutamate-sensitive and glutamate-resistant S and R cells were seeded into 96-well plates and subjected to the indicated concentrations of (A) glutamate or (B) oligomycin 24 h later. Viability was quantified 22 h after addition of glutamate and 24 h after the beginning of the oligomycin treatment with the CellTiter Blue reagent. Fluorescence values (mean ± SD) of five replicates obtained in three independent experiments were plotted against the glutamate and oligomycin concentrations respectively. (C) Growth curves in medium containing the indicated concentrations of FCS were obtained by plating the cells every 4 days at a density of 1 x 10⁴ cells cm-2 into 6-well plates. The number of cells at each step for each well was calculated as the average cell number at the previous step divided by the number of seeded cells multiplied by the current cell number. (D) 5 x 10³ S and R cells were seeded in 96-well plates. Twenty-four hours later, the medium was replaced by 100 μL PBS with 2 mM EDTA at different time points, and the plate was shaken directly after addition of PBS without EDTA to control wells. Six replicates were performed in parallel for every condition. After being shaken, PBS or PBS/EDTA were aspired, and cells were washed with 100 μL medium to remove detached cells. The remaining cells were quantified by a cell death assay.
Figure 2
Figure 2
Altered mitochondrial shape and stoichiometry of mitochondrial respiratory chain complexes in glutamate-resistant cells. (A) The mitochondrial morphology of S and R cells was analysed by fluorescence microscopy. Cells were stained with MitoTracker Red and DAPI, and categorized by their mitochondrial morphology as aggregated (not shown), tubular, mixed, vesicular or fragmented. Cells exhibiting a mixed category had tubular as well as fragmented mitochondria while cells with a vesicular phenotype showed mainly fragmented and only a few tubular mitochondria. Representative pictures of each category are shown. Scale bar represents 10 µM. (B) The quantification of changes in mitochondrial shape revealed a reduced number of R cells in the fragmented mitochondrial category. Data were collected by two blinded observers from three independent experiments and are shown as the mean ± SEM. (C) Immunoblot with mitochondrial fractions from glutamate-sensitive (S) and glutamate-resistant (R) HT22 cells probed with an antibody mix against mitochondrial complex proteins and the quantification of three immunoblots. Data are shown as mean ± SEM.
Figure 3
Figure 3
Reduced mitochondrial respiratory activity in intact glutamate-resistant cells. (A) Representative traces measured by high-resolution respirometry showing oxygen concentration (blue line) and oxygen flow per cells (red line) of intact S and R cells. The addition of oligomycin (Omy), FCCP (F), rotenone (Rot) and antimycin A (Ama) is indicated. Sections reflecting routine respiration, leak respiration induced by inhibition of ATP synthase using oligomycin, ETS capacity at maximum FCCP concentration and oxygen flow, followed by ROX through inhibition of complex I (rotenone) and complex III (antimycin A) are indicated. (B) Oxygen flow per cells corrected for ROX at the indicated mitochondrial respiration state. Basal cellular routine respiration and ETS capacity were reduced in glutamate-resistant R cells while leak respiration was comparable in both cell lines. (C) Calculated mitochondrial (mt) flux control ratios show basal cellular routine respiration (R), leak respiration (L) and fraction of respiration (netR = R-L) used for ATP production normalized to ETS capacity. The leak oxygen flux ratio is enhanced in R cells whereas the basal routine respiration relative to ETS capacity as well as the fraction used for phosphorylating respiration [netR/E as (R-L)/ETS capacity] was comparable in both cell lines. The bar graphs in (B) and (C) show the mean O2 flow per cell ± SEM or flux control ratios ± SEM of three independent experiments performed in duplicate. (D) S and R cells were stained with Rhod2-AM (mitochondrial Ca2+) and MitoSox (mitochondrial superoxide) and analysed by flow cytometry. The bar graphs show the mean fluorescence intensity ± SEM of three independent experiments performed in triplicate. Statistical significance was calculated in all experiments using Student's two-tailed t-test and P < 0.05 is indicated by an asterisk.
Figure 4
Figure 4
Increased oxidative phosphorylation capacity in permeabilized glutamate-resistant cells. Representative traces measured by high-resolution respirometry showing oxygen concentration (blue line) and oxygen flow per cells (red line) of digitonin-permeabilized S and R cells. The addition of glutamate (G), malate (M), digitonin (dig), ADP (D), succinate (S), cytochrome c (c), oligomycin (Omy), FCCP (F), rotenone (R) and antimycin A (Ama) is indicated with dotted lines while re-oxygenation and closing of the chambers are marked with continuous lines. Sections reflecting certain respiratory states are labelled. After measurement of routine endogenous cell respiration and addition of glutamate, malate and permeabilization by digitonin, the leak state GMN with no adenylates added (N) was recorded. Mitochondrial respiration was stimulated by ADP (D2), which led to the OXPHOS capacity state (P) GMP, while the addition of succinate and ADP (D4) to a final concentration of 4 mM allowed the recording of the OXPHOS capacity state GMSP with convergent input of electrons via complexes I and II into the respiratory system. The intactness of the mitochondrial membrane was tested by the application of cytochrome c (Cyt c test). The leak state GMSL was induced by oligomycin-dependent inhibition of the ATP synthase. The ETS capacity state (E) at maximum oxygen flow per cells, reflecting ETS state GMSE, was determined through titration of FCCP. Inhibition of complex I by rotenone allowed the measurement of the ETS state S(Rot)E, which is dependent only on electron input via complex II. ROX was measured by the antimycin A-induced inhibition of complex III. (B) Oxygen flow per cells corrected for ROX at the indicated mitochondrial respiration state. Endogenous routine respiration was reduced in glutamate-resistant R cells, while the OXPHOS capacity GMP and GMSP were increased as well as the complex II-dependent ETS capacity S(Rot)E in the glutamate-resistant R cells in comparison to S cells. The bar graphs show the mean O2 flow per cells ± SD of four independent experiments performed in duplicate. Statistical significance was calculated using Student's two-tailed t-test and P < 0.05 is indicated by an asterisk.
Figure 5
Figure 5
Glutamate-resistant cells are susceptible to inhibition of glycolysis. Glutamate-sensitive and glutamate-resistant S and R cells (5 x 10³) were seeded into 96-well plates and subjected to the indicated concentrations of (A, B) deoxyglucose or (C) oligomycin in the presence of the indicated sugars. Viability was quantified in (A) and (B) after 72 h and in (C) after 24 h with CellTiter Blue reagent. Mean ± SD fluorescence values of quintuplicate results obtained in three independent experiments were plotted against various concentrations of the indicated compounds.
Figure 6
Figure 6
Increased expression of cytosolic hexokinase 1 and 2 and activity of glucose-6-phosphate dehydrogenase in glutamate-resistant R cells. Immunoblot with mitochondrial and cytosolic fractions of glutamate-sensitive (S) and glutamate-resistant (R) HT22 cells. The blot was probed with antibodies against (A) hexokinases HK-1 and (B) HK-2, β-actin and the mitochondrial marker HSP70. To quantify the results, HK-1 and HK-2 expression was normalized to HSP70 and β-actin expression before the ratio between mitochondria-bound and cytosolic hexokinases was determined. (C) One day after seeding, the growth medium was changed and analysed enzymatically 24 h later for its lactate content. Data obtained from two independent experiments in duplicate are shown as mean ± SD and were analysed using two-tailed t-tests. The lactate concentration in fresh growth medium was 0.9 mmol·L−1. (D) The activity of G6PDH was quantified enzymatically in S and R cells and in S cells transfected with either empty vector or EGFP-G6PDH as control. The values of three independent experiments were normalized to the values obtained from S (and vector-transfected cells – which were identical) and are shown as mean ± SEM. (E) Total cellular GSH content was enzymatically quantified in cells treated with the indicated amount of glutamate for 8 h. Data are shown as mean ± SEM and were collected from three independent experiments in duplicate. (F) Immunoblot analysis of S and R cell lysates using anti-phospho-S6 (p-S6) or anti-phospho S6 kinase (p-p70S6K, p-p85S6K) antibodies. Band intensities were normalized to total S6 or total S6 kinase and compared with actin. Representative immunoblots and quantifications of four (p-S6) or five (p-S6K) independent experiments are shown. Statistical significance was calculated using Student's t-test, *P < 0.05.

Similar articles

Cited by

References

    1. Albrecht P, Lewerenz J, Dittmer S, Noack R, Maher P, Methner A. Mechanisms of oxidative glutamate toxicity: the glutamate/cystine antiporter system xc− as a neuroprotective drug target. CNS Neurol Disord Drug Targets. 2010;9:373–382. - PubMed
    1. Albrecht P, Bouchachia I, Goebels N, Henke N, Hofstetter HH, Issberner A, et al. Effects of dimethyl fumarate on neuroprotection and immunomodulation. J Neuroinflammation. 2012;9:163. - PMC - PubMed
    1. Alexander SPH, Benson HE, Faccenda E, Pawson AJ, Sharman JL, Spedding M, et al. The concise guide to pharmacology 2013/2014. Transporters. Br J Pharmacol. 2013a;170:1706–1796. - PMC - PubMed
    1. Alexander SPH, Benson HE, Faccenda E, Pawson AJ, Sharman JL, Spedding M, et al. The concise guide to pharmacology 2013/2014. Enzymes. Br J Pharmacol. 2013b;170:1797–1867. - PMC - PubMed
    1. Ben-Yoseph O, Boxer PA, Ross BD. Assessment of the role of the glutathione and pentose phosphate pathways in the protection of primary cerebrocortical cultures from oxidative stress. J Neurochem. 1996;66:2329–2337. - PubMed

Publication types

MeSH terms

LinkOut - more resources