. 2013 Nov;40(11):111722.
doi: 10.1118/1.4826166.

Evaluating IMRT and VMAT dose accuracy: practical examples of failure to detect systematic errors when applying a commonly used metric and action levels

Affiliations

Evaluating IMRT and VMAT dose accuracy: practical examples of failure to detect systematic errors when applying a commonly used metric and action levels

Benjamin E Nelms et al. Med Phys. 2013 Nov.

Abstract

Purpose: This study (1) examines a variety of real-world cases where systematic errors were not detected by widely accepted methods for IMRT/VMAT dosimetric accuracy evaluation, and (2) drills-down to identify failure modes and their corresponding means for detection, diagnosis, and mitigation. The primary goal of detailing these case studies is to explore different, more sensitive methods and metrics that could be used more effectively for evaluating accuracy of dose algorithms, delivery systems, and QA devices.

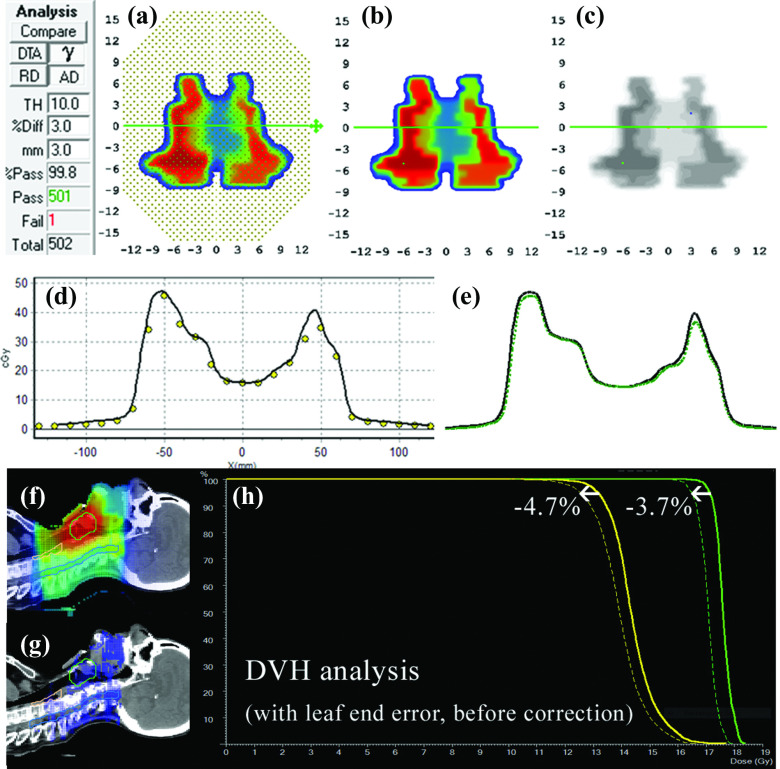
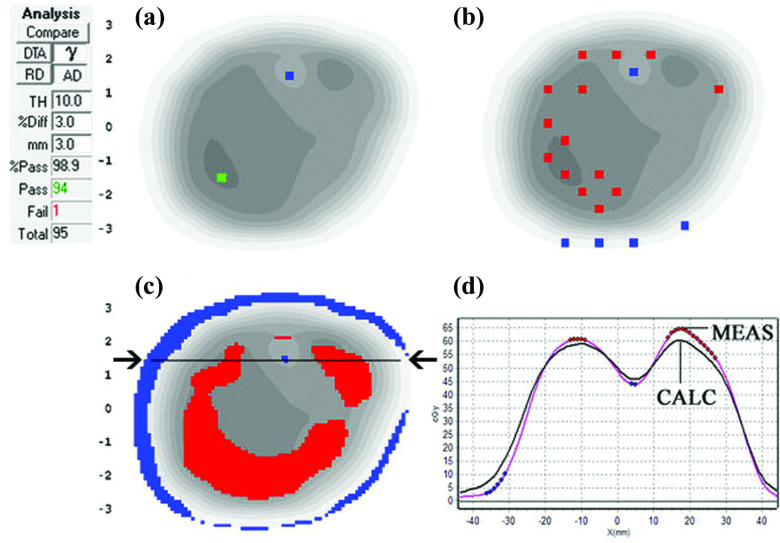
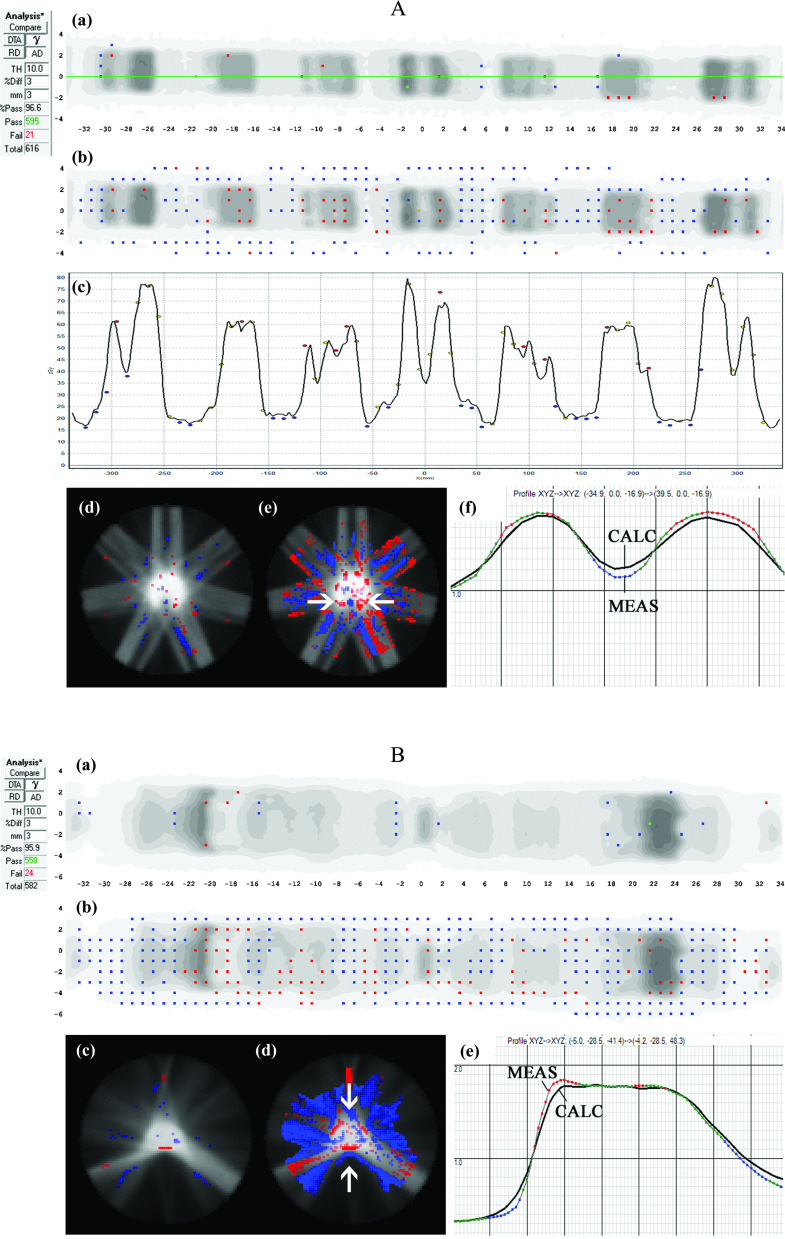
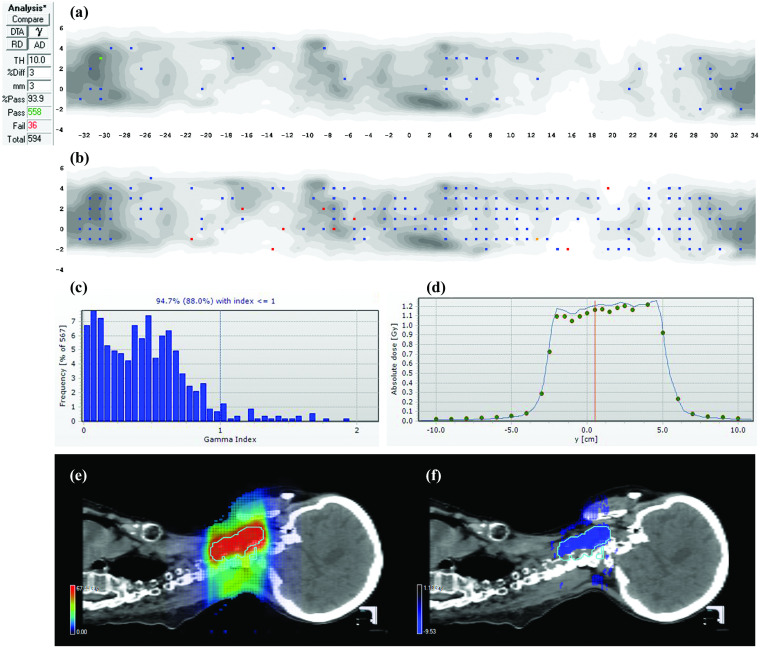
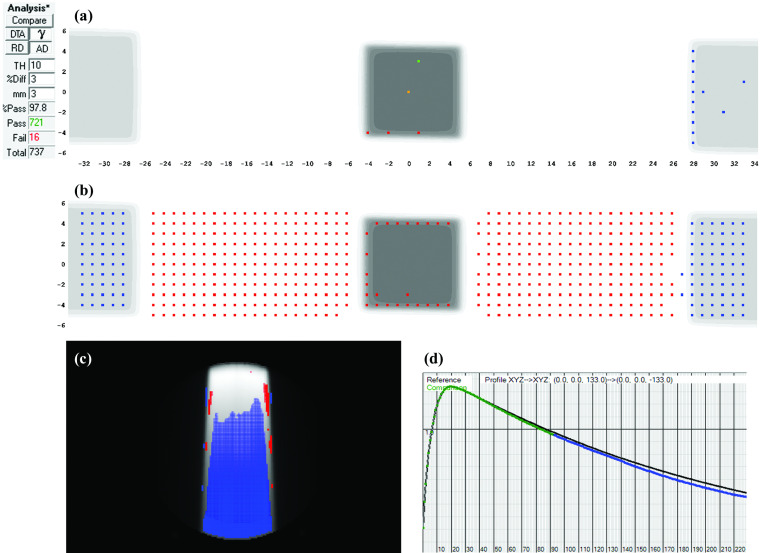
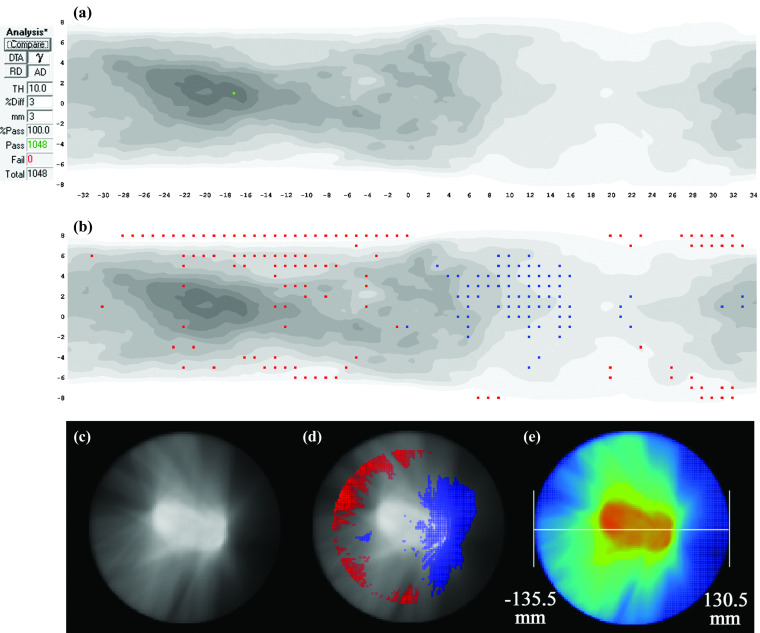
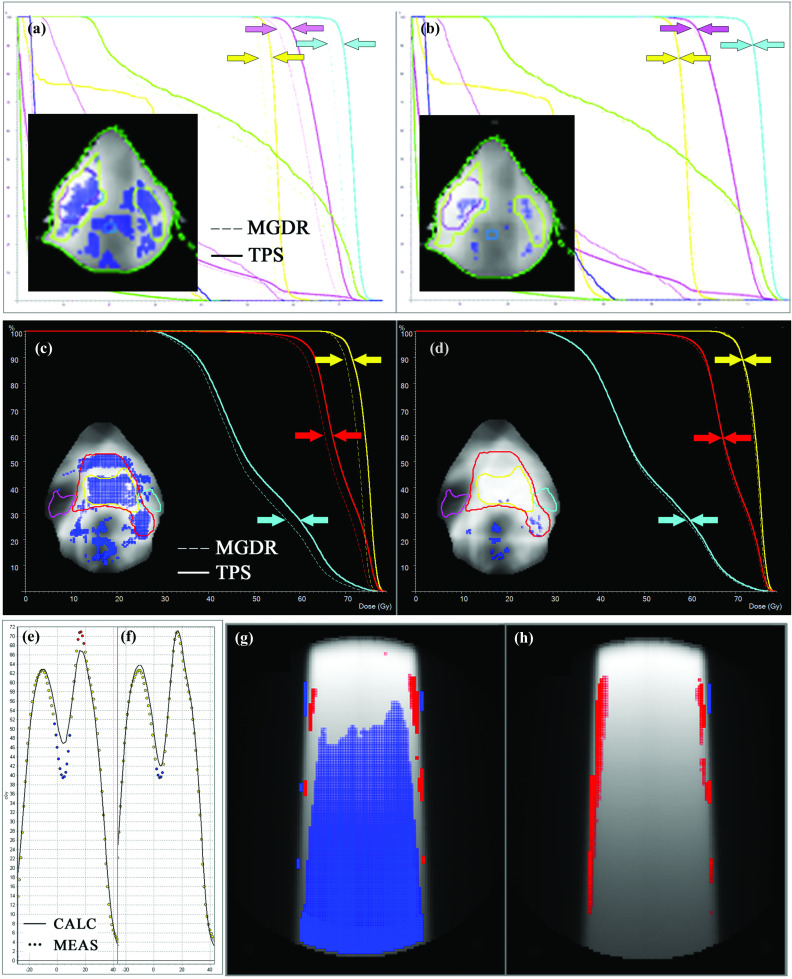
Methods: The authors present seven real-world case studies representing a variety of combinations of the treatment planning system (TPS), linac, delivery modality, and systematic error type. These case studies are typical to what might be used as part of an IMRT or VMAT commissioning test suite, varying in complexity. Each case study is analyzed according to TG-119 instructions for gamma passing rates and action levels for per-beam and/or composite plan dosimetric QA. Then, each case study is analyzed in-depth with advanced diagnostic methods (dose profile examination, EPID-based measurements, dose difference pattern analysis, 3D measurement-guided dose reconstruction, and dose grid inspection) and more sensitive metrics (2% local normalization/2 mm DTA and estimated DVH comparisons).

Results: For these case studies, the conventional 3%/3 mm gamma passing rates exceeded 99% for IMRT per-beam analyses and ranged from 93.9% to 100% for composite plan dose analysis, well above the TG-119 action levels of 90% and 88%, respectively. However, all cases had systematic errors that were detected only by using advanced diagnostic techniques and more sensitive metrics. The systematic errors caused variable but noteworthy impact, including estimated target dose coverage loss of up to 5.5% and local dose deviations up to 31.5%. Types of errors included TPS model settings, algorithm limitations, and modeling and alignment of QA phantoms in the TPS. Most of the errors were correctable after detection and diagnosis, and the uncorrectable errors provided useful information about system limitations, which is another key element of system commissioning.

Conclusions: Many forms of relevant systematic errors can go undetected when the currently prevalent metrics for IMRT∕VMAT commissioning are used. If alternative methods and metrics are used instead of (or in addition to) the conventional metrics, these errors are more likely to be detected, and only once they are detected can they be properly diagnosed and rooted out of the system. Removing systematic errors should be a goal not only of commissioning by the end users but also product validation by the manufacturers. For any systematic errors that cannot be removed, detecting and quantifying them is important as it will help the physicist understand the limits of the system and work with the manufacturer on improvements. In summary, IMRT and VMAT commissioning, along with product validation, would benefit from the retirement of the 3%/3 mm passing rates as a primary metric of performance, and the adoption instead of tighter tolerances, more diligent diagnostics, and more thorough analysis.


Figures

FIG. 1.
FIG. 1.
Absolute dose planes at 10 cm depth, 100 cm source-detector-distance (SDD) shown for (a) measured and (b) calculated dose. (c) 3%G/3 mm gamma failing points. (d) Dose profiles, dots represent calibrated diode measurements and solid lines the interpolated TPS profiles and (e) with measured profile (dotted) up-sampled using a commercial method (Refs. 12 and 13, and 34). (f) Patient sagittal planar dose from TPS and (g) with 3DVH-esimated error showing lower estimated patient dose as dose difference, and (h) as shifts in DVH curves for two target volumes.
FIG. 2.
FIG. 2.
Absolute dose planes at 5 cm depth, 100 cm SDD for (a) measured and (b) calculated dose. (c) 3%G/3 mm gamma with failing points shown as the shaded region over the calculated plane in grayscale. (d) 2%L/2 mm gamma failing points showing a clear pattern of meas < calc, i.e., shaded regions showing gamma failing points. (e) Patient coronal TPS plane, (f) 3DVH-estimated dose differences (3DVH–TPS), and (g) estimated DVH errors showing lower MGDR target dose compared to planned.
FIG. 3.
FIG. 3.
(a) 3%G/3 mm gamma failing points and (b) 2%L/2 mm gamma failing points based on a diode array at 5 cm depth, 100 cm SDD. In both (a) and (b), the visible dots represent failing points. (c) 2%L/2 mm gamma failing points for EPIDose analysis at same virtual depth and (d) dose profile through the horizontal line indicated by the arrows in panel (c), with the black line extracted from the TPS dose grid and the line with dots highlighted from the measurement.
FIG. 4.
FIG. 4.
Case Study A (top): Seven-beam IMRT plan. (a) 3%G/3 mm gamma failing points over the ArcCHECK detector surface and (b) the same data highlighting points failing 2%L/2 mm gamma analysis. In panels (a) and (b), the visible dots represent failing points. (c) Dose profile over the central (Y = 0 mm) quasi-circular circumference of detectors (location of profile shown by the horizontal line in panel (a) showing meas > calc in peaks and meas < calc in valleys of dose, with the black line a profile interpolated through the TPS dose grid and the dots representing dose measured by the point detectors. (d) 3D MGDR reconstructed dose vs TPS dose for central axial plane, showing points failing 3%G/3 mm gamma analysis, and (e) the same data analyzed with 2%L/2 mm which introduces sensitivity enough to highlight the dose gradient differences. In panels (d) and (e), shaded regions indicate MGDR > calc or MGDR < calc. (f) Dose profile through the horizontal line indicated with arrows in panel (a), also showing the dose gradient differences, with the solid line representing the TPS dose and dotted line the reconstructed measurement. (b) Case Study B: The same TPS model as Case Study A of Fig. 4 analyzed for a single arc VMAT plan. (a) 3%G/3 mm gamma failing points over the ArcCHECK detector surface and (b) the same data highlighting points failing 2%L/2 mm gamma analysis. In panels (a) and (b), the visible dots represent failing points. (c) 3D MGDR reconstructed dose vs TPS dose for central axial plane, showing points failing 3%G/3 mm gamma analysis and (d) the same data analyzed with 2%L/2 mm which introduces sensitivity high enough to highlight the dose gradient differences. (e) Dose profile through the horizontal line indicated with arrows in panel (a), also showing the dose gradient differences, with the black line the TPS dose and dotted line the reconstructed measurement.
FIG. 5.
FIG. 5.
Two-arc VMAT plan. (a) 3%G/3 mm gamma failing points on the ArcCHECK detector surface and (b) the same data highlighting points failing 2%L/2 mm gamma analysis. (c) Gamma histogram generated for the same plan using a different 3D dosimeter (Delta4) showing the 94.7% passing rate and (d) absolute dose profiles in the Delta4 illustrating meas < calc over the entire high dose region. (e) TPS dose distribution and (F) 3D MGDR reconstructed dose vs TPS dose for a sagittal plane through the high dose region, showing the clear bias of meas < calc as the shaded region.
FIG. 6.
FIG. 6.
An open 10 × 10 cm2 beam incident on a homogeneous PMMA cylindrical phantom. (a) 3%G/3 mm gamma failing points over the ArcCHECK detector surface and (b) the same data highlighting points failing 2%L/2 mm gamma analysis, where now the meas < calc bias at the beam exit surface becomes visually evident. (c) 3D MGDR reconstructed dose vs TPS dose for central axial plane, showing points failing 2%L/2 mm gamma analysis confirming the meas < calc trend that increases with depth, and (d) the central axis depth dose profiles of TPS (black line) vs MGDR (two-tone shaded line that is below the TPS depth dose line).
FIG. 7.
FIG. 7.
Two-arc VMAT plan delivered on a uniform cylindrical phantom. (a) 3%G/3 mm gamma failing points over the ArcCHECK detector surface and (b) the same data highlighting points failing 2%L/2 mm gamma analysis, where now a trend is visualized where meas > calc on the left side of the phantom and meas < calc on the right side, as indicated by shaded regions. (c) 3D MGDR reconstructed dose vs TPS dose for central axial plane, showing points failing 3%G/3 mm gamma analysis showing 100% passing rate, then (d) reanalyzed using 2%L/2 mm confirming the clear error pattern. (e) Analysis of the virtual phantom geometry in the TPS confirms that the beam isocenter was not centered in the phantom model but rather was shifted about 2.75 mm laterally.
FIG. 8.
FIG. 8.
[(a) and (b)]: Before (a) and after (b) detection and removal of leaf-end error described by Case Study 1, exhibited for a different head and neck case to illustrate the systematic improvement in dose difference and DVH impact. Arrows have been added to three PTV curves to highlight convergence. [(c) and (d)]: Before (c) and after (d) application of the correct T and G effect by the TPS as described by Case Study 2. Arrows for two PTV curves and the ipsilateral parotid have been added to highlight convergence. [(e) and (f)]: Before (e) and after (f) improving the beam model by rescanning profiles with a small diode detector to eliminate the volume averaging effects of the original scans made with ion chamber. [(g) and (h)]: Phantom dose comparison (TPS vs measured) before (g) and after (h) correction of the QA phantom density configuration in the TPS.

References

    1. Shewhart W. A., Statistical Method from the Viewpoint of Quality Control (Department of Agriculture, Washington D. C., 1939).
    1. Deming W. E., Out of the Crisis (MIT Press, Cambridge, MA, 1986).
    1. Aguayo R., Dr. Deming: The American Who Taught the Japanese About Quality (Simon and Schuster, NY, 1991).
    1. Taguchi G., Chowdhury S., and Wu Y., Taguchi's Quality Engineering Handbook (Wiley, Hoboken, NJ, 2005).
    1. Ezzell G. A.et al., “IMRT commissioning: Multiple institution planning and dosimetry comparisons, a report from AAPM Task Group 119,” Med. Phys. 36(11), 5359–5373 (2009).10.1118/1.3238104 - DOI - PubMed

Publication types