

Monte Carlo and analytical model predictions of leakage neutron exposures from passively scattered proton therapy
- PMID: 24320500
- PMCID: PMC3843753
- DOI: 10.1118/1.4829512
Monte Carlo and analytical model predictions of leakage neutron exposures from passively scattered proton therapy
Abstract
Purpose: Stray neutron radiation is of concern after radiation therapy, especially in children, because of the high risk it might carry for secondary cancers. Several previous studies predicted the stray neutron exposure from proton therapy, mostly using Monte Carlo simulations. Promising attempts to develop analytical models have also been reported, but these were limited to only a few proton beam energies. The purpose of this study was to develop an analytical model to predict leakage neutron equivalent dose from passively scattered proton beams in the 100-250-MeV interval.
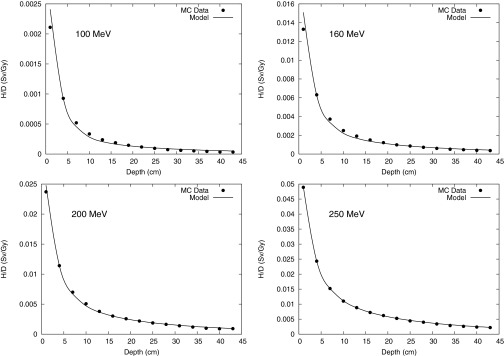
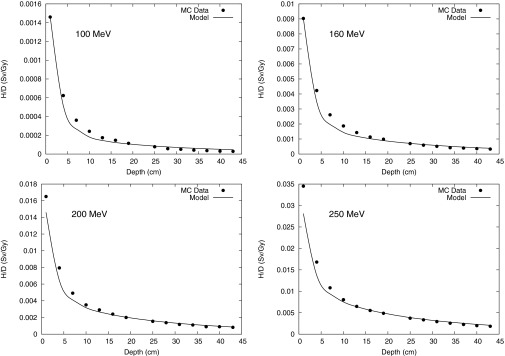
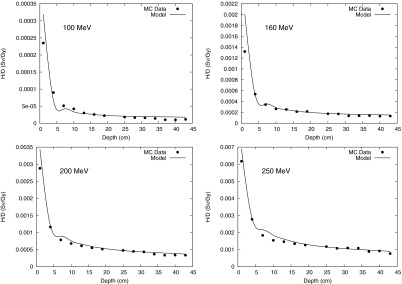
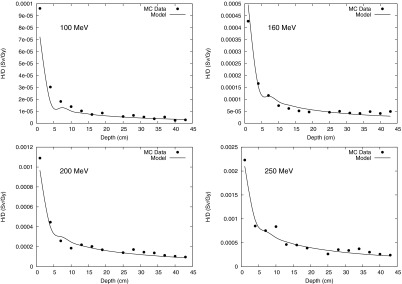
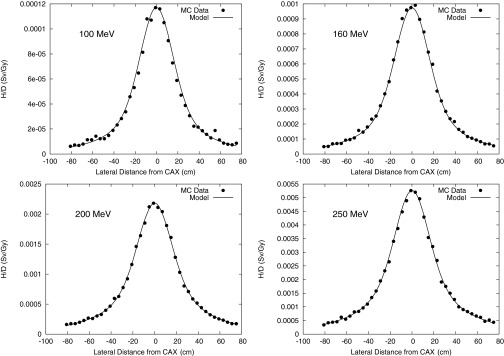
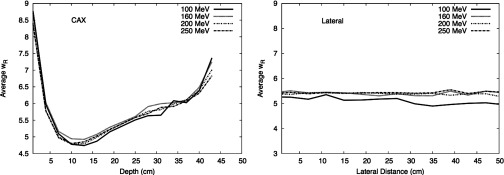
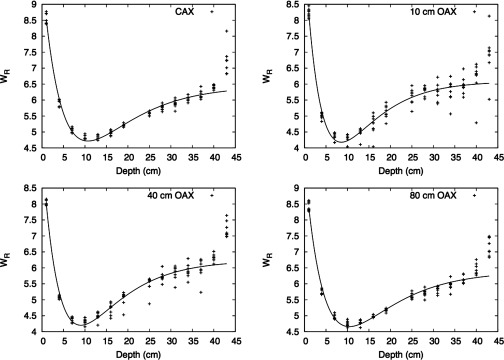
Methods: To develop and validate the analytical model, the authors used values of equivalent dose per therapeutic absorbed dose (H∕D) predicted with Monte Carlo simulations. The authors also characterized the behavior of the mean neutron radiation-weighting factor, wR, as a function of depth in a water phantom and distance from the beam central axis.
Results: The simulated and analytical predictions agreed well. On average, the percentage difference between the analytical model and the Monte Carlo simulations was 10% for the energies and positions studied. The authors found that wR was highest at the shallowest depth and decreased with depth until around 10 cm, where it started to increase slowly with depth. This was consistent among all energies.
Conclusion: Simple analytical methods are promising alternatives to complex and slow Monte Carlo simulations to predict H∕D values. The authors' results also provide improved understanding of the behavior of wR which strongly depends on depth, but is nearly independent of lateral distance from the beam central axis.
Figures
Similar articles
-
An analytic model of neutron ambient dose equivalent and equivalent dose for proton radiotherapy.Phys Med Biol. 2010 Dec 7;55(23):6975-85. doi: 10.1088/0031-9155/55/23/S01. Epub 2010 Nov 12. Phys Med Biol. 2010. PMID: 21076197 Free PMC article.
-
Stray neutron radiation exposures from proton therapy: physics-based analytical models of neutron spectral fluence, kerma and absorbed dose.Phys Med Biol. 2022 Jun 15;67(12). doi: 10.1088/1361-6560/ac7377. Phys Med Biol. 2022. PMID: 35613603
-
Monte Carlo simulations of neutron spectral fluence, radiation weighting factor and ambient dose equivalent for a passively scattered proton therapy unit.Phys Med Biol. 2008 Jan 7;53(1):187-201. doi: 10.1088/0031-9155/53/1/013. Epub 2007 Dec 19. Phys Med Biol. 2008. PMID: 18182696
-
Neutron dose and its measurement in proton therapy-current State of Knowledge.Br J Radiol. 2020 Mar;93(1107):20190412. doi: 10.1259/bjr.20190412. Epub 2020 Jan 21. Br J Radiol. 2020. PMID: 31868525 Free PMC article. Review.
-
Prompt-gamma fall-off estimation with C-ion irradiation at clinical energies, using a knife-edge slit camera: A Monte Carlo study.Phys Med. 2023 Mar;107:102554. doi: 10.1016/j.ejmp.2023.102554. Epub 2023 Mar 10. Phys Med. 2023. PMID: 36907030 Review.
Cited by
-
Visualization of risk of radiogenic second cancer in the organs and tissues of the human body.Radiat Oncol. 2015 Apr 28;10:107. doi: 10.1186/s13014-015-0404-x. Radiat Oncol. 2015. PMID: 25927490 Free PMC article.
-
Independent application of an analytical model for secondary neutron equivalent dose produced in a passive-scattering proton therapy treatment unit.Phys Med Biol. 2018 Aug 6;63(15):15NT04. doi: 10.1088/1361-6560/aad1bc. Phys Med Biol. 2018. PMID: 29978833 Free PMC article.
-
Implementation of an analytical model for leakage neutron equivalent dose in a proton radiotherapy planning system.Cancers (Basel). 2015 Mar 11;7(1):427-38. doi: 10.3390/cancers7010427. Cancers (Basel). 2015. PMID: 25768061 Free PMC article.
-
An analytical model of leakage neutron equivalent dose for passively-scattered proton radiotherapy and validation with measurements.Cancers (Basel). 2015 May 18;7(2):795-810. doi: 10.3390/cancers7020795. Cancers (Basel). 2015. PMID: 25993009 Free PMC article.
-
The physics of proton therapy.Phys Med Biol. 2015 Apr 21;60(8):R155-209. doi: 10.1088/0031-9155/60/8/R155. Epub 2015 Mar 24. Phys Med Biol. 2015. PMID: 25803097 Free PMC article. Review.
References
-
- Inskip P. D., Ries L. A. G., Cohen R. J., and Curtis R. E., “Chapter 18: New maligancies following childhood cancer,” New Malignancies Among Cancer Survivors: SEER Cancer Registries, 1973–2000 (National Cancer Institute, Bethesda, MD, 2006).
-
- Fraumeni J. F., Curtis R. E., Edwards A. C., and Tucker M. A., “Chapter 1: Introduction,” New Malignancies Among Cancer Survivors: SEER Cancer Registries, 1973–2000 (National Cancer Institute, Bethesda, MD, 2006).
-
- The International Commission on Radiation Units and Measurements, “Prescribing, recording, and reporting proton-beam therapy,” ICRU Report No. 78 (ICRU Publications, Bethesda, MD, 2007).
-
- Newhauser W. D., Fontenot J. D., Mahajan A., Kornguth D., Stovall M., Zheng Y., Taddei P. J., Mirkovic D., Mohan R., Cox J. D., and Woo S., “The risk of developing a second cancer after receiving craniospinal proton irradiation,” Phys. Med. Biol. 54, 2277–2291 (2009).10.1088/0031-9155/54/8/002 - DOI - PMC - PubMed
-
- Hecksel D., Sandison G. A., Farr J. B., and Edwards A. C., “Scattered neutron dose equivalent from an active scanning proton beam delivery system,” Australas. Phys. Eng. Sci. Med. 30, 326–330 (2007). - PubMed
Publication types
MeSH terms
Grants and funding
LinkOut - more resources
Full Text Sources
Other Literature Sources
