Automated fibroglandular tissue segmentation and volumetric density estimation in breast MRI using an atlas-aided fuzzy C-means method
- PMID: 24320533
- PMCID: PMC3852242
- DOI: 10.1118/1.4829496
Automated fibroglandular tissue segmentation and volumetric density estimation in breast MRI using an atlas-aided fuzzy C-means method
Abstract
Purpose: Breast magnetic resonance imaging (MRI) plays an important role in the clinical management of breast cancer. Studies suggest that the relative amount of fibroglandular (i.e., dense) tissue in the breast as quantified in MR images can be predictive of the risk for developing breast cancer, especially for high-risk women. Automated segmentation of the fibroglandular tissue and volumetric density estimation in breast MRI could therefore be useful for breast cancer risk assessment.
Methods: In this work the authors develop and validate a fully automated segmentation algorithm, namely, an atlas-aided fuzzy C-means (FCM-Atlas) method, to estimate the volumetric amount of fibroglandular tissue in breast MRI. The FCM-Atlas is a 2D segmentation method working on a slice-by-slice basis. FCM clustering is first applied to the intensity space of each 2D MR slice to produce an initial voxelwise likelihood map of fibroglandular tissue. Then a prior learned fibroglandular tissue likelihood atlas is incorporated to refine the initial FCM likelihood map to achieve enhanced segmentation, from which the absolute volume of the fibroglandular tissue (|FGT|) and the relative amount (i.e., percentage) of the |FGT| relative to the whole breast volume (FGT%) are computed. The authors' method is evaluated by a representative dataset of 60 3D bilateral breast MRI scans (120 breasts) that span the full breast density range of the American College of Radiology Breast Imaging Reporting and Data System. The automated segmentation is compared to manual segmentation obtained by two experienced breast imaging radiologists. Segmentation performance is assessed by linear regression, Pearson's correlation coefficients, Student's paired t-test, and Dice's similarity coefficients (DSC).
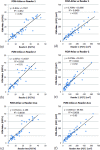
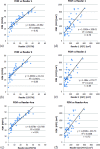
Results: The inter-reader correlation is 0.97 for FGT% and 0.95 for |FGT|. When compared to the average of the two readers' manual segmentation, the proposed FCM-Atlas method achieves a correlation of r = 0.92 for FGT% and r = 0.93 for |FGT|, and the automated segmentation is not statistically significantly different (p = 0.46 for FGT% and p = 0.55 for |FGT|). The bilateral correlation between left breasts and right breasts for the FGT% is 0.94, 0.92, and 0.95 for reader 1, reader 2, and the FCM-Atlas, respectively; likewise, for the |FGT|, it is 0.92, 0.92, and 0.93, respectively. For the spatial segmentation agreement, the automated algorithm achieves a DSC of 0.69 ± 0.1 when compared to reader 1 and 0.61 ± 0.1 for reader 2, respectively, while the DSC between the two readers' manual segmentation is 0.67 ± 0.15. Additional robustness analysis shows that the segmentation performance of the authors' method is stable both with respect to selecting different cases and to varying the number of cases needed to construct the prior probability atlas. The authors' results also show that the proposed FCM-Atlas method outperforms the commonly used two-cluster FCM-alone method. The authors' method runs at ∼5 min for each 3D bilateral MR scan (56 slices) for computing the FGT% and |FGT|, compared to ∼55 min needed for manual segmentation for the same purpose.
Conclusions: The authors' method achieves robust segmentation and can serve as an efficient tool for processing large clinical datasets for quantifying the fibroglandular tissue content in breast MRI. It holds a great potential to support clinical applications in the future including breast cancer risk assessment.
Figures


Similar articles
-
Using deep learning to segment breast and fibroglandular tissue in MRI volumes.Med Phys. 2017 Feb;44(2):533-546. doi: 10.1002/mp.12079. Med Phys. 2017. PMID: 28035663
-
Automated chest wall line detection for whole-breast segmentation in sagittal breast MR images.Med Phys. 2013 Apr;40(4):042301. doi: 10.1118/1.4793255. Med Phys. 2013. PMID: 23556914 Free PMC article.
-
Chan-Vese aided fuzzy C-means approach for whole breast and fibroglandular tissue segmentation: Preliminary application to real-world breast MRI.Med Phys. 2025 May;52(5):2950-2960. doi: 10.1002/mp.17660. Epub 2025 Feb 5. Med Phys. 2025. PMID: 39910814 Free PMC article.
-
Multi-atlas image registration of clinical data with automated quality assessment using ventricle segmentation.Med Image Anal. 2020 Jul;63:101698. doi: 10.1016/j.media.2020.101698. Epub 2020 Apr 18. Med Image Anal. 2020. PMID: 32339896 Free PMC article. Review.
-
Recent Advancements in Fuzzy C-means Based Techniques for Brain MRI Segmentation.Curr Med Imaging. 2021;17(8):917-930. doi: 10.2174/1573405616666210104111218. Curr Med Imaging. 2021. PMID: 33397241 Review.
Cited by
-
MRI Background Parenchymal Enhancement Is Not Associated with Breast Cancer.PLoS One. 2016 Jul 5;11(7):e0158573. doi: 10.1371/journal.pone.0158573. eCollection 2016. PLoS One. 2016. PMID: 27379395 Free PMC article.
-
Quantitative 3D breast magnetic resonance imaging fibroglandular tissue analysis and correlation with qualitative assessments: a feasibility study.Quant Imaging Med Surg. 2016 Apr;6(2):144-50. doi: 10.21037/qims.2016.03.03. Quant Imaging Med Surg. 2016. PMID: 27190766 Free PMC article.
-
Quantitative Measurements of Breast Density Using Magnetic Resonance Imaging: A Systematic Review and Meta-Analysis.J Clin Med. 2019 May 24;8(5):745. doi: 10.3390/jcm8050745. J Clin Med. 2019. PMID: 31137728 Free PMC article. Review.
-
Vascularity and Dynamic Contrast-Enhanced Breast Magnetic Resonance Imaging.Front Radiol. 2021 Dec 9;1:735567. doi: 10.3389/fradi.2021.735567. eCollection 2021. Front Radiol. 2021. PMID: 37492179 Free PMC article. Review.
-
A level set based framework for quantitative evaluation of breast tissue density from MRI data.PLoS One. 2014 Nov 25;9(11):e112709. doi: 10.1371/journal.pone.0112709. eCollection 2014. PLoS One. 2014. PMID: 25422942 Free PMC article.
References
-
- Boyd N. F., Byng J. W., Jong R. A., Fishell E. K., Little L. E., Miller A. B., Lockwood G. A., Tritchler D. L., and Yaffe M. J., “Quantitative classification of mammographic densities and breast cancer risk: Results from the Canadian national breast screening study,” J. Natl. Cancer Inst. 87(9), 670–675 (1995).10.1093/jnci/87.9.670 - DOI - PubMed
-
- Khazen M., Warren R. M., Boggis C. R., Bryant E. C., Reed S., Warsi I., Pointon L. J., Kwan-Lim G. E., Thompson D., Eeles R., Easton D., Evans D. G., and Leach M. O., “A pilot study of compositional analysis of the breast and estimation of breast mammographic density using three-dimensional T1-weighted magnetic resonance imaging,” Cancer Epidemiol. Biomarkers Prev. 17(9), 2268–2274 (2008).10.1158/1055-9965.EPI-07-2547 - DOI - PMC - PubMed
Publication types
MeSH terms
Grants and funding
LinkOut - more resources
Full Text Sources
Other Literature Sources
Medical

