

A detailed gene expression study of the Miscanthus genus reveals changes in the transcriptome associated with the rejuvenation of spring rhizomes
- PMID: 24320546
- PMCID: PMC4046694
- DOI: 10.1186/1471-2164-14-864
A detailed gene expression study of the Miscanthus genus reveals changes in the transcriptome associated with the rejuvenation of spring rhizomes
Abstract
Background: The Miscanthus genus of perennial C4 grasses contains promising biofuel crops for temperate climates. However, few genomic resources exist for Miscanthus, which limits understanding of its interesting biology and future genetic improvement. A comprehensive catalog of expressed sequences were generated from a variety of Miscanthus species and tissue types, with an emphasis on characterizing gene expression changes in spring compared to fall rhizomes.
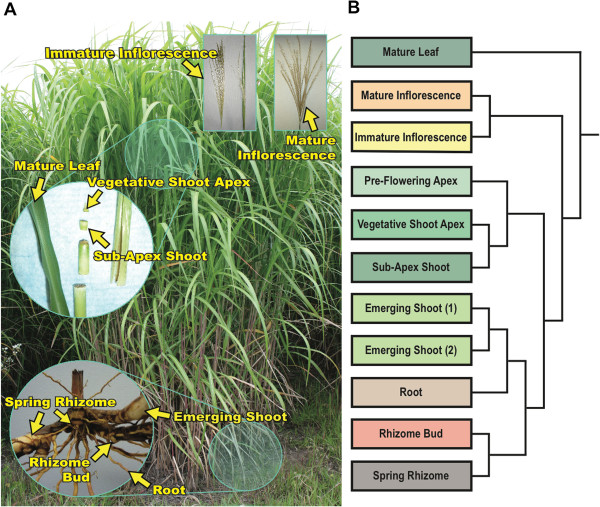
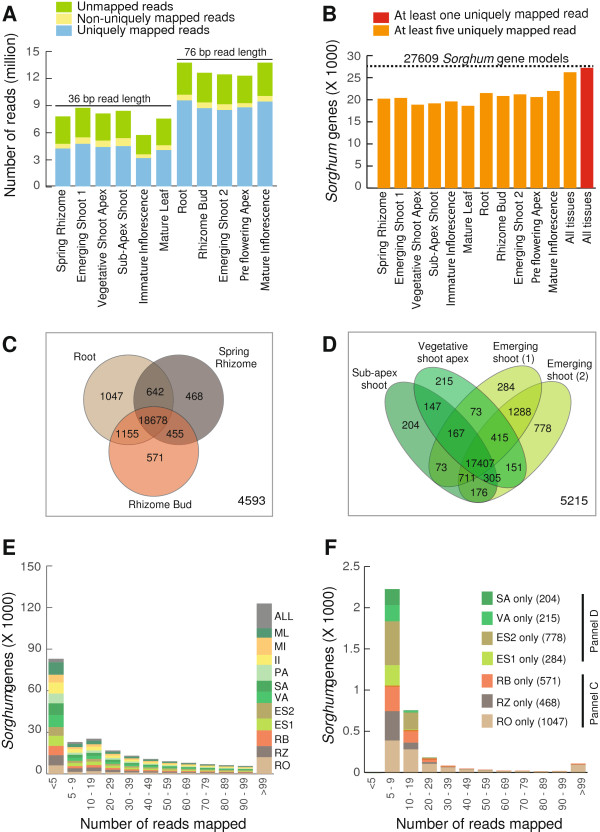
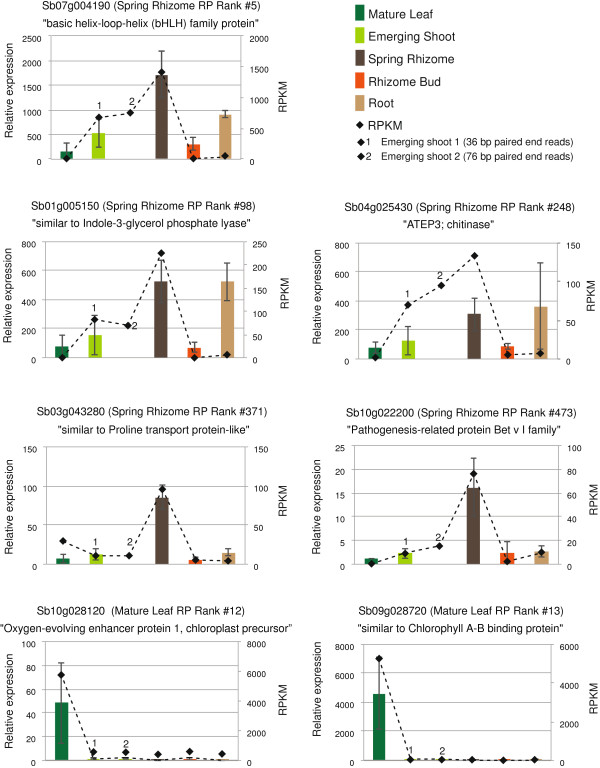
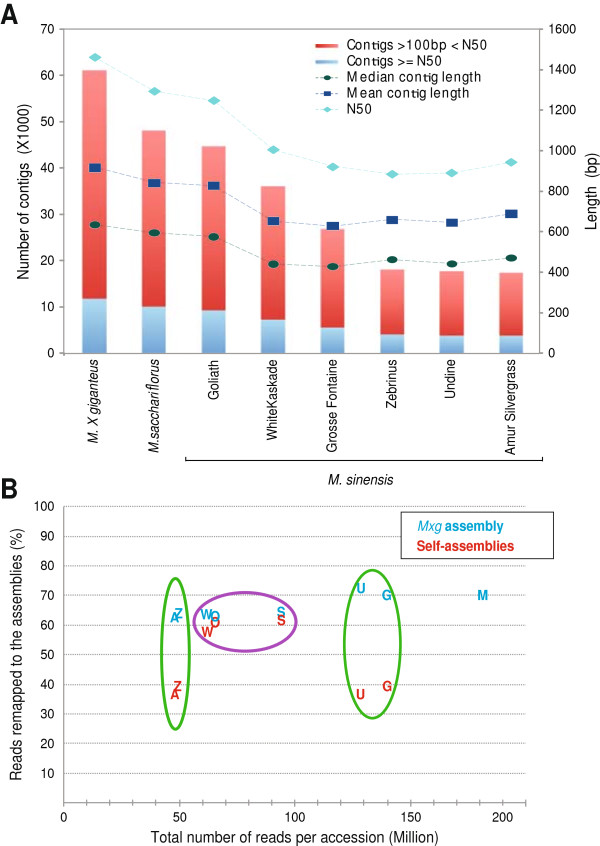
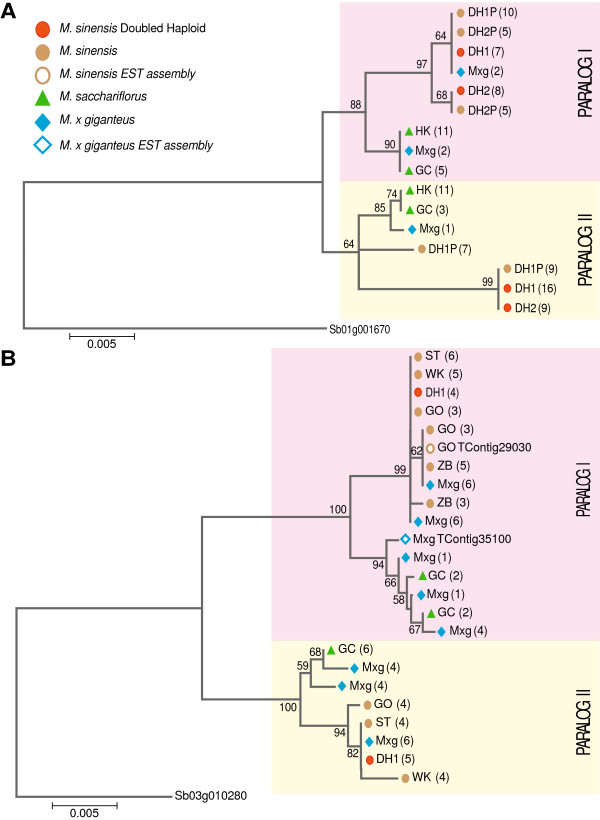
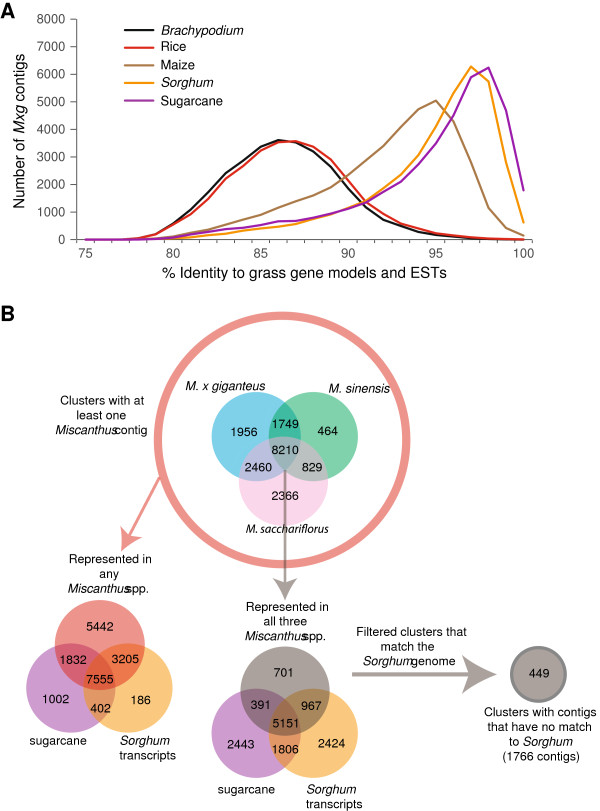
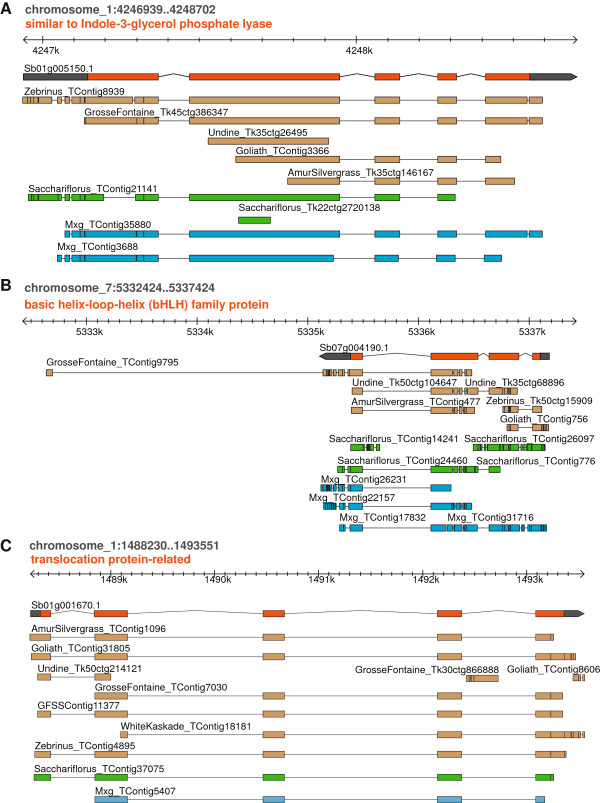
Results: Illumina short read sequencing technology was used to produce transcriptome sequences from different tissues and organs during distinct developmental stages for multiple Miscanthus species, including Miscanthus sinensis, Miscanthus sacchariflorus, and their interspecific hybrid Miscanthus × giganteus. More than fifty billion base-pairs of Miscanthus transcript sequence were produced. Overall, 26,230 Sorghum gene models (i.e., ~ 96% of predicted Sorghum genes) had at least five Miscanthus reads mapped to them, suggesting that a large portion of the Miscanthus transcriptome is represented in this dataset. The Miscanthus × giganteus data was used to identify genes preferentially expressed in a single tissue, such as the spring rhizome, using Sorghum bicolor as a reference. Quantitative real-time PCR was used to verify examples of preferential expression predicted via RNA-Seq. Contiguous consensus transcript sequences were assembled for each species and annotated using InterProScan. Sequences from the assembled transcriptome were used to amplify genomic segments from a doubled haploid Miscanthus sinensis and from Miscanthus × giganteus to further disentangle the allelic and paralogous variations in genes.
Conclusions: This large expressed sequence tag collection creates a valuable resource for the study of Miscanthus biology by providing detailed gene sequence information and tissue preferred expression patterns. We have successfully generated a database of transcriptome assemblies and demonstrated its use in the study of genes of interest. Analysis of gene expression profiles revealed biological pathways that exhibit altered regulation in spring compared to fall rhizomes, which are consistent with their different physiological functions. The expression profiles of the subterranean rhizome provides a better understanding of the biological activities of the underground stem structures that are essentials for perenniality and the storage or remobilization of carbon and nutrient resources.
Figures
References
-
- Lewandowski I, Clifton-Brown JC, Scurlock JMO, Huisman W. Miscanthus: European experience with a novel energy crop. Biomass Bioenergy. 2000;19:209–227. doi: 10.1016/S0961-9534(00)00032-5. - DOI
-
- Rayburn A, Crawford J, Rayburn C, Juvik J. Genome size of three Miscanthus species. Plant Mol Biol Report. 2009;27:184–188. doi: 10.1007/s11105-008-0070-3. - DOI
-
- Swaminathan K, Alabady MS, Varala K, De Paoli E, Ho I, Rokhsar DS, Arumuganathan AK, Ming R, Green PJ, Meyers BC, Moose SP, Hudson ME, others Genomic and small RNA sequencing of Miscanthus\times giganteus shows the utility of sorghum as a reference genome sequence for Andropogoneae grasses. Genome Biol. 2010;11:R12. doi: 10.1186/gb-2010-11-2-r12. - DOI - PMC - PubMed
-
- Nishiwaki A, Mizuguti A, Kuwabara S, Toma Y, Ishigaki G, Miyashita T, Yamada T, Matuura H, Yamaguchi S, Rayburn AL, Akashi R, Stewart JR. Discovery of natural Miscanthus (Poaceae) triploid plants in sympatric populations of Miscanthus sacchariflorus and Miscanthus sinensis in southern Japan. Am J Botany. 2011;98:154–159. doi: 10.3732/ajb.1000258. - DOI - PubMed
Publication types
MeSH terms
Associated data
- Actions
- Actions
- Actions
- Actions
- Actions
- Actions
- Actions
- Actions
- Actions
- Actions
- Actions
- Actions
- Actions
- Actions
- Actions
- Actions
- Actions
- Actions
- Actions
- Actions
- Actions
- Actions
- Actions
- Actions
- Actions
- Actions
- Actions
- Actions
- Actions
- Actions
- Actions
- Actions
- Actions
- Actions
- Actions
- Actions
- Actions
- Actions
- Actions
- Actions
- Actions
- Actions
- Actions
- Actions
- Actions
- Actions
- Actions
- Actions
- Actions
- Actions
- Actions
- Actions
- Actions
- Actions
- Actions
- Actions
- Actions
- Actions
- Actions
- Actions
- Actions
- Actions
- Actions
- Actions
- Actions
- Actions
- Actions
- Actions
- Actions
- Actions
- Actions
- Actions
- Actions
- Actions
- Actions
- Actions
- Actions
- Actions
- Actions
- Actions
- Actions
- Actions
- Actions
- Actions
- Actions
- Actions
- Actions
- Actions
- Actions
- Actions
- Actions
- Actions
- Actions
- Actions
- Actions
- Actions
- Actions
- Actions
- Actions
- Actions
- Actions
- Actions
- Actions
- Actions
- Actions
- Actions
- Actions
- Actions
- Actions
- Actions
- Actions
- Actions
- Actions
- Actions
- Actions
- Actions
- Actions
- Actions
- Actions
- Actions
- Actions
- Actions
- Actions
- Actions
- Actions
- Actions
- Actions
- Actions
- Actions
- Actions
- Actions
- Actions
- Actions
- Actions
- Actions
- Actions
- Actions
- Actions
- Actions
- Actions
- Actions
- Actions
- Actions
- Actions
- Actions
- Actions
- Actions
- Actions
- Actions
- Actions
- Actions
- Actions
- Actions
- Actions
- Actions
- Actions
- Actions
- Actions
- Actions
- Actions
- Actions
- Actions
- Actions
- Actions
- Actions
- Actions
- Actions
- Actions
- Actions
- Actions
- Actions
- Actions
- Actions
- Actions
- Actions
- Actions
- Actions
- Actions
- Actions
- Actions
- Actions
- Actions
- Actions
- Actions
- Actions
- Actions
- Actions
- SRA/SRP017791
- SRA/SRP023470
- SRA/SRP023501
LinkOut - more resources
Full Text Sources
Other Literature Sources
Miscellaneous
