. 2014 Mar;12(2):132-42.
doi: 10.1089/met.2013.0096. Epub 2013 Dec 9.

Mitochondrial uncoupling protein 2 induces cell cycle arrest and necrotic cell death

Affiliations

Mitochondrial uncoupling protein 2 induces cell cycle arrest and necrotic cell death

Arun P Palanisamy et al. Metab Syndr Relat Disord. 2014 Mar.

Abstract

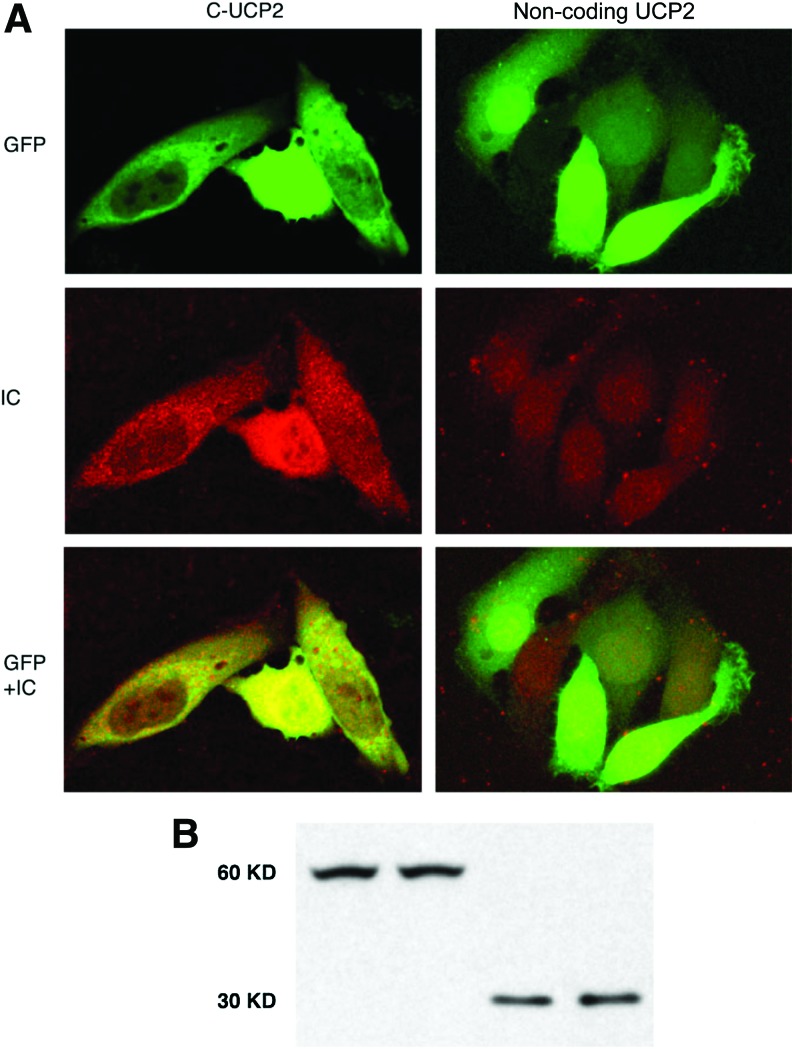
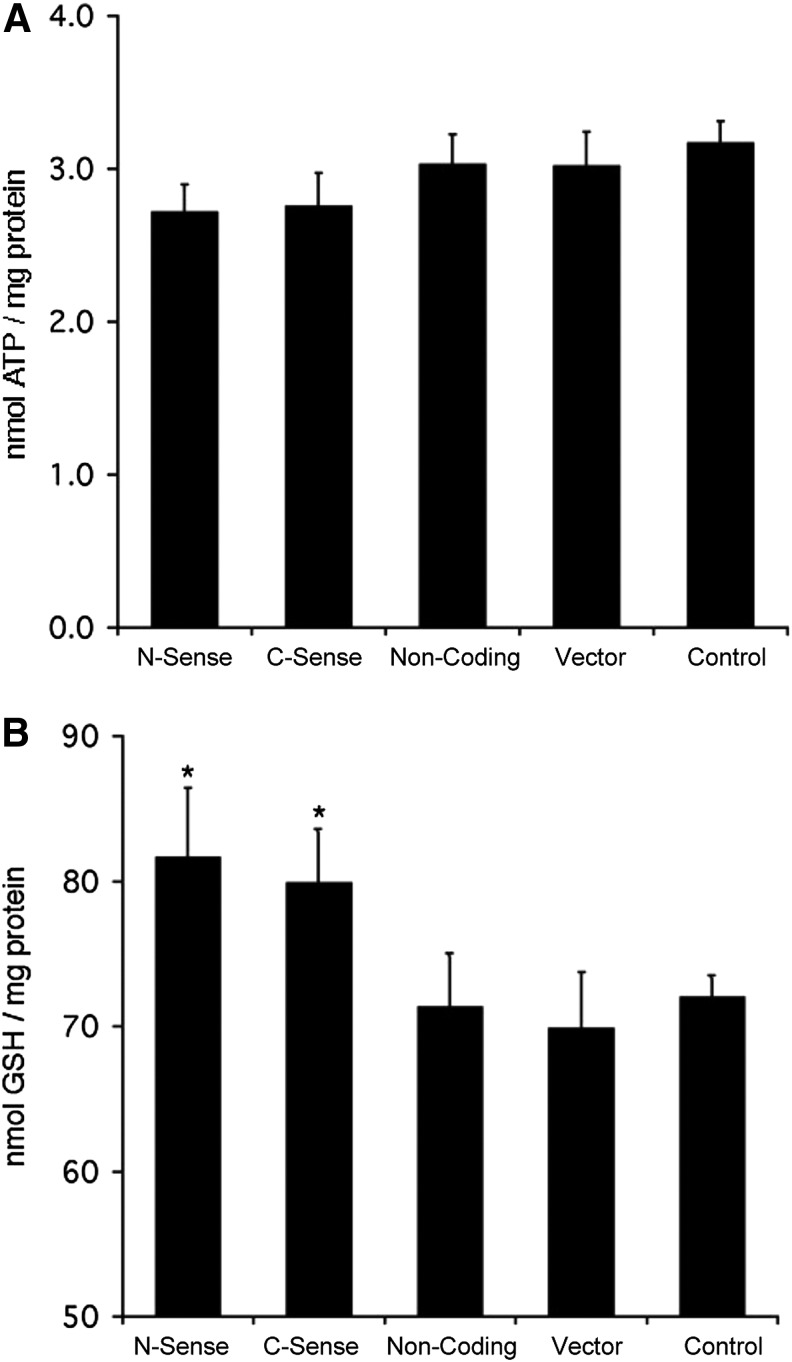
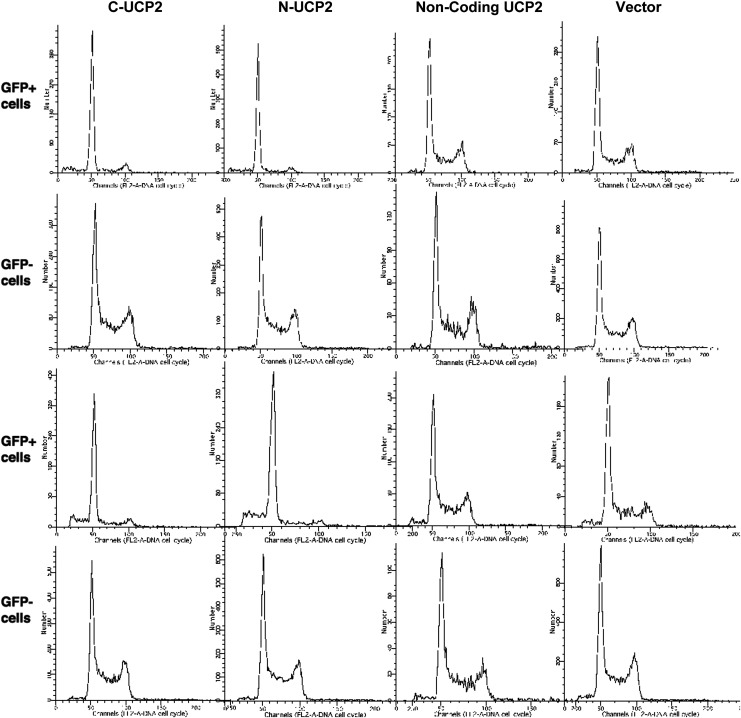
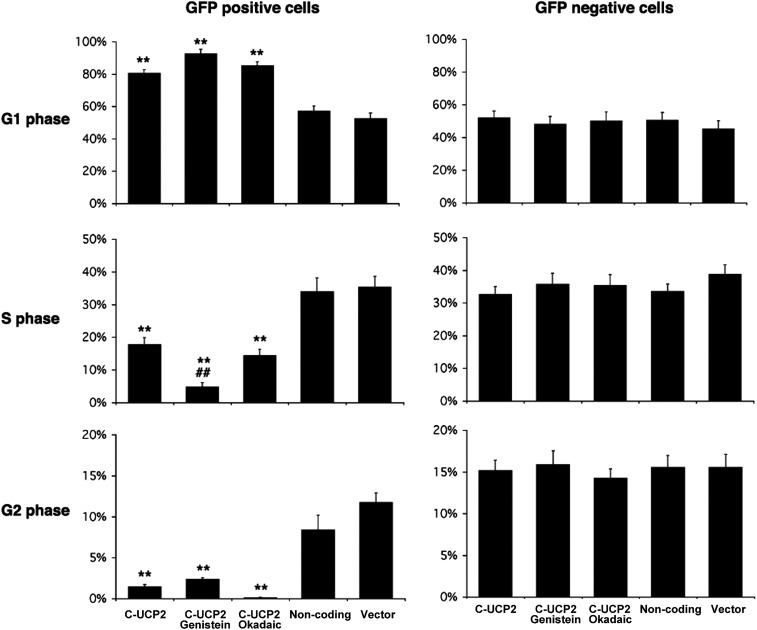
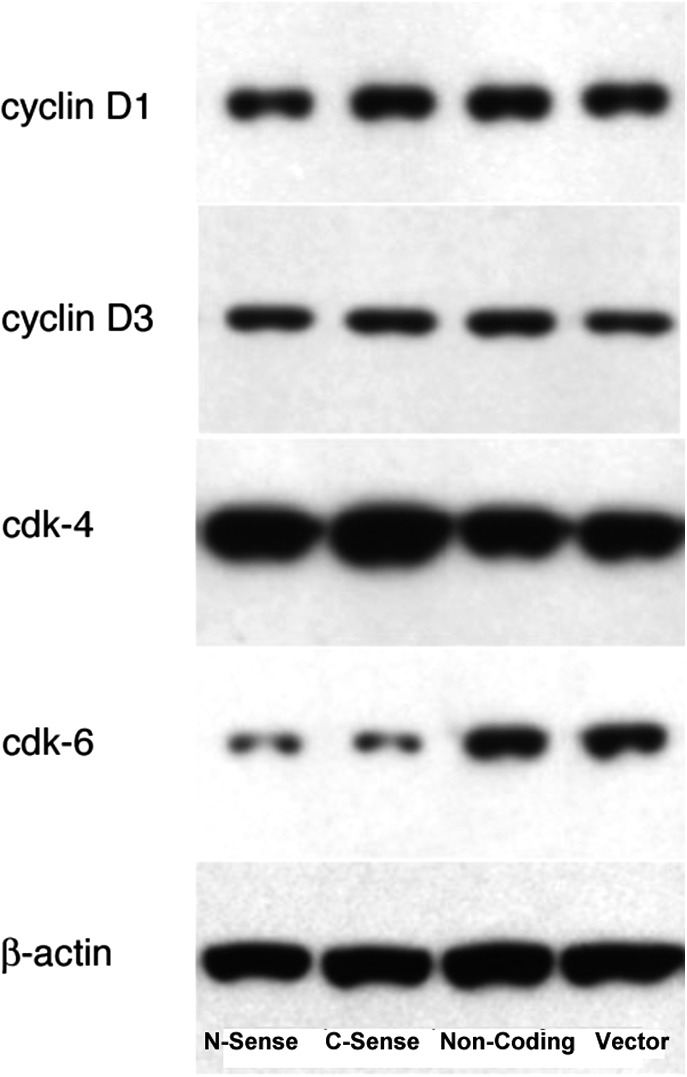
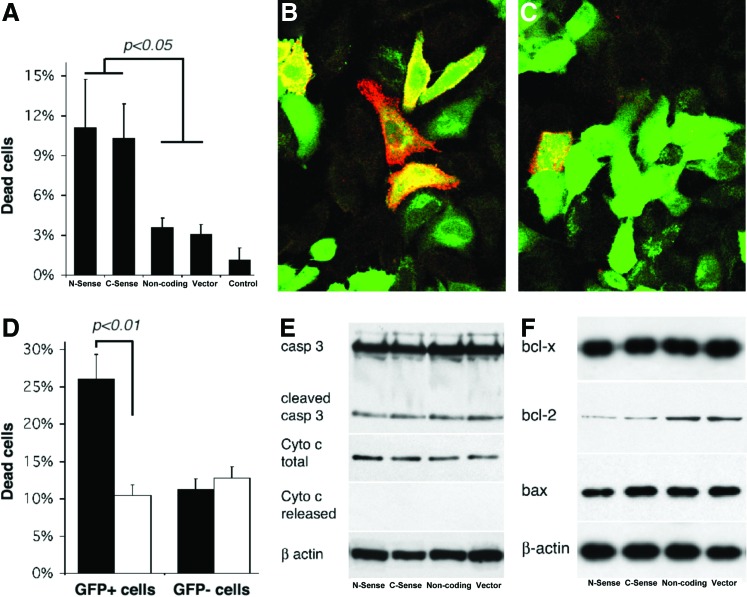
Uncoupling protein 2 (UCP2) is a mitochondrial membrane protein that regulates energy metabolism and reactive oxygen species (ROS) production. We generated mouse carboxy- and amino-terminal green fluorescent protein (GFP)-tagged UCP2 constructs to investigate the effect of UCP2 expression on cell proliferation and viability. UCP2-transfected Hepa 1-6 cells did not show reduced cellular adenosine triphosphate (ATP) but showed increased levels of glutathione. Flow cytometry analysis indicated that transfected cells were less proliferative than nontransfected controls, with most cells blocked at the G1 phase. The effect of UCP2 on cell cycle arrest could not be reversed by providing exogenous ATP or oxidant supply, and was not affected by the chemical uncoupler carbonyl cyanide-p-trifluoromethoxyphenylhydrazone (FCCP). However, this effect of UCP2 was augmented by treatment with genistein, a tyrosine kinase inhibitor, which by itself did not affect cell proliferation on control hepatocytes. Western blotting analysis revealed decreased expression levels of CDK6 but not CDK2 and D-type cyclins. Examination of cell viability in UCP2-transfected cells with Trypan Blue and Annexin-V staining revealed that UCP2 transfection led to significantly increased cell death. However, characteristics of apoptosis were absent in UCP2-transfected Hepa 1-6 cells, including lack of oligonucleosomal fragmentation (laddering) of chromosomal DNA, release of cytochrome c from mitochondria, and cleavage of caspase-3. In conclusion, our results indicate that UCP2 induces cell cycle arrest at G1 phase and causes nonapoptotic cell death, suggesting that UCP2 may act as a powerful influence on hepatic regeneration and cell death in the steatotic liver.


Figures

<b>FIG. 1.</b>
FIG. 1.
Expression patterns of the uncoupling protein 2 (UCP2) fusion protein in Hepa 1–6 cells. (A) Green fluorescent protein (GFP) and fluorescent UCP2 immunocytochemistry (IC) signals of Hepa 1–6 cells transfected with either C-sense UCP2 or noncoding UCP2 show a UCP2 expression pattern in hepatocytes. GFP+IC shows merged pictures of GFP and immunostaining. (B) Western blot analysis of total proteins from transfected Hepa 1–6 cells using alkaline phosphatase–labeled anti-GFP antibody (Clontech, 1:2000 dilution). The figure shows ∼60-kD protein bands in sense UCP2-transfected cells, and ∼30-kD protein bands in noncoding UCP2 and vector-transfected cells. Western blot samples from left to right: transfections with C-UCP2, N-UCP2, noncoding-UCP2, and vector alone, respectively. Color images available online at www.liebertpub.com/met
<b>FIG. 2.</b>
FIG. 2.
Uncoupling protein 2 (UCP2) expression has minimal effect on intracellular adenosine triphosphate (ATP) content (A), but slightly increases glutathione (GSH) contents (B) in transfected cells. From left to right: transfection with C-UCP2, N-UCP2, noncoding-UCP2, EGFP-C1 vector alone, and nontransfected Hepa 1–6 cells. (*) P<0.05 and represents statistical analysis versus noncoding and vector alone–transfected cells.
<b>FIG. 3.</b>
FIG. 3.
Uncoupling protein 2 (UCP2) expression inhibits cell proliferation with G1 phase arrest in Hepa 1–6 cells. This figure shows cell cycle analysis of UCP2-transfected Hepa 1–6 cells by flow cytometry, comparing cell cycle patterns of green fluorescent protein (GFP)-positive versus GFP-negative cells from the same sample transfected with different UCP2 constructs or vector alone, with a posttransfection time of either 48 hr (first 2 rows) or 72 hr (last 2 rows).
<b>FIG. 4.</b>
FIG. 4.
The inhibitory effect of uncoupling protein 2 (UCP2) expression on the cell cycle is enhanced by genistein treatment. This figure shows cell populations in G1, S, and G2 phases in green fluorescent protein (GFP)-positive transfected cells (left) and GFP-negative nontransfected cells from the same transfection preparations: (1) C-UCP2-transfected cells; (2) C-UCP2-transfected cells with 24 hr of treatment with 200 μM genistein; (3) C-UCP2-transfected cells with 24 hr of treatment with okadaic acid; (4) noncoding UCP2-transfected cells; (5) vector alone–transfected cells. Data represent three repeated experiments. (*) Statistical analysis versus noncoding and/or vector alone–transfected cells (as indicated); (#) statistical analysis versus C-UCP2 transfected cells. (**) or (##) P<0.01.
<b>FIG. 5.</b>
FIG. 5.
CDK6 is decreased in uncoupling protein 2 (UCP2)-transfected cells. Western blot analysis of cell division–related proteins from total cellular protein preparations of Hepa 1–6 cells 48 hr after transfection shows a remarkable decrease of Cdk6 but not Cdk4; cyclins D1 and D3 remain constant. Mouse monoclonal antibodies against cyclin D1 (1:1000 dilution); cyclin D3 (1:1000 dilution), Cdk4 (1:2000 dilution), Cdk6 (1:1000 dilution) were all from cell signaling, and anti-β-actin antibody (1:2000 dilution) was from Sigma.
<b>FIG. 6.</b>
FIG. 6.
Uncoupling protein 2 (UCP2) expression induces cell death. (A) Trypan Blue count. Viability of transfected cells: 3% in Lipofectamine and noncoding and vector-transfected cells, 11% in sense UCP2-transfected cells. (B) Live staining with Annexin-V in C-UCP2-transfected cells (left panel) and noncoding UCP2-transfected cells (right panel). Green is the green fluorescent protein (GFP) signal and red is Annexin-V. (C) Flow cytometry analysis with propidium iodide in C-UCP2-transfected cells (black) and noncoding UCP2-transfected cells (white). (D) Apoptosis-related gene expression analyzed by western blot from total cellular protein preparations (except for released cytochrome c, which was cytoplasmic protein preparation without mitochondria) of Hepa 1–6 cells 72 hr after transfection. (E and F) Rabbit polyclonal antibodies against Bcl-2 (sc-492; 1:1000 dilution) and Bax (sc-6236, 1:1000 dilution) were from Santa Cruz; rabbit polyclonal antibody against caspase 3 (1:1000 dilution) was from Cell Signaling; mouse monoclonal antibody against cytochrome c (1:300); and anti-bcl-x (1:500 dilution) was from BD Biosciences. Western blot samples from left to right: Transfections with C-UCP2, N-UCP2, noncoding UCP2, and vector alone, respectively. Color images available online at www.liebertpub.com/met

Similar articles

Cited by

References

    1. Stuart JA, Cadenas S, Jekabsons MB, et al. . Mitochondrial proton leak and the uncoupling protein 1 homologues. Biochim Biophys Acta 2001;1504:144–158 - PubMed
    1. Nicholls DG, Bernson VS, Heaton GM. The identification of the component in the inner membrane of brown adipose tissue mitochondria responsible for regulating energy dissipation. Experientia Suppl 1978;32:89–93 - PubMed
    1. Nicholls DG, Locke RM. Thermogenic mechanisms in brown fat. Physiol Rev 1984;64:1–64 - PubMed
    1. Boss O, Samec S, Paoloni-Giacobino A, et al. . Uncoupling protein-3: A new member of the mitochondrial carrier family with tissue-specific expression. FEBS Lett 1997;408:39–42 - PubMed
    1. Mao W, Yu XX, Zhong A, et al. . UCP4, a novel brain-specific mitochondrial protein that reduces membrane potential in mammalian cells. FEBS Lett 1999;443:326–330 - PubMed

Publication types

LinkOut - more resources