. 2013 Nov 15;38(22):4845-8.
doi: 10.1364/OL.38.004845.

Quantitative phase imaging via Fourier ptychographic microscopy

Quantitative phase imaging via Fourier ptychographic microscopy

Xiaoze Ou et al. Opt Lett. .

Abstract

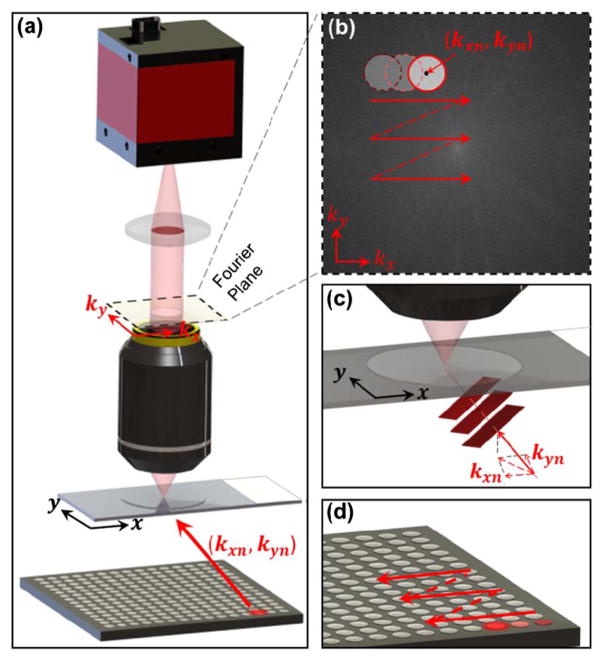
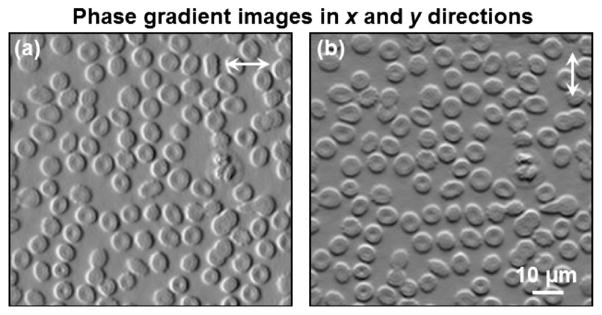
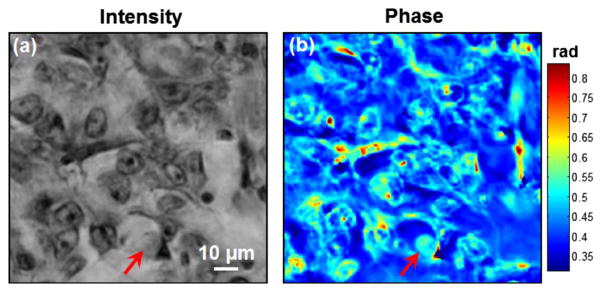
Fourier ptychographic microscopy (FPM) is a recently developed imaging modality that uses angularly varying illumination to extend a system's performance beyond the limit defined by its optical components. The FPM technique applies a novel phase-retrieval procedure to achieve resolution enhancement and complex image recovery. In this Letter, we compare FPM data to theoretical prediction and phase-shifting digital holography measurement to show that its acquired phase maps are quantitative and artifact-free. We additionally explore the relationship between the achievable spatial and optical thickness resolution offered by a reconstructed FPM phase image. We conclude by demonstrating enhanced visualization and the collection of otherwise unobservable sample information using FPM's quantitative phase.


Figures

Fig. 1
Fig. 1
FPM setup and imaging procedure. (a) An LED array sequentially illuminates the sample with different LED elements. (b) The object’s finite spatial frequency support, defined by the microscope’s NA in the Fourier domain (red circle), is imposed at offset locations to reflect each unique LED illumination angle. The Fourier transform of many shifted low-resolution measurements (each circle) are stitched together to extend the complex sample spectrum’s resolution well beyond the objective lens’s cutoff. (c) Light emitted from a single LED strikes a small sample area with wave vector (kxn; kyn). (d) LEDs are sequentially activated during FPM image acquisition.
Fig. 2
Fig. 2
Raw data and FPM intensity reconstruction of a blood smear. A 2×, 0.08 NA objective lens was used to capture the raw data. 225 low-resolution intensity images were used to recover the high-resolution FPM image.
Fig. 3
Fig. 3
Comparing FPM phase reconstructions to digital holographic and theoretical data. FPM transforms low-resolution intensity images from a 2× objective (a1) into a high-resolution phase map (a2) of different-sized polystyrene microbeads, as compared with a DH reconstruction (a3) using a 40× objective. (b) A similar image sequence highlights FPM’s phase-imaging capabilities on a human blood smear. (c) Line traces through the microbeads and a RBC demonstrate quantitative agreement with expected phase performance.
Fig. 4
Fig. 4
Computed phase gradient images in x direction (a) and y direction (b) from the human blood smear phase map in Fig. 3.
Fig. 5
Fig. 5
FPM intensity and phase images of a tissue sample. As indicated by the red arrow, some cell features are transparent in intensity image but visible in the phase image.

References

    1. Fienup JR. Opt Lett. 1978;3:27. - PubMed
    1. Marchesini S, He H, Chapman HN, Hau-Riege SP, Noy A, Howells MR, Weierstall U, Spence JC. Phys Rev B. 2003;68:140101.
    1. Saxton W. Advances in Electronics and Electron Physics Suppl. Academic; 1978. p. 1.
    1. Gerchberg R. Optik. 1972;35:237.
    1. Fienup JR. Appl Opt. 1982;21:2758. - PubMed

Publication types

MeSH terms