

doi: 10.1083/jcb.201308173.
Autophagy proteins stabilize pathogen-containing phagosomes for prolonged MHC II antigen processing
Affiliations
- PMID: 24322427
- PMCID: PMC3857489
- DOI: 10.1083/jcb.201308173
Item in Clipboard
Autophagy proteins stabilize pathogen-containing phagosomes for prolonged MHC II antigen processing
J Cell Biol.
.
Abstract
Antigen preservation for presentation is a hallmark of potent antigen-presenting cells. In this paper, we report that in human macrophages and dendritic cells, a subset of phagosomes gets coated with Atg8/LC3, a component of the molecular machinery of macroautophagy, and maintains phagocytosed antigens for prolonged presentation on major histocompatibility complex class II molecules. These Atg8/LC3-positive phagosomes are formed around the antigen with TLR2 agonists and require reactive oxygen species production by NOX2 for their generation. A deficiency in the NOX2-dependent formation of these antigen storage phagosomes could contribute to compromise antifungal immune control in chronic granulomatous disease patients.
Figures
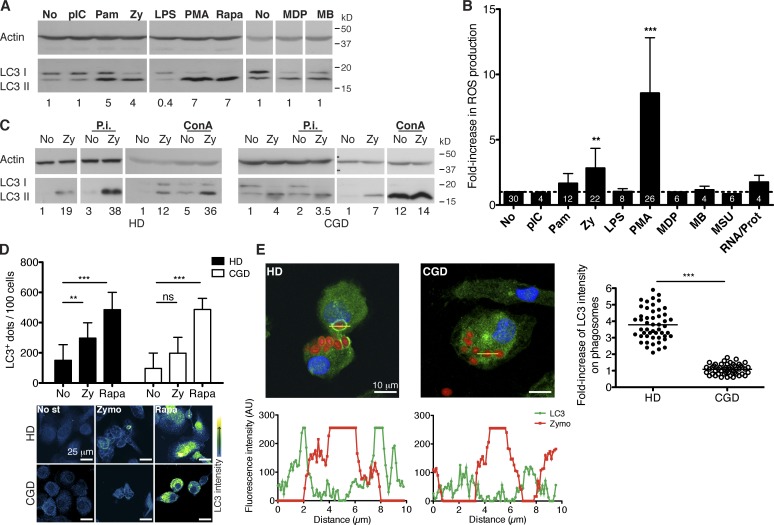
Atg8/LC3 binding to the phagosomal membrane depends on PRR signaling and on NOX2 activity. (A) Human macrophages were treated with the indicated stimuli for 8 h, and LC3-II levels were assessed by WB. Numbers below the blot represent the fold increase of LC3-II compared with the nonstimulated control cells after normalization to the corresponding actin levels. (B) ROS production was determined after 3 h of PRR stimulation (for PMA stimulation after 30 min), by the increase in fluorescence of the probe Amplex UltraRed. Data are expressed as the means ± SD; paired t test; **, P < 0.01; ***, P < 0.001. Numbers inside the bars correspond to the n values. No increase is indicated as a dashed line. (C) LC3-II protein levels increase both in the presence and in the absence of lysosomal inhibitors (P.i., protease inhibitors; ConA, concanamycin A) for the indicated donors. (D) Quantification of Atg8/LC3+ dots on cells of nine HD and nine CGD patients, treated with the indicated stimuli for 6 h. (bottom) Representative confocal images showing Atg8/LC3 signal intensity. Data are expressed as the means ± SD; **, P < 0.01; ***, P < 0.001. No st, no stimulus; Zymo, zymosan. (E) Macrophages were treated with red-labeled zymosan and stained with Atg8/LC3 antibody and DNA content (DAPI). Profile plots of the fluorescence intensity across the indicated trajectories are shown below the pictures. The graph on the right represents the fold increase of Atg8/LC3 intensity on phagosomes (n = 50) compared with the cytosol signal in HD and CGD cells; mean values are represented as horizontal lines. Mann–Whitney test; ***, P < 0.001. AU, arbitrary unit; pIC, polyinosinic/polycytidylic acid; Pam, Pam3CSK4; Zy, zymosan; LPS, lipopolysaccharide; Rapa, rapamycin; MDP, muramyl dipeptide; MB, murabutide; MSU, monosodium urate crystals; RNA/Prot, RNA/protamine.
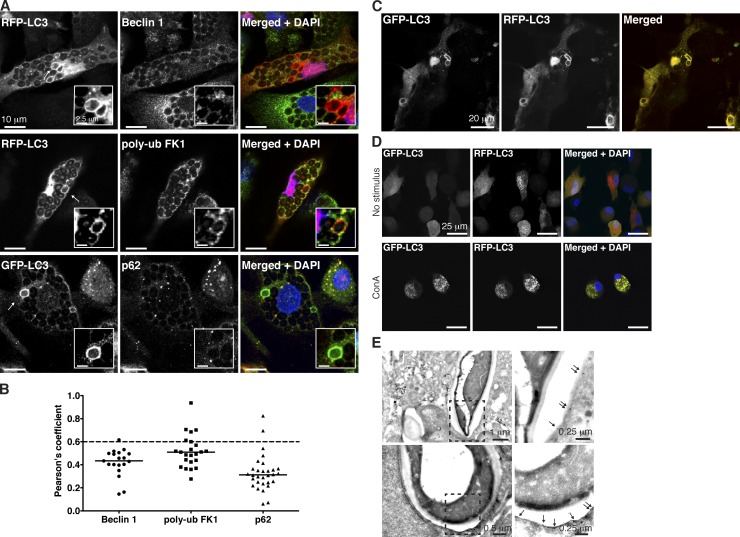
Classical autophagy markers are absent from PRR-induced Atg8/LC3-positive phagosomes. (A) Macrophages transduced with lentiviral constructs of fluorescent-tagged Atg8/LC3 were stained for the indicated proteins and DAPI. Arrows point to Atg8/LC3-positive phagosomes. Insets show a zoomed-in view of the phagosomes of interest. (B) Pearson’s coefficient values were calculated for each marker in Atg8/LC3-positive phagosomes (n ≥ 20). Mean values are represented as horizontal lines. A Pearson score >0.6 is indicated in each graph as a dashed line. poly-ub, polyubiquitin. (C) Zymosan-containing phagosomes in macrophages transduced with the tandem fluorescent-tagged Atg8/LC3 construct and treated with zymosan for 6 h. (D) Macrophages transduced with tandem fluorescent Atg8/LC3 and treated or not treated with concanamycin A (ConA). (E) Representative GFP immunogold labeling in electron micrographs of phagosomes harboring heat-killed C. albicans in GFP-Atg8/LC3–transduced macrophages. The areas highlighted by dashed line boxes are shown with higher magnification on the right. Arrows point to the single membrane structure labeled with gold particles.
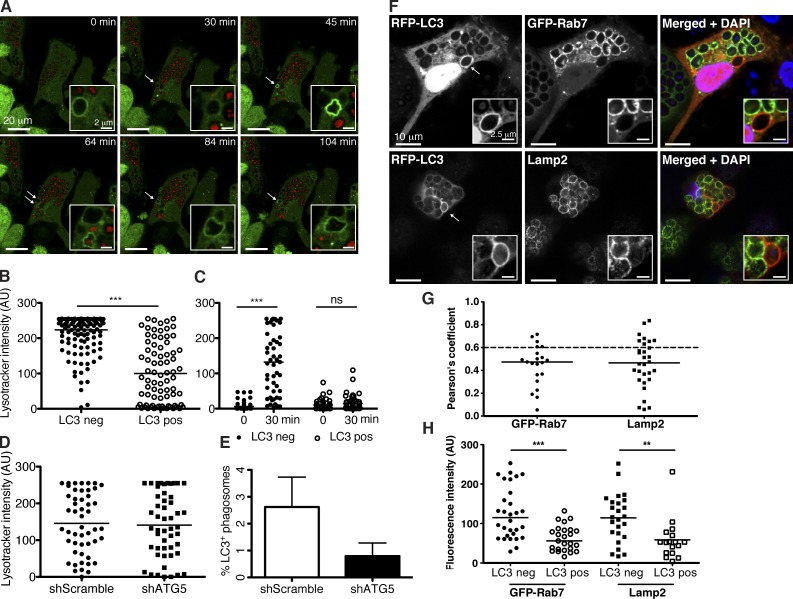
Phagosomes harboring Atg8/LC3 have delayed maturation. (A) GFP-Atg8/LC3–transduced macrophages were preloaded with red LysoTracker dye for 1 h and incubated with zymosan. Atg8/LC3 recruitment to the phagosomes (white arrows) was followed at 5-min intervals (see Video 3 ) and LysoTracker signal intensity registered. Insets show a zoomed-in view of the phagosomes of interest. Representative time-lapse images are shown. (B) Lysosomal dye intensity was compared in phagosomes with (LC3 positive [pos]) and without (LC3 negative [neg]) GFP-Atg8/LC3 signal (n ≥ 80); Mann–Whitney test; ***, P < 0.001. (C) Recruitment of the lysosomal dye was followed over time, and signal intensity was registered immediately (0 min) or after 30 min of zymosan uptake within the same phagosome (n = 50); paired t test; ***, P < 0.001. (D) LysoTracker signal intensity was compared in macrophage phagosomes transduced with scramble shRNA versus atg5 shRNA lentiviruses. Graph shows phagosomes (n = 50) analyzed after 2 h of zymosan uptake. (E) Atg8/LC3 recruitment to phagosomes was compared in macrophages transduced with scramble shRNA versus atg5 shRNA lentivirus. Percentage of Atg8/LC3-positive phagosomes is calculated from a total of 50 phagosomes counted in each condition after 5 h of zymosan engulfment. Data are pooled from three different donors. Error bars show SDs. (F) Macrophages transduced with RFP-Atg8/LC3 lentiviral construct were stained for Lamp2 and DAPI or double transduced with the GFP-Rab7 construct. Arrows point to Atg8/LC3-positive phagosomes. Insets show a zoomed-in view of the phagosomes of interest. (G) Pearson’s coefficient values were calculated for each marker in Atg8/LC3-positive phagosomes (n ≥ 20). A Pearson score >0.6 is indicated in each graph as a dashed line. (H) Indicated marker signal intensity was compared in Atg8/LC3-positive versus negative phagosomes (n ≥ 25). Mean values are represented as horizontal lines. **, P < 0.01; ***, P < 0.001. AU, arbitrary unit.
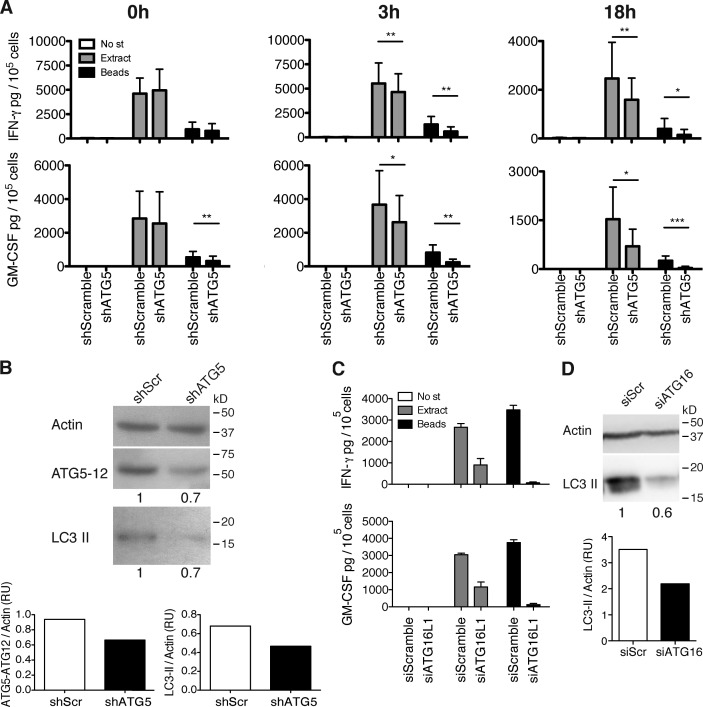
Components of the molecular machinery of macroautophagy can stabilize pathogen-containing phagosomes for prolonged antigen processing onto MHC class II molecules. (A) IFN-γ and GM-CSF ELISAs on supernatants of the C. albicans–specific T cell clone, co-cultured with cognate macrophages transduced with lentiviral atg5-specific or control shRNA, and pulsed or not pulsed with C. albicans extract or C. albicans–coated beads. Time indicated above each graph corresponds to the time point at which the T cells were added for co-culture, after the initial 4 h of pulsing. Bars represent means ± SD of data pooled from three independent experiments; paired t test; *, P < 0.5; **, P < 0.01; ***, P < 0.001. No st, no stimulus. (B) atg5 silencing levels were controlled by WB for LC3-II and Atg5–Atg12 complexes on day 3 after transduction and quantified by densitometry. Numbers below the blot represent the fold increase of LC3-II or Atg5–Atg12 complexes compared with the control cells after normalization to the corresponding actin levels. The results are representative of three assays, corresponding to the experiments shown in A. shScr, scrambled shRNA. (C) Same as in A using macrophages transfected with atg16L1 siRNA or control siRNA. After 4 h of pulsing, cells were washed and incubated in new medium for an additional 18 h before the T cells were added. Error bars show SDs. (D) atg16L1 silencing levels were controlled by WB for LC3-II on day 2 after transduction and quantified by densitometry. Numbers below the blot represent the fold increase of LC3-II compared with the control cells after normalization to the corresponding actin levels. One representative blot out of two performed is shown. RU, relative units; SiScr, scrambled siRNA.
References
-
- Dengjel J., Høyer-Hansen M., Nielsen M.O., Eisenberg T., Harder L.M., Schandorff S., Farkas T., Kirkegaard T., Becker A.C., Schroeder S., et al. 2012. Identification of autophagosome-associated proteins and regulators by quantitative proteomic analysis and genetic screens. Mol. Cell. Proteomics. 11:M111.014035 10.1074/mcp.M111.014035 - DOI - PMC - PubMed
-
- Fonteneau J.F., Larsson M., Somersan S., Sanders C., Münz C., Kwok W.W., Bhardwaj N., Jotereau F. 2001. Generation of high quantities of viral and tumor-specific human CD4+ and CD8+ T-cell clones using peptide pulsed mature dendritic cells. J. Immunol. Methods. 258:111–126 10.1016/S0022-1759(01)00477-X - DOI - PubMed
Publication types
MeSH terms
Substances
Grants and funding
LinkOut - more resources
Full Text Sources
Other Literature Sources
Research Materials
Miscellaneous
