Review
. 2014 Jun 7;43(11):3835-53.
doi: 10.1039/c3cs60346f. Epub 2013 Dec 9.

Plasmonic nanomaterials for biodiagnostics

Affiliations
Review

Plasmonic nanomaterials for biodiagnostics

Philip D Howes et al. Chem Soc Rev. .

Abstract

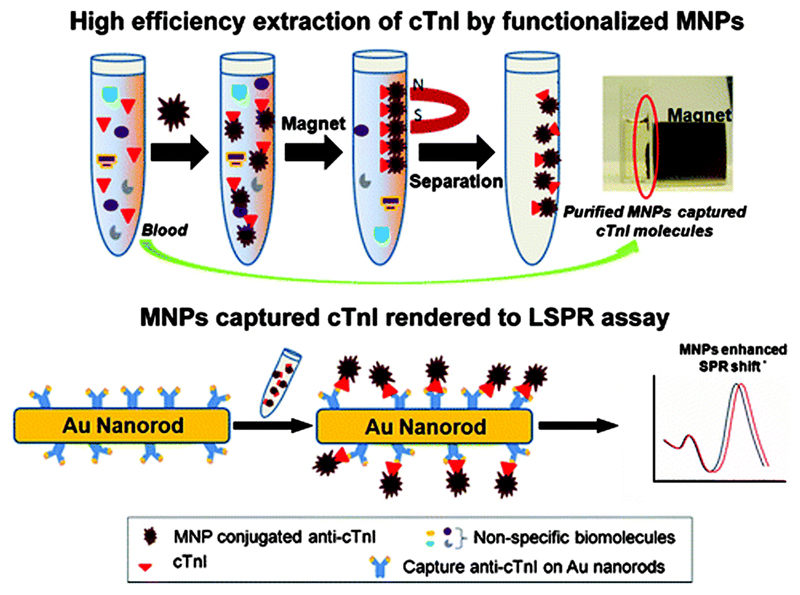
The application of nanomaterials to detect disease biomarkers is giving rise to ultrasensitive assays, with scientists exploiting the many advantageous physical and chemical properties of nanomaterials. The fundamental basis of such work is to link unique phenomena that arise at the nanoscale to the presence of a specific analyte biomolecule, and to modulate the intensity of such phenomena in a ratiometric fashion, in direct proportion with analyte concentration. Precise engineering of nanomaterial surfaces is of utmost importance here, as the interface between the material and the biological environment is where the key interactions occur. In this tutorial review, we discuss the use of plasmonic nanomaterials in the development of biodiagnostic tools for the detection of a large variety of biomolecular analytes, and how their plasmonic properties give rise to tunable optical characteristics and surface enhanced Raman signals. We put particular focus on studies that have explored the efficacy of the systems using physiological samples in an effort to highlight the clinical potential of such assays.


Figures

Fig. 1
Fig. 1
Aggregation of DNA aptamer-stabilised AuNPs for colourimetric sensing of lysozyme, with corresponding TEM images showing (A) dispersed and (B) aggregated AuNPs after the addition of lysozyme. Adapted from ref. 8, and reprinted with permission from Springer.
Fig. 2
Fig. 2
(A) Glucose oxidase-controlled deposition/nucleation of Ag, controlling the LSPR shift of Au nanostars. (B) TEM image of the Au nanostars (scale bar, 50 nm). (C) Dose–response curve showing inverse sensitivity, with LSPR spectral shift reducing with increasing PSA concentration in serum. Adapted from ref. 9, and reprinted with permission from Nature Publishing Group.
Fig. 3
Fig. 3
Enzyme controlled AuNP nucleation and aggregation state through H2O2 evolution gives rise to a colourimetric response to HIV-1 capsid antigen p24, showing BSA as a control. Adapted from ref. 10, and reprinted with permission from Nature Publishing Group.
Fig. 4
Fig. 4
(A) TEM image of AuNRs used to detect hepatitis B surface antigen (HBsAg). (B) Absorbance spectrum, showing a red shift in the spectrum on addition of the analyte. Adapted from ref. 11, and reprinted with permission from Elsevier.
Fig. 5
Fig. 5
A schematic illustration of the bioseparation of target molecules from blood plasma using functional Fe3O4 MNPs, followed by the MNP mediated LSPR assay. The use of MNPs facilitates enhancement of the LSPR shift. Adapted from ref. 12, and reprinted with permission from The American Chemical Society.
Fig. 6
Fig. 6
Glass substrates with (a) one layer and (b) two layers of 84 nm AuNPs. The dual layer of AuNPs brings the LSPR peak into the NIR region of the spectrum facilitating sensing in plasma and serum. Adapted from ref. 16, and reprinted with permission from Springer.
Fig. 7
Fig. 7
A simulation study comparing the near-field electric field profile of Au nanodisks on a borosilicate glass substrate (RI = 1.52) in water (RI = 1.33). (A) Au nanodisks lying flat on the glass exhibit a shifted EM near-field towards the substrate, reducing the ‘hot spots’ on the exposed top surface where sensing would occur. (B) Au nanodisks supported on dielectric pillars exhibit larger exposed surface areas for sensing and increased ‘hot spots’ exposed for sensing. Adapted from ref. 20, and reprinted with permission from The American Chemical Society.
Fig. 8
Fig. 8
(A) AgFONs were prepared by depositing metal through a mask of self-assembled nanospheres. The AgFON was then functionalised by successive immersions in ethanolic solutions of DT and MH. Glucose is able to partition into and out of the DT/MH layer. The resulting structure is shown in the atomic force micrograph (top right). (B) SERS spectra used for quantitative detection of glucose, where the spectra represent [I] DT monolayer on AgFON substrate; [II] mixture of DT monolayer and glucose; [III] residual glucose spectrum produced by subtracting [I] from [II]; and [IV] normal Raman spectrum of crystalline glucose for comparison. Adapted from ref. 25, and reprinted with permission from The American Chemical Society.
Fig. 9
Fig. 9
(A) GSH-mediated release of thiopurines adsorbed on AuNPs. (B) GSH concentration-dependent SERS intensity of 6MP adsorbed on AuNPs suspended in water. The tripeptide control shows no change in SERS intensity of the adsorbed drug molecules. (C) In vivo SERS spectra of 6TG adsorbed on AuNPs after treatment of GSH and the corresponding stick diagram to compare with that of no GSH treatment. Adapted from ref. 32, and reprinted with permission from The American Chemical Society.
Fig. 10
Fig. 10
(A) Illustration of AuNPs functionalised with the anticancer drug doxorubicin (DOX) using a pH-sensitive hydrazine linkage (highlighted in red). (B) Schematic diagram of pH-triggered drug release tracking in acidic lysosomes by monitoring the SERS spectra and fluorescence signal from the DOX molecules. Adapted from ref. 33, and reprinted with permission from The Royal Society of Chemistry.
Fig. 11
Fig. 11
(A) Schematic representation of the target DNA detection by Au particle-on-wire system. (B) Schematic of the patterned multiplex pathogen DNA detection using a particle-on-wire SERS sensor. Four different gold NWs were first functionalized with probe DNA corresponding to the four targets. These NWs were then hybridised with the target DNA, followed by incubation with reporter DNAs having Cy5 at 5′-termini and Au NPs at 3′-termini. Efm: Enterococcus faecium; Sau: Staphylococcus aureus; Smal: Stenotrophomonas maltophilia; Vvul: Vibrio vulnificus. (C) SERS intensities of 1580 cm−1 band (corresponding to the Raman reporter) when the sample contains two, three, and four kinds of target DNAs of which concentrations are 10−8 M each. Here, A = E. faecium; B = S. aureus; C = S. maltophilia; D = V. vulnificus. Adapted from ref. 36, and reprinted with permission from The American Chemical Society.
Fig. 12
Fig. 12
(A) A schematic representation of the detection of MUC4 biomarker using a SERS nanotag. (B) SERS detection of MUC4 in pooled sera from normal individuals and patients with pancreatitis (P) or pancreatic cancer (PC1, PC2, and PC3). Each pool includes sera from 10 individuals. Adapted from ref. 38, and reprinted with permission from The American Chemical Society.
Fig. 13
Fig. 13
(A) Two-layer, direct, microarray-format protein detection with distinct Raman labels based upon pure 12C and 13C SWNT tags. 12C and 13C SWNTs were conjugated to GaM and GaH-IgGs, respectively, providing specific binding to complimentary IgGs of mouse or human origin. (B) Raman scattering spectra of 12C (red) and 13C (green) SWNT Raman tags. (C) Raman scattering map of integrated 12C (red) and 13C (green) SWNT scattering above baseline, demonstrating easily resolved, multiplexed IgG detection. Adapted from ref. 39, and reprinted with permission from Nature Publishing Group.
Fig. 14
Fig. 14
(A) In vivo cancer marker detection using surface-enhanced Raman with scFv-antibody conjugated AuNPs that recognise the tumour marker. (B) SERS spectra obtained from the tumour (red) and liver (blue) by using targeted NPs and (C) non-targeted NPs. (D) Photographs showing a laser beam focusing on tumour or liver sites. In vivo SERS spectra were obtained with a 785 nm laser at 20 mW and 2 s integration. Adapted from ref. 43, and reprinted with permission from Nature Publishing Group.
Fig. 15
Fig. 15
SERS-guided intraoperative surgery using MPR NPs. (A, B) Living tumour-bearing mice underwent craniotomy under general anaesthesia. Quarters of the tumour were then sequentially removed (as illustrated in the photographs, (A)), and intraoperative Raman imaging was performed after each resection step (B) until the entire tumour had been removed, as assessed by visual inspection. (C) A subsequent histological analysis of sections from these foci showed an infiltrative pattern of the tumour in this location. The Raman spectroscopic image (right) shows the selective presence of the MPRs. Adapted from ref. 45, and reprinted with permission from Nature Publishing Group.
Fig. 16
Fig. 16
(A) SERS intensity (I) of some tricarbocyanine derivatives on 60 nm Au NPs recorded using 785 nm excitation. (B) Schematic of the preparation of BSA-stabilised and antibody- or single-chain variable fragment (scFv)-conjugated SERS nanotags. Adapted from ref. 46, and reprinted with permission from Nature Publishing Group.
Fig. 17
Fig. 17
The scanometric assay optimised for (A) protein and (B) microRNA detection. The analyte is captured on a glass surface, then the SNA–Au NPs are washed across, binding to the captured analyte. High sensitivity is achieved through amplification of the light scattering signal from the AuNP probes by electroless deposition of Au or Ag. Adapted from ref. 49 and , and reprinted with permission from The American Chemical Society.

References

    1. Pelaz B, Jaber S, de Aberasturi DJ, Wulf V, Aida T, de la Fuente JM, Feldmann J, Gaub HE, Josephson L, Kagan CR, Kotov NA, et al. ACS Nano. 2012;6:8468–8483. - PubMed
    1. Wang J, Qu X. Nanoscale. 2013;5:3589–3600. - PubMed
    1. Kumar PS, Pastoriza-Santos I, Rodriguez-Gonzalez B, Garcia de Abajo FJ, Liz-Marzan LM. Nanotechnology. 2008;19:015606. - PubMed
    1. Gupta S, Andresen H, Ghadiali JE, Stevens MM. Small. 2010;6:1509–1513. - PubMed
    1. Aili D, Mager M, Roche D, Stevens MM. Nano Lett. 2011;11:1401–1405. - PubMed

Publication types