. 2013 Dec 16;210(13):2851-72.
doi: 10.1084/jem.20131195. Epub 2013 Dec 9.

Chemotherapy activates cancer-associated fibroblasts to maintain colorectal cancer-initiating cells by IL-17A

Affiliations

Chemotherapy activates cancer-associated fibroblasts to maintain colorectal cancer-initiating cells by IL-17A

Fiorenza Lotti et al. J Exp Med. .

Abstract

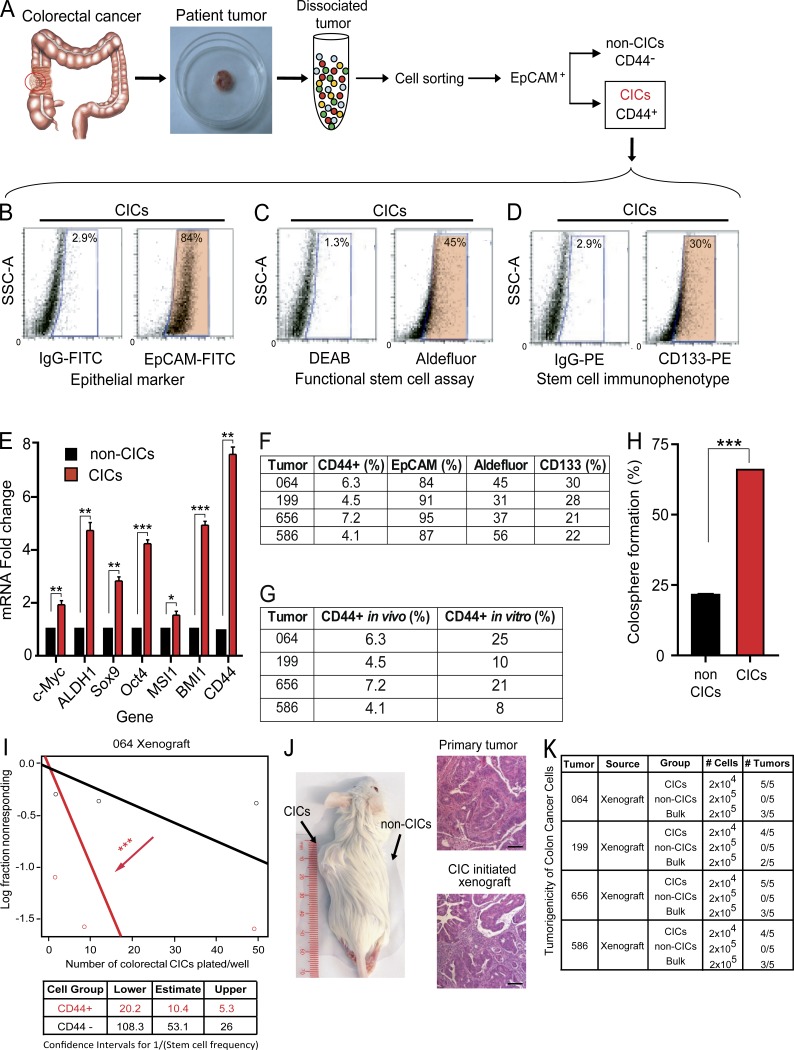
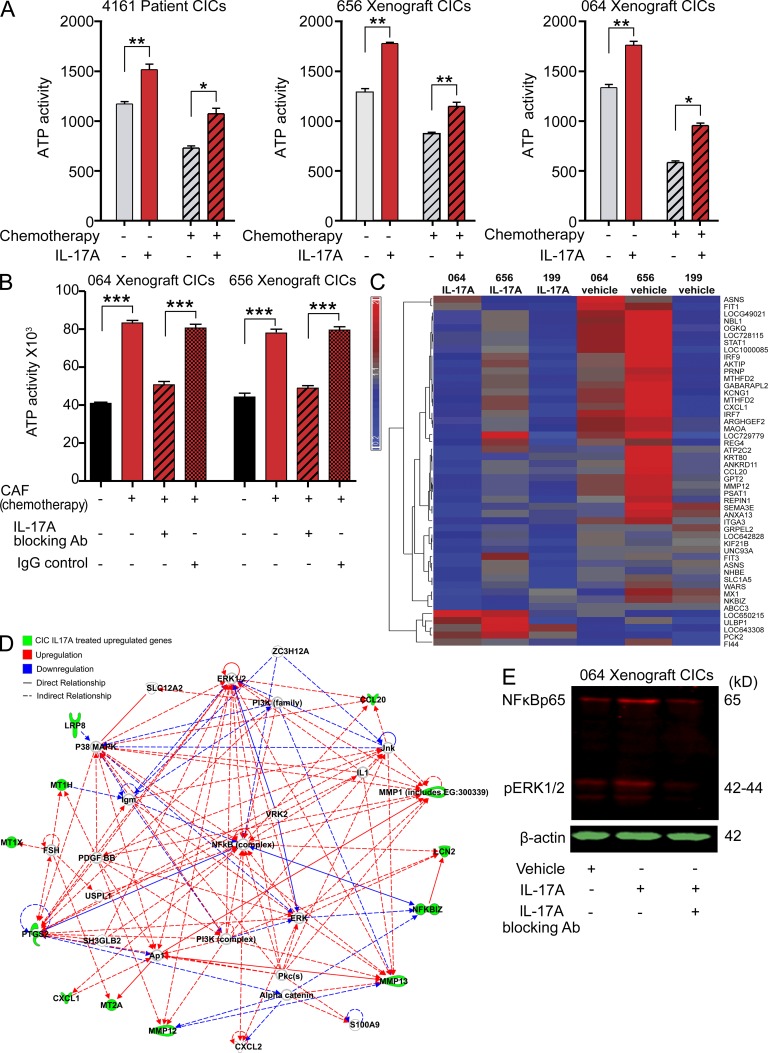
Many solid cancers display cellular hierarchies with self-renewing, tumorigenic stemlike cells, or cancer-initiating cells (CICs) at the apex. Whereas CICs often exhibit relative resistance to conventional cancer therapies, they also receive critical maintenance cues from supportive stromal elements that also respond to cytotoxic therapies. To interrogate the interplay between chemotherapy and CICs, we investigated cellular heterogeneity in human colorectal cancers. Colorectal CICs were resistant to conventional chemotherapy in cell-autonomous assays, but CIC chemoresistance was also increased by cancer-associated fibroblasts (CAFs). Comparative analysis of matched colorectal cancer specimens from patients before and after cytotoxic treatment revealed a significant increase in CAFs. Chemotherapy-treated human CAFs promoted CIC self-renewal and in vivo tumor growth associated with increased secretion of specific cytokines and chemokines, including interleukin-17A (IL-17A). Exogenous IL-17A increased CIC self-renewal and invasion, and targeting IL-17A signaling impaired CIC growth. Notably, IL-17A was overexpressed by colorectal CAFs in response to chemotherapy with expression validated directly in patient-derived specimens without culture. These data suggest that chemotherapy induces remodeling of the tumor microenvironment to support the tumor cellular hierarchy through secreted factors. Incorporating simultaneous disruption of CIC mechanisms and interplay with the tumor microenvironment could optimize therapeutic targeting of cancer.


Figures

Figure 1.
Figure 1.
CD44 identifies CICs. (A) Single-cell suspensions from dissociated patient colorectal tumors were sorted by FACS for high expression of CD44-PE. The highly positive population was gated in a range of 4 to 10% (depending on the percentage of the total positive cell population of each sample) of the tail of the positive cells. (B–D) CICs were analyzed by FACS: (B) the epithelial marker EpCAM-FITC; (C) the functional stem cell assay Aldefluor; and (D) the stem cell immunophenotype by CD133-PE. (E) Quantitative RT-PCR analysis of CIC markers including c-Myc, ALDH1, Sox9, Oct4, MSI1, BMI1, and CD44 was performed on CICs and non-CICs. Data are presented as mean ± SD (n = 3); *, P < 0.05 ; **, P < 0.01; ***, P < 0.001. Student’s t test was used to assess the significance. The experiment was performed twice and representative data are shown. (F) Colorectal tumor specimens from patients were subjected to dissociation to single cells and FACS sorting for high expression of CD44. The frequency of CD44+ in each tumor is indicated in the CD44+ column of the table. CD44+ cells were sequentially analyzed for the expression of the epithelial marker EpCAM, the functional stem cell assay Aldefluor, and the stem cell immunophenotype CD133. The percentages of marker positive CD44+ cells obtained are listed in a tabular form. (G) Single-cell suspensions from dissociated patient colorectal tumors and cells cultured in stem cell medium were analyzed by FACS for the expression of CD44. The percentages obtained are listed in a tabular form. (H) Quantification of sphere-formation assay demonstrates that CICs have elevated tumorsphere formation efficiency. CICs and non-CICs from two samples were plated in 96-well plates for a period of 14 d. Data are presented as a percentage of wells containing tumorspheres compared to the total number of wells. Data are presented as mean ± SD (n = 2); ***, P < 0.001. Student’s t test was used to assess the significance. The experiment was performed two times and representative data are shown. (I) Limiting dilution assay demonstrates that CD44+ cells have elevated tumorsphere formation efficiency. CD44+ and CD44 population from two samples were plated in limiting dilution (50, 10, 1 cell[s] per well) in 96-well plates in stem cell media. The presence of spheres was evaluated after 14 d. Data are presented as mean ± SD (n = 20); ***, P < 0.001. The likelihood ratio test was used to assess the significance. The experiment was performed two times and representative data are shown. (J) Representative images of tumors initiated from CICs subcutaneously implanted into immunocompromised mice with hematoxylin and eosin staining of tumor sections. Scale bar, 100 μm. (K) CICs were tumorigenic while 10 fold more non-CICs were unable to generate tumors in four independent specimens. Five mice were used per group.
Figure 2.
Figure 2.
Tumor response to treatment is associated with increased frequency and resistance of CICs. (A) Cell growth of CICs and non-CICs from two independent human specimens was assessed by ATP based assay (CellTiter-Glo) following chemotherapy (FOLFOX: 50 µg/ml 5-flurouracil + 10 µM oxaliplatin + 1 µM leucovorin). Data are presented as mean ± SD (n = 3); **, P < 0.01; ***, P < 0.001. Student’s t test was used to assess the significance. The experiment was performed three times and representative data are shown. (B) Apoptosis of CICs and non-CICs from two independent human specimens was assessed by caspase 3/7 activation after chemotherapy. Data are presented as mean ± SD (n = 3); **, P < 0.01. Student’s t test was used to assess the significance. The experiment was performed three times and representative data are shown. (C) Enrichment of CICs in bulk cells from four independent human specimens was assessed by FACS analysis for CD44 (representative sample) after chemotherapy. Student’s t test was used to assess the significance. The experiment was performed once for each individual specimen.
Figure 3.
Figure 3.
Tumor response to treatment is associated with increased frequency of CAFs. (A) Frozen sections of human colorectal tumors matched before and after cytotoxic treatment from a representative patient (334) were stained for markers of activated fibroblasts (Vimentin, αSMA) and epithelial cells (EpCAM). Nuclei stained with DAPI. Arrows indicate the stromal compartment. (B) Frozen sections of human colorectal tumors matched before and after cytotoxic treatment from two different patients (1086 or 5712) were stained for αSMA and EpCAM. The ratio of the αSMA-positive area versus the EpCAM-positive area was quantified and shown on the right. Data are presented as mean ± SD. *, P < 0.05. Student’s t test was used to assess the significance. Data are representative of three experimental repeats per group. (C) cDNA levels of markers of activated fibroblasts (Vimentin, α-SMA, and PDGFRα) were quantified by quantitative RT-PCR in patients untreated and treated (17 samples each group). Data are presented as mean ± SD; *, P < 0.05; ***, P < 0.001. Student’s t test was used to assess the significance. The experiment was performed three times and representative data are shown. (D) Single cell suspensions from dissociated patient colorectal tumor were sorted by FACS for the expression of PGDFRα-PE. The purity of the sorted population was checked after the sorting. (E) The PDGFRα+ isolated population was validated by positive immunostaining for CAF markers (αSMA-Vimentin-FSP1-FAP) and negative immunostaining for an epithelial marker (EpCAM). Bars: (A and E) 50 µm.
Figure 4.
Figure 4.
Chemotherapy-stimulated CAFs promote CIC growth and chemoresistance. The effect of CAFs on CICs was assessed by (A) co-culture and (B) conditioned media treatment. (A) 104 CICs were cultured with 2 × 10⁴ CAFs or normal fibroblasts treated with vehicle (DMSO) or chemotherapy for 10 d. Cellular viability was measured by Cell Titer-Glo assay. Data are presented as mean ± SD (n = 3); *, P < 0.05; **, P < 0.01; ***, P < 0.001. Student’s t test was used to assess the significance. The experiment was performed three times and representative data are shown. (B) 1.5 × 10⁵ CICs and CAFs were treated with vehicle (DMSO) or chemotherapy for 3 d. Conditioned media were collected and use to culture CICs for 10 d. Cellular viability was measured by Cell Titer-Glo assay. Data are presented as mean ± SD (n = 3); *, P < 0.1; ***, P < 0.001. Student’s t-test was used to assess the significance. The experiment was performed three times and representative data are shown. (C) The ability of the CAFs to affect the tumorigenic capacity of CICs from two different human specimens was tested in vivo. 3 × 10⁴ CAFs treated with vehicle (DMSO) or with chemotherapy for 3 d were subcutaneously co-implanted in immunocompromised mice with 3 × 10³ CICs. Tumors were monitored every day to evaluate the latency, harvested simultaneously, and volume measured to evaluate their development. **, P < 0.01; ***, P < 0.001. ANOVA, followed by Bonferroni’s post-hoc test was used to assess the significance. As indicated in the table, three to six mice were used in each group. The contribution of CAFs to post-therapy tumor growth was assessed by immunostaining of the xenografts for Ki-67 (D). Nuclei were counterstained with DAPI. Quantification was done by counting four high-power fields per condition. Data are presented as mean ± SD; *, P < 0.05; **, P < 0.01; ***, P < 0.001. Student’s t-test was used to assess the significance. Bars, 50 µm. (E) Xenografts derived from data in C were dissociated and analyzed for the expression of CD44 by FACS. Colorectal cancer cells conditioned by the presence of the CAFs were enriched in the CD44 compartment. (F) CICs sorted from xenografts in C were plated in 96-well plates in limiting dilution (50, 10, or 1 cells per well) and analyzed for sphere formation. Data are presented as mean ± SD (n = 20); **, P < 0.01; ***, P < 0.001. The likelihood ratio test was used to assess the significance. The experiment was performed once. (G) 3 × 10⁴ CICs and non-CICs from the same xenografts (C) were plated in 96-well plates and treated with chemotherapy. The effect of CAFs on CICs and non-CICs cells chemosensitivity was tested by evaluating cell viability (absolute number) measured by CellTiter-Glo assay. Data are mean ± SD (n = 3); **, P < 0.01; ***, P < 0.001; unlabeled, P > 0.05. Student’s t test was used to assess the significance. The experiment was performed twice and representative data are shown.
Figure 5.
Figure 5.
Chemotherapy stimulates CAF cytokine secretion. Cytokine secretion of CAFs treated with vehicle (DMSO) or with chemotherapy for 3 d was assessed using a 120 human cytokine antibody array from RayBio. (A–C) CAFs derived from three human surgical specimens and one commercial normal intestinal fibroblast line were interrogated for their cytokine and chemokine profile after chemotherapy treatment. (B) HGF was not significantly up-regulated in our cytotoxin conditions compared with vehicle. (C) The mean concentrations of DTK, IL-17A, and TGFβ were statistically significant in the three CAFs treated with chemotherapy compared with vehicle. (n = 1); P < 0.05. Student’s t test was used to assess the significance. The experiment was performed once. (D) Quantitative RT-PCR analysis of DTKs, IL-17A, and TGFβ was performed to validate the cytokine array results. Data are presented as mean ± SD (n = 3); *, P < 0.05. Student’s t test was used to assess the significance. The experiment was performed three times and representative data are shown. (E) Frozen sections of human colorectal tumors matched before and after cytotoxic treatment from two patients were co-stained for IL-17A and αSMA. Bars, 50 µm.
Figure 6.
Figure 6.
Cytotoxic treatment induces IL-17A in human specimens. (A) mRNA levels of IL-17A from untreated or treated patients (17 samples each group) were quantified by quantitative RT-PCR. Data are mean ± SD (n = 20); **, P < 0.01. Student’s t test was used to assess the significance. The experiment was performed three times and representative data are shown. (B and C) Paraffin-embedded sections of matched human colorectal tumors before and after cytotoxic treatment from four patients were stained for IL-17A. The percentage of the IL-17A–positive cells was quantified as a percentage of the total stromal cells (B); P < 0.05. Student’s t test was used to assess the significance. Two representative samples are shown (C). Bars: (C) 100 µm; (C, inset) 25 µm. (D) Protein levels of IL-17A from unmatched chemotherapy treated and untreated colorectal cancer specimens (20 patients in each group) were quantified using immunofluorescence staining. Frozen sections of human colorectal tumors were stained for IL-17A. Nuclei were counterstained with DAPI. Quantification was done by scanning three high-power fields per specimen using ImageJ software. Data are mean ratio of IL-17A area to DAPI area per patient. ***, P < 0.001. Student’s t test was used to assess the significance.
Figure 7.
Figure 7.
IL-17A can contribute to CICs maintenance through IL-17A receptor. (A) Autocrine expression of IL-17A was assessed using a 120 human cytokine antibody array from RayBio on 4 CICs treated with vehicle (DMSO) or with chemotherapy for 3 d. The mean concentration of IL-17A was statistically significant in the four CICs treated with chemotherapy compared to vehicle. (n = 1); P < 0.01. Student’s t test was used to assess the significance. The experiment was performed once. (B) The autocrine IL-17A production was examined by studying the effects of IL-17A blockade on the tumor-initiating capacity of CICs in the absence of CAFs. The effects were assessed in two different specimens by 10 d of co-culture. 104 CICs were treated with vehicle (DMSO), chemotherapy alone, or along with IL-17A blocking antibody (15 ng/ml). Number of viable cells was measured by Cell Titer-Glo assay. No statistically significant difference in viability was noted as a result of IL-17A blocking antibody. Data are presented as mean ± SD (n = 3); unlabeled, P > 0.05. Student’s t test was used to assess the significance. The experiment was performed twice, and representative data are shown. (C) IL-17RA was expressed in CICs as demonstrated by immunofluorescence staining. Nuclei were counterstained with DAPI. Bar, 10 µm. (D) Confirmation of IL-17RA expression was assessed in CICs by FACS analysis of single cells from three freshly dissociated xenografts co-stained for FITC-CD44 and APC-IL17RA.
Figure 8.
Figure 8.
Exogenous IL-17A promotes colorectal sphere maintenance, proliferation, and migration. (A) CICs and non-CICs from two independent patient specimens were plated in limiting dilution (50, 10, or 1 cell[s] per well) in 96-well plates and tested for the effect of exogenous IL-17A (100 ng/ml). The presence of spheres was evaluated after 14 d. Data are mean ± SD (n = 20); ***, P < 0.05. Student’s t test was used to assess the significance. The experiment was performed three times and representative data are shown. (B) The tumorspheres area from one specimen (064; sphere frequency/sphere footprint using ImageJ software) was evaluated after 14 d. The mean area of spheres treated with IL-17A was 4,438.5 ± 960 µm2 compared to 2,458.6 ± 481 µm2 in the untreated group. P = 0.073. Student’s t test was used to assess the significance. The experiment was performed once. (C and D) Cells were sorted for CD44high/+ and CD44low/− and treated with IL-17A (100 ng/µl) for 12 h. (D) Cells were stained for β-catenin with DAPI nuclear background. Bar, 25 µm. (C) Beta-catenin localization was quantified. The experiment was performed once. (E–G) CICs cell viability, apoptosis, and proliferation of three independent specimens were assessed by (E) CellTiter-Glo, (F) caspase 3/7 activation, and (G) thymidine incorporation after stimulation with vehicle and exogenous IL-17A (100 ng/ml). Non-CICs from three independent specimens were plated and tested for the effect of exogenous IL-17A (H–J). Cell viability, apoptosis, and proliferation were assessed by CellTiter-Glo (H), caspase 3/7 activation (I), and thymidine incorporation (J) after stimulation with vehicle and exogenous IL-17A (100 ng/ml). Data are mean ± SD (n = 3); *, P < 0.05; **, P < 0.01; ***, P < 0.001; unlabeled, P > 0.05. Student’s t test was used to assess the significance. The experiment was performed three times and representative data are shown. (K) Label retention of CICs from three independent patient specimens was evaluated by the staining with PKH-26-PE dye and the FACS analysis at day 0 (control) and after 8 d of stimulation with the vehicle and IL-17A. The experiment was performed once. (L) Migration of CICs from a human sample stimulated with exogenous IL-17A or a vehicle was evaluated by the scratch assay. The area of the scratch was monitored by time-lapse microscopy for 64 h. The experiment was performed twice and representative data are shown.
Figure 9.
Figure 9.
IL-17A/IL-17RA signaling regulates colorectal CIC growth and self-renewal. (A) Quantitative RT-PCR analysis of IL-17A in CICs over-expressing IL-17A. Data are mean ± SD (n = 3); ***, P < 0.001. Student’s t test was used to assess the significance. The experiment was performed three times and representative data are shown. (B) Quantitative RT-PCR analysis of five different shRNAs for IL-17RA in CICs. Data are presented as means ± SD (n = 3); ***, P < 0.001. Student’s t test was used to assess the significance. The experiment was performed three times and representative data are shown. (C) Effects of IL-17RA knockdown with two different shRNAs (shIL-17RA1 or shIL-17RA2) or IL-17A overexpression with IL-17A transduction on tumorsphere formation. 064 and 199 and 656 CICs transduced with two different shRNAs or shControl and with IL-17A vector or empty vector were plated in replicates in stem cell media in a limiting dilution assay, and were then analyzed for the presence of spheres after 14 d. Data are mean ± SD (n = 20); *, P < 0.05; **, P < 0.01; ***, P < 0.001. The likelihood ratio test was used to assess the significance. The experiment was performed two times and representative data are shown. (D, E) The dependence of CICs on IL-17A was evaluated in vivo. 104 CICs and 3 × 10⁴ CAFs were injected into mice. When tumors were established to approximately 0.3 cm3 in volume, treatment was initiated. Four arms were included: isotype control (2 mg/kg antibody five times a week for two weeks and then once a week for two weeks), chemotherapy alone (Oxaliplatin: 0.25 mg/kg once a week for 4 wk; 5-FU: 15 mg/kg five times a week for 2 wk), IL-17A blocking antibody alone (2 mg/kg five times a week for 2 wk and then once a week for 2 wk) or a combination of the IL-17 antibody and chemotherapy (four mice per arm). Mice were weighed and the tumor volume was measured every other day for 30 d. Mice were sacrificed and tumors were collected. (D) Representative images of treated tumors and (E) relative tumor volume. Bar, 1 cm. Data are presented as mean ± SD (n = 4); *, P < 0.1; **, P < 0.05; ***, P < 0.001. ANOVA, followed by Bonferroni’s post-hoc test was used to assess the significance.
Figure 10.
Figure 10.
Exogenous IL-17A promotes chemoresistance through the NF-κB pathway. (A) Chemosensitivity of 3 × 10³ CICs from the three independent human samples stimulated with exogenous IL-17A and treated with chemotherapy was evaluated by CellTiter-Glo assay. Data are mean ± SD (n = 3); *, P < 0.05; **, P < 0.01. Student’s t test was used to assess the significance. The experiment was performed three times and representative data are shown. (B) The effect of the media conditioned by CAFs on CICs from two different specimens was assessed by ten-day co-culture. 104 CICs were cultured with 2 × 10⁴ CAFs treated with vehicle (DMSO), chemotherapy alone or along with IL-17A blocking antibody (15 ng/ml), or an isotype IgG control. Cell growth was measured by CellTiter-Glo assay. Data are mean ± SD (n = 3); **, P < 0.01; ***, P < 0.001. Student’s t-test was used to assess the significance. The experiment was performed three times and representative data are shown. (C) CICs gene profile from three independent human samples stimulated with vehicle or exogenous IL-17A was performed on an Illumina expression array. Signal data were filtered to include only genes that were seen to have changes in at least two of the three matched pairs and were subjected to hierarchical clustering. Signal ratio > 1.5 and P < 0.05. (D) Network analysis of the most significant genes up-regulated in CICs stimulated with IL-17A versus vehicle was generated using IPA (Ingenuity Systems). (E) The alteration of the NF-κB pathway and its downstream target ERK1/2 was assessed at the protein level through the analysis of the levels of the phosphorylation status of NF-κB p65 (RelA) and p42-44-ERK1/2 in one sample treated with vehicle or with IL-17A with and without the IL-17A blocking antibody for 12 h.

References

    1. Acharyya S., Oskarsson T., Vanharanta S., Malladi S., Kim J., Morris P.G., Manova-Todorova K., Leversha M., Hogg N., Seshan V.E., et al. 2012. A CXCL1 paracrine network links cancer chemoresistance and metastasis. Cell. 150:165–178 10.1016/j.cell.2012.04.042 - DOI - PMC - PubMed
    1. Allinen M., Beroukhim R., Cai L., Brennan C., Lahti-Domenici J., Huang H., Porter D., Hu M., Chin L., Richardson A., et al. 2004. Molecular characterization of the tumor microenvironment in breast cancer. Cancer Cell. 6:17–32 10.1016/j.ccr.2004.06.010 - DOI - PubMed
    1. American Cancer Society. 2011. http://www.cancer.org/research/cancerfactsstatistics/colorectal-cancer-f... American Cancer Society. Colorectal Cancer Facts & Figures 2011-2013.
    1. Arnold D., Seufferlein T. 2010. Targeted treatments in colorectal cancer: state of the art and future perspectives. Gut. 59:838–858 10.1136/gut.2009.196006 - DOI - PubMed
    1. Barcellos-Hoff M.H., Ravani S.A. 2000. Irradiated mammary gland stroma promotes the expression of tumorigenic potential by unirradiated epithelial cells. Cancer Res. 60:1254–1260 - PubMed

Publication types