. 2013 Dec 16;210(13):2921-37.
doi: 10.1084/jem.20130699. Epub 2013 Dec 9.

MHC class II-dependent B cell APC function is required for induction of CNS autoimmunity independent of myelin-specific antibodies

Affiliations

MHC class II-dependent B cell APC function is required for induction of CNS autoimmunity independent of myelin-specific antibodies

Nicolas Molnarfi et al. J Exp Med. .

Abstract

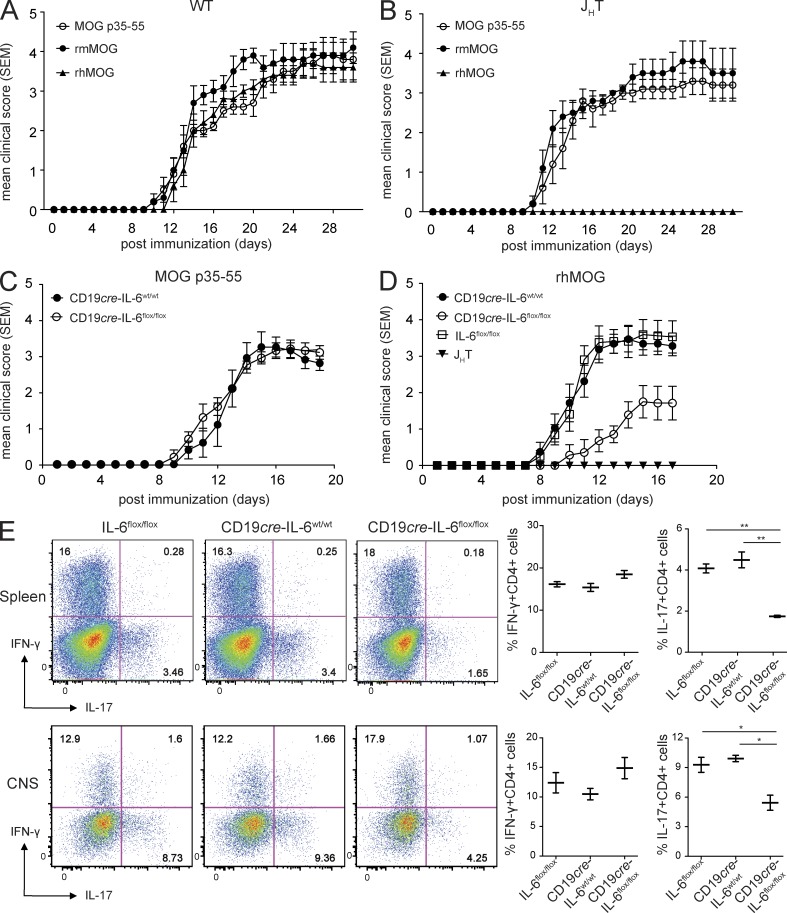
Whether B cells serve as antigen-presenting cells (APCs) for activation of pathogenic T cells in the multiple sclerosis model experimental autoimmune encephalomyelitis (EAE) is unclear. To evaluate their role as APCs, we engineered mice selectively deficient in MHC II on B cells (B-MHC II(-/-)), and to distinguish this function from antibody production, we created transgenic (Tg) mice that express the myelin oligodendrocyte glycoprotein (MOG)-specific B cell receptor (BCR; IgH(MOG-mem)) but cannot secrete antibodies. B-MHC II(-/-) mice were resistant to EAE induced by recombinant human MOG (rhMOG), a T cell- and B cell-dependent autoantigen, and exhibited diminished Th1 and Th17 responses, suggesting a role for B cell APC function. In comparison, selective B cell IL-6 deficiency reduced EAE susceptibility and Th17 responses alone. Administration of MOG-specific antibodies only partially restored EAE susceptibility in B-MHC II(-/-) mice. In the absence of antibodies, IgH(MOG-mem) mice, but not mice expressing a BCR of irrelevant specificity, were fully susceptible to acute rhMOG-induced EAE, also demonstrating the importance of BCR specificity. Spontaneous opticospinal EAE and meningeal follicle-like structures were observed in IgH(MOG-mem) mice crossed with MOG-specific TCR Tg mice. Thus, B cells provide a critical cellular function in pathogenesis of central nervous system autoimmunity independent of their humoral involvement, findings which may be relevant to B cell-targeted therapies.


Figures

Figure 1.
Figure 1.
B cell IL-6 production was required for induction of EAE by rhMOG. (A and B) EAE was induced in C57BL/6J WT (A) or B cell–deficient JHT mice (B) by injecting MOG p35–55 (50 µg s.c.), rmMOG (100 µg s.c.), or rhMOG (100 µg s.c.) emulsified in CFA along with heat-killed Mtb (200 µg) and B. pertussis toxin (200 ng i.v.) on days 0 and 2, and survival was monitored. Results shown are representative of five independent experiments of n = 5 mice/group. (C and D) EAE was induced in mice harboring IL-6–deficient B cells (CD19cre-IL-6flox/flox) or WT B cells (CD19cre–IL-6wt/wt or IL-6flox/flox) or mice lacking B cells (JHT) with MOG p35–55 or rhMOG as in A, and survival was monitored. (E) Lymphocytes were isolated from the spleen and CNS of the indicated mouse strains after disease onset and stimulated with PMA + ionomycin for 6 h, and IL-17 and IFN-γ production was assessed by flow cytometry. Flow cytometry plots from a representative mouse are shown (left), and graphs (right) show quantitative data from five to six mice/group. Results are representative of two independent experiments (n = 5 mice/group [C]; n = 7–8 mice/group [D]). For all EAE experiments, mean disease score ± SEM is shown. For all experiments: *, P < 0.05; **, P < 0.01 by Mann–Whitney U test.
Figure 2.
Figure 2.
B cell MHC II expression promoted proinflammatory T cell cytokine production in rhMOG-induced EAE. Mixed BM chimera mice containing MHC II–deficient B cells were generated by reconstituting C57BL/6J (WT) mice with mixed BM from JHT + MHC II–deficient mice (MHC II−/−) mice. (A) B and T cell reconstitution of secondary lymphoid organs was evaluated by FACS analysis of spleen cells 6–8 wk after BM transplantation. Panels show frequencies of MHC II–expressing cells (left) and CD4+ and CD8+ cells (right) from B–MHC II−/− and B–MHC II+/+ chimeras. FACS plots and histograms are representative of five independent experiments (n = 3 mice/group). (B) EAE was induced in B–MHC II+/+ or B–MHC II−/− chimeras by injecting MOG p35–55 (50 µg s.c.), rmMOG (100 µg s.c.), or rhMOG (100 µg s.c.) emulsified in CFA along with heat-killed Mtb (200 µg) and B. pertussis toxin (200 ng i.v.) on days 0 and 2. Survival was monitored daily. Results shown are representative of five independent experiments of n = 5 mice/group. Mean disease score ± SEM is shown. (C) Analyses were performed 14 d after immunization. Spleen cells of B–MHC II+/+ and B–MHC II−/− mice were cultured with the indicated concentrations of MOG p35–55 or rhMOG for 48 h, and T cell proliferation was measured 18 h later by incorporation of [3H]thymidine (cpm; left). Data are presented as means of triplicate values ± SD and are representative of at least three independent experiments. Single-cell suspensions from spleens and CNS of the indicated mice were stimulated with PMA + ionomycin for 6 h, and frequencies of IL-17+ CD4+ Th17 and IFN-γ+ CD4+ Th1 cells were assessed by flow cytometry. Representative FACS plots and quantification (mean ± SD) of n = 5 mice/group are shown (middle and right). For all experiments: **, P < 0.01; ***, P < 0.001 by Mann–Whitney U test.
Figure 3.
Figure 3.
MOG-specific antibodies partially restored susceptibility to rhMOG-induced EAE in B–MHC II−/− mice. (A) Sera were obtained from B–MHC II−/− and B–MHC II+/+ mice on day 14 after immunization with MOG p35–55, rmMOG, or rhMOG. Total anti-MOG IgG levels (µg/ml) determined by ELISA (1:1,000 dilution) are shown (n = 5 mice/group). Horizontal bars indicate mean. (B) Numbers indicate the percentages of splenic Bcl-6+CXCR5+ Tfh cells (pregated on CD4+CD44+ICOS+PD-1+ T cells) evaluated by intracellular FACS staining 14 d after EAE induction with rhMOG. (C) B–MHC II−/− and B–MHC II+/+ mice were immunized with rhMOG (n = 4–6/mice/group), and clinical scores were monitored at the indicated days after immunization. When B–MHC II+/+ mice showed EAE signs (score ∼2.0), B–MHC II−/− mice received i.p. injections of 150 µg of either anti-MOG 8-18C5 mAb (closed triangles) or an equal amount of anti-OVA 1B7.11 mAb (closed circles) three times at 48-h intervals. Results are representative of two independent experiments. In one experiment, sera from IgHMOG-ki mice and non-Tg littermate mice were used in lieu of 8-18C5 and 1B7.11 mAbs. (D) BM chimera mice with MHC II deficiency restricted to MOG-specific B cells from IgHMOG-ki mice were generated by reconstituting C57BL/6J mice with mixed BM from JHT + IgHMOG-ki mice or JHT + IgHMOG-ki mice backcrossed onto the MHC II−/− background. Chimera mice with MOG-specific MHC II–deficient B cells (IgHMOG-ki/MHC II−/−) or MOG-specific MHC II–competent B cells (IgHMOG-ki/MHC II+/+) were immunized with MOG p35–55, rmMOG, or rhMOG (n = 5 mice/group), and clinical scores were monitored at the indicated days after immunization. Data shown are representative of four independent experiments. Mean disease score ± SEM is shown for all experiments displayed. For all experiments: **, P < 0.01 by Mann–Whitney U test.
Figure 4.
Figure 4.
Generation and characterization of IgHMOG-mem Tg mice. (A) Schematic representation of the construct used to generate IgHMOG-mem Tg mice. The DNA directing secretion (µs) and the transcription termination site (pAs) have been deleted (Chan et al., 1999). VH8.18 is the rearranged heavy chain V(D)J gene segment from the hybridoma 8-18C5 (Linnington et al., 1984), which was used to generate IgHMOG-ki mice (Litzenburger et al., 1998). 8.18-C5 is known to recognize rhMOG1–125 (Menge et al., 2007). E indicates the heavy chain intronic enhancer. Much of the switch region was deleted; a small segment of the residual switch region is indicated. (B) Spleen cells of WT, IgHMOG-ki, JHT, and IgHMOG-mem/JHT mice were analyzed for surface expression of IgMa and binding of rhMOG by flow cytometry (gated on B220+ cells). Percentages of rhMOG-binding or -nonbinding IgMa-positive B cells are indicated. (C) Spleen cells from WT, JHT, IgHMOG-ki, and IgHMOG-mem/JHT mice were analyzed by FACS for CD19 and MHC II expression. Data shown in B and C are representative of five independent experiments. (D) Sera from individual naive and immunized (MOG p35–55, rhMOG) WT, JHT, IgHMOG-ki, and IgHMOG-mem/JHT mice were obtained on day 14 after immunization, and serum Ig levels were calculated. Total and MOG-specific IgM and IgG titers are expressed as mean OD values ± SD from one of three representative experiments (performed in triplicate) from 1:2 serial dilutions. (E) Quantification of MOG-specific IgM and IgG (n = 6 mice/group) determined by ELISA are expressed as means of OD values or µg/ml ± SD of one of three representative experiments (performed in triplicate), respectively, and are shown on the logarithmic y axis.
Figure 5.
Figure 5.
Myelin-specific BCR contributed to B cell APC function and susceptibility to CNS autoimmune disease independent of antibodies. (A) EAE was induced in WT, IgHMOG-mem/JHT, or IgHMOG-ki mice by injecting MOG p35–55 (50 µg s.c.), rmMOG (100 µg s.c.), or rhMOG (100 µg s.c.) emulsified in CFA along with 200 µg heat-killed Mtb and B. pertussis toxin (200 ng i.v.) on days 0 and 2, and survival was monitored. Composite disease course of three experiments is shown (n = 3–6 mice per group/experiment). Mean disease score ± SEM is shown. (B) Spinal cord tissues from mice immunized with rhMOG were collected on day 28, fixed in neutral-buffered formalin, processed routinely, and embedded in paraffin (a, b: WT; c, d: IgHMOG-ki; e, f: IgHMOG-mem/JHT). 5-µm sections were processed and stained with H&E (for assessment of inflammation) and LFB (for demyelination). Meningeal and parenchymal inflammatory/demyelinating foci are indicated by arrows. Bars: (a, c, and e) 200 µm; (b, d, and f) 50 µm. (C) Splenic B cells (B220+) from IgHMOG-mem/JHT and IgHB1-8-mem/JHT mice were stained for cell surface IgMa, and capability to bind MOG protein and then analyzed by flow cytometry. (D) Purified CD4+ T cells from TCRMOG mice were stained with CFSE and cultured with purified B cells from IgHMOG-mem/JHT or IgHB1-8-mem/JHT mice in the presence of various concentrations of MOG p35–55 or rhMOG. T cell proliferation (CFSE dilution) was analyzed by FACS. Data are presented as means of triplicate values ± SD and are representative of two independent experiments. (E) EAE was induced in IgHMOG-mem/JHT or IgHB1-8-mem/JHT mice (n = 5 mice/group) as in A. Survival was monitored daily. Clinical EAE scores are shown as mean ± SEM. EAE data shown are representative of five independent experiments. (F) Phenotype of splenic T cells was evaluated by intracellular FACS staining for IL-17A and IFN-γ (gated on CD4+ T cells) 14 d after disease induction. Representative FACS plots (left) and quantification (mean ± SD; right; n = 5 mice/group) are shown. For all experiments: *, P < 0.05; **, P < 0.01 by Mann–Whitney U test.
Figure 6.
Figure 6.
Meningeal B cell follicle–like aggregates were observed in IgHMOG-mem/JHT × TCRMOG/JHT mice that developed spontaneous OSE. (A–E) Spinal cords of IgHMOG-mem/JHT × TCRMOG/JHT mice that developed spontaneous OSE (A and B). (F–J) Spinal cord of a clinically normal IgHMOG-mem/JHT × TCRMOG/JHT mouse. (C and H) Immunostaining for B cells (CD45R). (C) Arrows indicate meningeal foci that contained B cells that infiltrated the parenchyma. (D and I) Immunostaining for T cells (CD3). (D) Arrows and inset show meningeal and parenchymal T cells. (E and J) Reticulin stain. (A, B, F, G) LFB/H&E; (C and H) H&E counterstain; (D and I) hematoxylin counterstain; (E and J) reticulin stain. Histological analysis of IgHMOG-mem × 2D2/JHT mice with and without spontaneous OSE is representative of three independent experiments with at least three mice per group. The entire CNS was sampled in a single slide for each mouse. Bars: (A and F) 200 µm; (B and G–J) 50 µm; (C–E) 70 µm; (D, inset [same bar as in C]) 35 µm.

References

    1. Amor S., Groome N., Linington C., Morris M.M., Dornmair K., Gardinier M.V., Matthieu J.M., Baker D. 1994. Identification of epitopes of myelin oligodendrocyte glycoprotein for the induction of experimental allergic encephalomyelitis in SJL and Biozzi AB/H mice. J. Immunol. 153:4349–4356 - PubMed
    1. Bar-Or A., Calabresi P.A., Arnold D., Markowitz C., Shafer S., Kasper L.H., Waubant E., Gazda S., Fox R.J., Panzara M., et al. 2008. Rituximab in relapsing-remitting multiple sclerosis: a 72-week, open-label, phase I trial. Ann. Neurol. 63:395–400 [published erratum appears in Ann. Neurol. 2008. 63:803] 10.1002/ana.21363 - DOI - PubMed
    1. Bar-Or A., Fawaz L., Fan B., Darlington P.J., Rieger A., Ghorayeb C., Calabresi P.A., Waubant E., Hauser S.L., Zhang J., Smith C.H. 2010. Abnormal B-cell cytokine responses a trigger of T-cell-mediated disease in MS? Ann. Neurol. 67:452–461 10.1002/ana.21939 - DOI - PubMed
    1. Barr T.A., Shen P., Brown S., Lampropoulou V., Roch T., Lawrie S., Fan B., O’Connor R.A., Anderton S.M., Bar-Or A., et al. 2012. B cell depletion therapy ameliorates autoimmune disease through ablation of IL-6–producing B cells. J. Exp. Med. 209:1001–1010 10.1084/jem.20111675 - DOI - PMC - PubMed
    1. Basso A.S., Frenkel D., Quintana F.J., Costa-Pinto F.A., Petrovic-Stojkovic S., Puckett L., Monsonego A., Bar-Shir A., Engel Y., Gozin M., et al. 2008. Reversal of axonal loss and disability in a mouse model of progressive multiple sclerosis. J. Clin. Invest. 118:1532–1543 10.1172/JCI33464 - DOI - PMC - PubMed

Publication types

MeSH terms