. 2013 Dec 16;210(13):2939-50.
doi: 10.1084/jem.20130351. Epub 2013 Dec 9.

A role for IL-25 and IL-33-driven type-2 innate lymphoid cells in atopic dermatitis

Affiliations

A role for IL-25 and IL-33-driven type-2 innate lymphoid cells in atopic dermatitis

Maryam Salimi et al. J Exp Med. .

Abstract

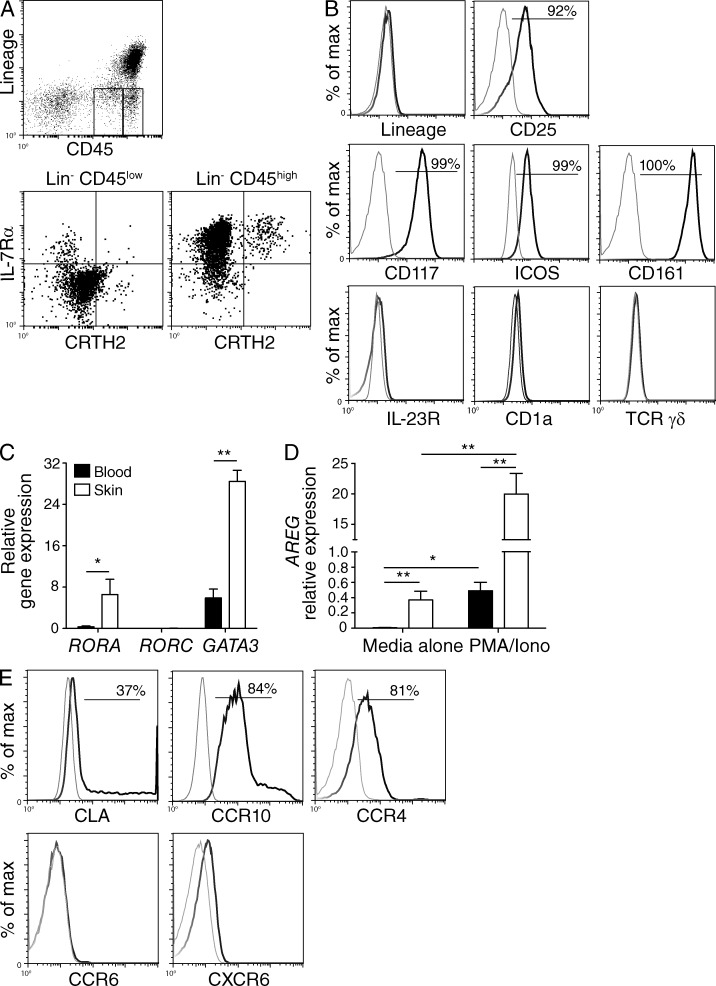
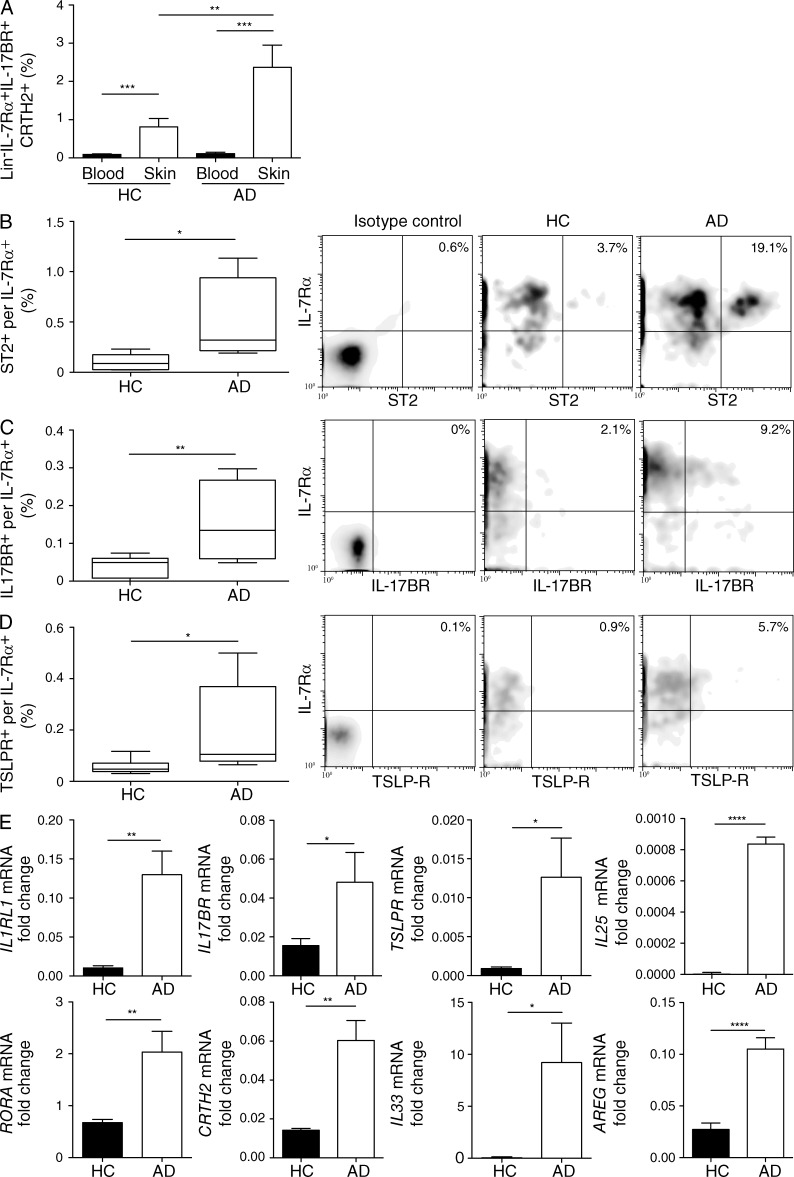
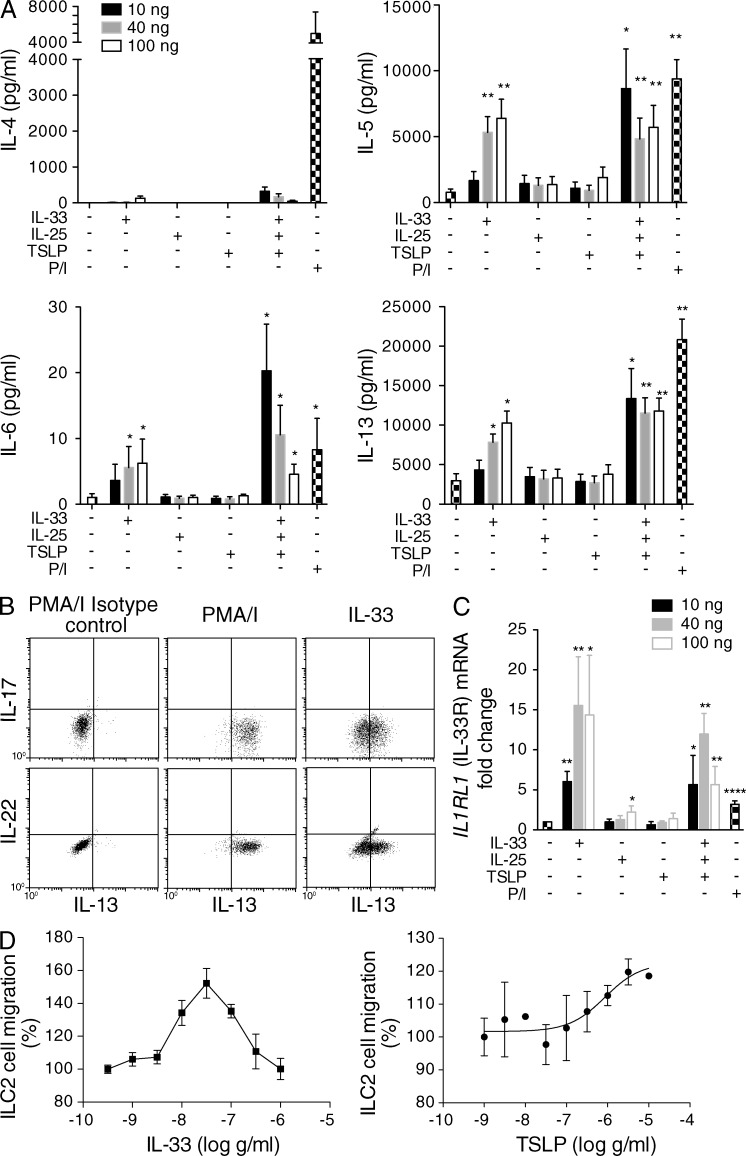
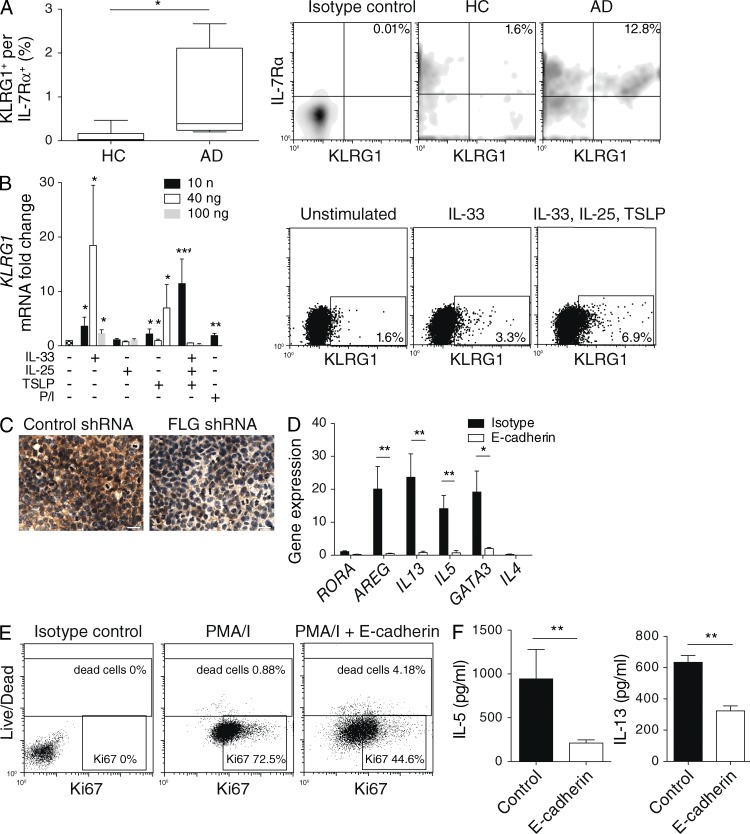
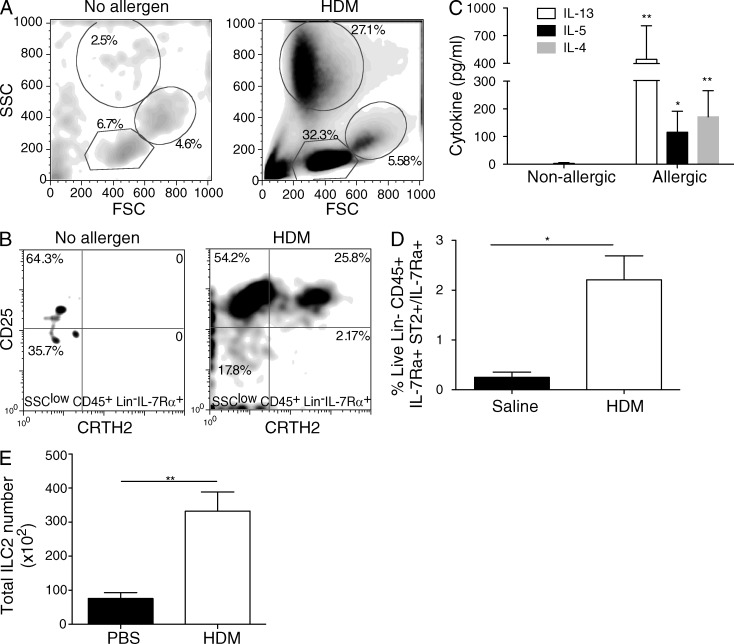
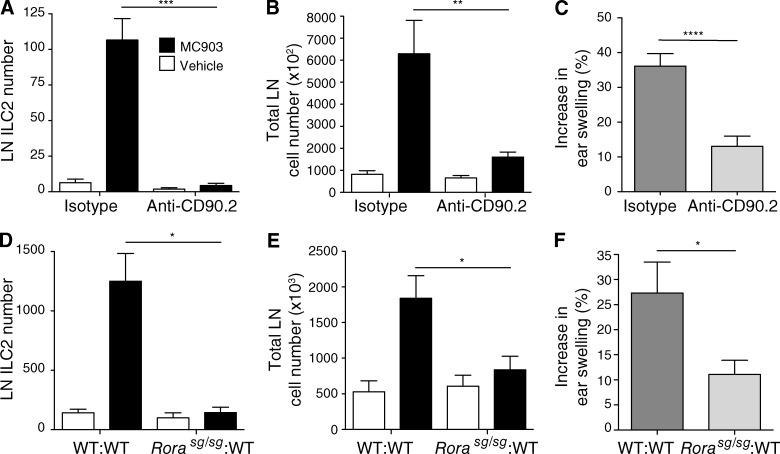
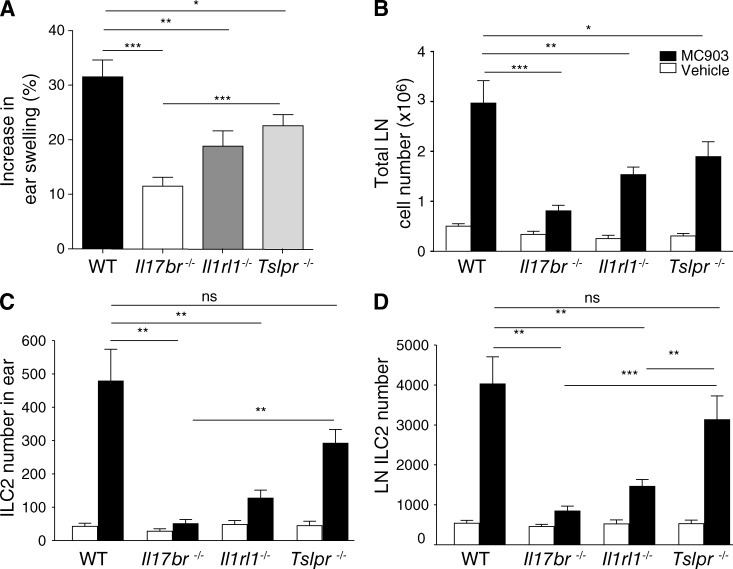
Type 2 innate lymphoid cells (ILC2s, nuocytes, NHC) require RORA and GATA3 for their development. We show that human ILC2s express skin homing receptors and infiltrate the skin after allergen challenge, where they produce the type 2 cytokines IL-5 and IL-13. Skin-derived ILC2s express the IL-33 receptor ST2, which is up-regulated during activation, and are enriched in lesional skin biopsies from atopic patients. Signaling via IL-33 induces type 2 cytokine and amphiregulin expression, and increases ILC2 migration. Furthermore, we demonstrate that E-cadherin ligation on human ILC2 dramatically inhibits IL-5 and IL-13 production. Interestingly, down-regulation of E-cadherin is characteristic of filaggrin insufficiency, a cardinal feature of atopic dermatitis (AD). ILC2 may contribute to increases in type 2 cytokine production in the absence of the suppressive E-cadherin ligation through this novel mechanism of barrier sensing. Using Rag1(-/-) and RORα-deficient mice, we confirm that ILC2s are present in mouse skin and promote AD-like inflammation. IL-25 and IL-33 are the predominant ILC2-inducing cytokines in this model. The presence of ILC2s in skin, and their production of type 2 cytokines in response to IL-33, identifies a role for ILC2s in the pathogenesis of cutaneous atopic disease.


Figures

Figure 1.
Figure 1.
ILC2s are resident in human skin. (A) Freshly isolated leukocytes from the human skin were stained with the combination of ILC surface markers, including lineage markers (CD3, CD4, CD8, CD14, CD19, CD56, CD11c, CD11b, FcεRI, TCR-γδ, TCR-αβ, and CD123), CD45, and IL-7Rα. Flow cytometric analysis of IL-7Rα and CRTH2 expression on lineage-negative CD45hi and lineage-negative CD45low cells (n = 15) is shown. (B) Expression of the indicated cell surface markers on LinCD45hiIL-7Rα+CRTH2+ cultured ILC2 from the skin (n = 3). Black plots show the relevant marker; grey show the isotype control. Bars show the percentage of cells expressing the relevant marker. (C and D) CD45hiIL-7Rα+CRTH2+ cells were sorted and cultured from blood and skin, and RORA (n = 8, where n is number of donors), RORC (n = 5), GATA3 (n = 3; C), and AREG (n = 3; D) gene expression relative to GAPDH was measured by RT-PCR. (E) LinCD45hiIL-7Rα+CRTH2+ ILC2s were isolated from human skin and expression of the indicated homing receptors was analyzed by flow cytometry. Black plots show the relevant marker; grey show the isotype control. Bars show the percentage of cells expressing the relevant marker. *, P < 0.05; **, P < 0.01; ***, P < 0.001, unpaired Student’s t test (mean and SEM in C and D).
Figure 2.
Figure 2.
ILC2s are present at higher frequency and with a modified phenotype in the skin of AD patients. (A) Frequency of ILC2 (as a percentage of IL-7Rα+ cells) in the blood and skin of healthy controls (HCs; n = 15) or in lesional biopsies of the acutely affected skin of patients with AD (n = 8) was measured by flow cytometry. (B–D) ILC2s (LinCD45highIL-7Rα+) were isolated from the skin of patients with AD and healthy controls, and expression of ST2 (B), IL-17BR (C), and TSLPR (D) was analyzed by flow cytometry. Representative flow plots are shown on the right. Numbers indicate percentages of cells within the top right quadrant of gated populations. B: patients and controls (n = 7); C: patients (n = 5), controls (n = 8); D: patients (n = 6), controls (n = 7). (E) Acute lesional skin biopsies were taken from patients with AD (n = 8) and healthy controls (n = 6), and expression of IL1RL1 (IL-33R), IL-33, IL17BR, IL-25, CRTH2, TSLPR, AREG, and RORA was measured by RT-PCR relative to GAPDH. *, P < 0.05; **, P < 0.01; ***, P < 0.001, unpaired Student’s t test (mean and SEM in A and E; min and max in B–D).
Figure 3.
Figure 3.
Human skin ILC2s stimulated with IL-33 produce high levels of type-2 cytokines. (A) Cultured skin ILC2s were stimulated with PMA/ionomycin or IL-25, IL-33, and TSLP alone or in the indicated combinations and concentrations. Supernatant was collected after 24 h. Levels of IL-4, IL-5, IL-6, and IL-13 were measured by multiplex cytokine analysis. Statistical comparisons are compared with the negative (no cytokine) control. (B) Skin-derived ILC2s were stimulated with PMA/ionomycin or IL-33, and levels of IL-13, IL-17A, and IL-22 expression were measured using intracellular cytokine staining. Data are representative of four independent experiments on cultured cells. (C) ILC2s were stimulated for 16 h with IL-25, IL-33, or TSLP in isolation or combination at the indicated combinations. Expression of IL1RL1 (IL-33R) was measured by RT-PCR. Data are representative of three independent experiments. Statistical comparisons are compared with the negative (no cytokine) control. (D) Chemotaxis of skin-derived ILC2s toward indicated concentrations of IL-33 and TSLP, relative to baseline, was measured after 1 h using transmigration across a 5 µM pore membrane. Data are representative of three independent experiments (n = 3). *, P < 0.05; **, P < 0.01; ***, P < 0.001, unpaired Student’s t test (mean and SEM in A, C, and D).
Figure 4.
Figure 4.
E-cadherin can regulate type 2 cytokine production by human skin ILC2. (A) ILC2s were isolated from the skin of patients with AD (n = 4) and healthy controls (n = 8), and expression of KLRG1 was analyzed by flow cytometry. Representative flow plots are shown on the right. Numbers indicate percentages of cells within the top right quadrant of gated populations. (B) ILC2s were stimulated with IL-33, IL-25, and TSLP, and levels of KLRG1 gene and protein expression were measured by RT-PCR and flow cytometry. Statistical comparisons are compared with the negative (no cytokine) control. Numbers on the flow cytometry plots indicate the proportion of gated cells that express KLRG1 (n = 4). (C) E-cadherin expression by keratinocytes after control (left) or filaggrin (right) shRNA knockdown (bars, 50 µm; n = 3). (D) Expression of RORA, AREG, IL-13, IL-5, GATA3, and IL-4 mRNA relative to GAPDH by ILC2 activated using PMA/I before and after culture with rhE-cadherin (recombinant human E-cadherin) for 24 h (n = 7), as measured by PCR. (E) Ki67 and live/dead staining of ILC2 incubated with PMA/ionomycin in the presence or absence of E-cadherin. Data are representative of three independent experiments. Numbers indicate percentages of cells within the indicated gates. (F) IL-5 and IL-13 concentration in supernatant from ILC2 activated with IL-25 and IL-33 and incubated in the presence or absence of rhE-cadherin (n = 3). *, P < 0.05; **, P < 0.01; ***, P < 0.001, unpaired Student’s t test (min and max in A; mean and SEM in B, D, and F).
Figure 5.
Figure 5.
ILC2s localize to the skin during an allergic response in vivo. An intraepidermal injection of HDM was given to an HDM-allergic individual, and 2 h later suction blisters were formed over the site of injection or on an uninjected area of skin. Fluid was extracted 26 h later, and flow cytometry was performed to analyze total cell (A) and ILC2 (B) accumulation expressed as percentage of cells within the plots (shown as numbers within each gated region). (C) Levels of IL-13, IL-5, and IL-4 within the blister fluid isolated from allergic (n = 5) and nonallergic donors (n = 3) were quantified 26 h after HDM administration into the skin. Statistical comparisons are made between cytokine levels from allergic and nonallergic donors. (D) Infiltration of ST2-expressing ILC2 into human skin 26 h after HDM or saline challenge (n = 4). (E) ILC2 (defined as LinCD45+IL-7Rα+ICOS+c-Kit+ cells) infiltration into the skin of C57BL/6 strain mice after subcutaneous administration of HDM allergen or PBS was measured using flow cytometry (n = 3–4). Data are representative of two independent experiments. *, P < 0.05; **, P < 0.01, unpaired Student’s t test (mean and SEM in C–E).
Figure 6.
Figure 6.
Depletion of ILC2 significantly reduces ear swelling and inflammation in mice. MC903 or vehicle was applied topically for 4 d to the ear of Rag1−/− mice with or without prior treatment of anti-CD90.2 antibody or isotype control. In A, B, D, and E, vehicle is shown as open bars and MC903 is shown as filled bars. Accumulation of LN ILC2 (A); total LN cell number (B); and increase (percent) in ear thickness after MC903 application (C). After 4 d of topical application of MC903 or vehicle to the ear of wild-type or Rorasg/sg bone marrow chimera mice, the accumulation of LN ILC2 (D), total LN cell number (E), and increase (percent) in ear thickness (F) were documented. n = 5–6 mice per group. Data are representative of two independent experiments. *, P < 0.05; **, P < 0.01; ***, P < 0.001, unpaired Student’s t test with Welch’s correction (mean and SEM).
Figure 7.
Figure 7.
Roles of IL-25, IL-33, and TSLP in skin swelling and inflammation and ILC2 infiltration in BALB/c mice strains. MC903 or vehicle was applied topically for 4 d to the ear of wild-type or knockout mice as indicated. Increase (percent) in ear thickness (A), total LN cell number (LN; B), number of ILC2 in the ear sample (C), and number of ILC2 in the LN (D) were documented. n = 9 –10 per group. Data are representative of two independent experiments. *, P < 0.05; **, P < 0.01; ***, P < 0.001, unpaired Student’s t test with Welch’s correction (mean and SEM).

References

    1. Averdam A., Petersen B., Rosner C., Neff J., Roos C., Eberle M., Aujard F., Münch C., Schempp W., Carrington M., et al. 2009. A novel system of polymorphic and diverse NK cell receptors in primates. PLoS Genet. 5:e1000688 10.1371/journal.pgen.1000688 - DOI - PMC - PubMed
    1. Barlow J.L., Bellosi A., Hardman C.S., Drynan L.F., Wong S.H., Cruickshank J.P., McKenzie A.N. 2012. Innate IL-13-producing nuocytes arise during allergic lung inflammation and contribute to airways hyperreactivity. J. Allergy Clin. Immunol. 129:191–198: e1–e4 10.1016/j.jaci.2011.09.041 - DOI - PubMed
    1. Cherry W.B., Yoon J., Bartemes K.R., Iijima K., Kita H. 2008. A novel IL-1 family cytokine, IL-33, potently activates human eosinophils. J. Allergy Clin. Immunol. 121:1484–1490 10.1016/j.jaci.2008.04.005 - DOI - PMC - PubMed
    1. Crack L.R., Chan H.W., McPherson T., Ogg G.S. 2012. Identification of an immunodominant region of the major house dust mite allergen Der p 2 presented by common human leucocyte antigen alleles. Clin. Exp. Dermatol. 37:266–276 10.1111/j.1365-2230.2011.04227.x - DOI - PubMed
    1. De Benedetto A., Agnihothri R., McGirt L.Y., Bankova L.G., Beck L.A. 2009. Atopic dermatitis: a disease caused by innate immune defects? J. Invest. Dermatol. 129:14–30 10.1038/jid.2008.259 - DOI - PubMed

Publication types

MeSH terms