. 2014 Feb;5(1):85-101.
doi: 10.1007/s13244-013-0298-9. Epub 2013 Dec 10.

Radiolucent lesions of the mandible: a pattern-based approach to diagnosis

Affiliations

Radiolucent lesions of the mandible: a pattern-based approach to diagnosis

Laurène Avril et al. Insights Imaging. 2014 Feb.

Abstract

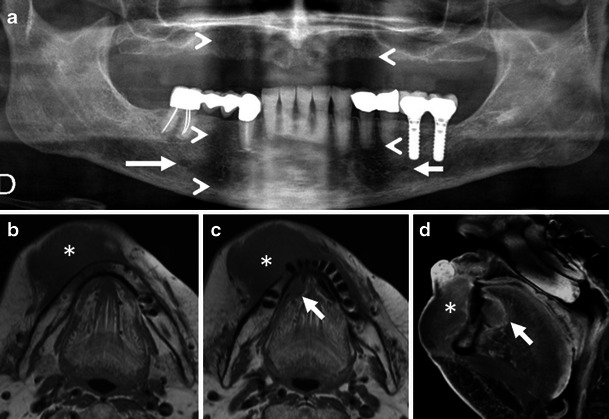
Objectives: Radiolucent mandibular lesions seen on panoramic radiographs develop from both odontogenic and non-odontogenic structures. They represent a broad spectrum of lesions with a varying degree of malignant potential. The purpose of this review is to illustrate the characteristic imaging findings-as well as the clinical and histological features-of common and uncommon radiolucent lesions of the mandible.

Methods: This review article is based on the retrospective evaluation of 11,725 panoramic radiographs seen in our institution during the past 6 years. It provides a comprehensive, practical approach to the radiological interpretation of radiolucent lesions of the mandible. To facilitate the diagnostic approach, we have classified radiolucent lesions into two groups: lesions with well-defined borders and those with ill-defined borders.

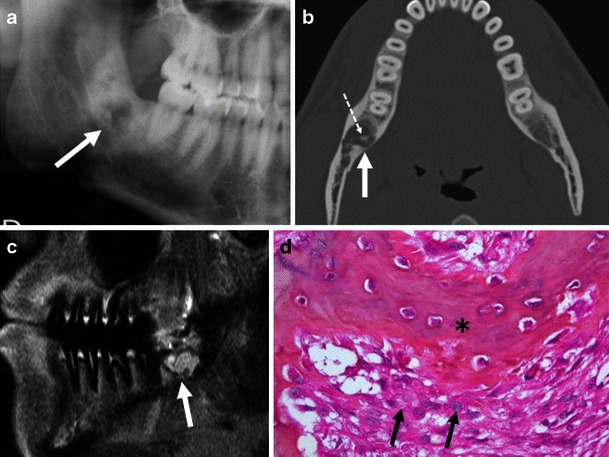
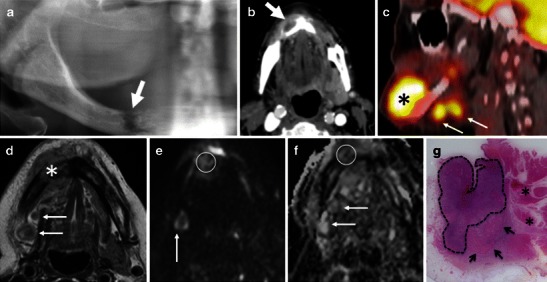
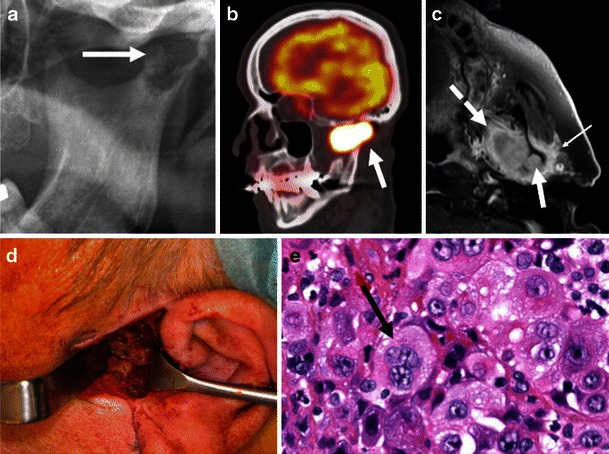
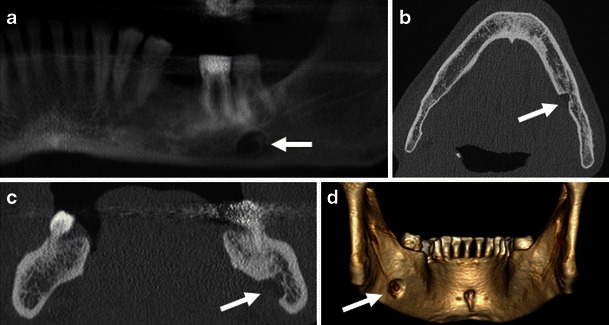
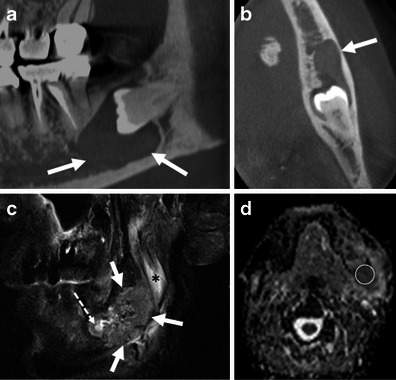
Results: Lesion prevalence, age of manifestation, location within the mandible, relationship to dental structures, effect on adjacent structures and characteristic findings at computed tomography (CT), cone beam CT (CBCT) and magnetic resonance imaging (MRI) with diffusion-weighted imaging (DWI) are discussed. Pitfalls including malignant lesions mimicking benign disease and pseudo-lesions are equally addressed.

Conclusion: Knowledge of the characteristic imaging features of radiolucent mandibular lesions narrows the differential diagnosis and is crucial for the identification of those lesions, where biopsy is indicated for definitive histology.

Teaching points: • Panoramic X-rays, CT and MRI are essential for the work-up of radiolucent mandibular lesions. • Lesion borders, location within the mandible, relationship to dental structures and tissue characteristics on cross-sectional imaging are indispensable to narrow the differential diagnosis. • High-resolution CT and CBCT play a major role for the assessment of lesion margins and their relationship to important anatomic structures, such as the inferior alveolar nerve. • Although most radiolucent lesions with well-defined sclerotic borders are benign, MRI may reveal clinically unsuspected malignant disease.


Figures

Fig. 1
Fig. 1
Radicular cyst. a OPT. Unilocular radiolucent lesion with well-defined borders (asterisk) displacing teeth 33 and 34. b CT, sagittal oblique 2D MPR with bone windows. Cystic lesion surrounding the root (dashed arrow) of the non-vital tooth 34. Associated large caries with pulpal necrosis (arrow). c Histology (haematoxylin-eosin stain, original magnification 20×): fibrous connective wall containing a dense chronic inflammatory infiltrate and congested vessels (asterisk) lined by irregular non-keratinised stratified squamous epithelium. Spongiotic epithelium (arrows) penetrated by neutrophils
Fig. 2
Fig. 2
Residual cyst. a OPT. Unilocular well-defined lesion with sclerotic borders (arrow) and missing tooth 36 above. b Histology (haematoxylin-eosin stain, original magnification 20×): non-keratinised stratified squamous epithelium (arrow) with mild inflammation
Fig. 3
Fig. 3
Dentigerous cyst. a OPT, b axial CT with bone windows and c dentascan reconstruction. Unilocular well-defined radiolucent lesion (thick arrows) surrounding an unerupted tooth. Immediate vicinity of the mandibular canal (dashed arrow) to the impacted tooth. d Three-dimensional reconstruction, lateral view showing the relationship of the cyst (blue), the unerupted tooth (green) and the mandibular canal (red). The cyst is attached at the level of the tooth neck and surrounds the crown. e Surgical specimen. Characteristic attachment of the cyst at the tooth neck (arrows). f Histology (haematoxylin-eosin stain, original magnification 20×): non keratinising thin epithelial lining (arrow) without rete pegs. Fibrous wall (asterisks) almost completely devoid of inflammatory cells
Fig. 4
Fig. 4
Histologically proven KCOT. a OPT. Axial CT image with bone window (b) and soft tissue window (c). Multilocular well-defined radiolucent lesion (asterisk) with thin, sclerotic borders, cortical scalloping (arrow) and resorption of teeth roots. Cyst contents with attenuation values of 40–50 HU mimicking solid tissue. d Posterior view of a 3D reconstruction showing the relationship between the keratocyst (blue), the partially resorbed teeth (green) and the mandibular canal (red). The mandibular canal can be seen only in the posterior mandible, as it is encased by the keratocyst
Fig. 5
Fig. 5
Basal cell nevus syndrome. a OPG. Multiple mandibular and maxillary KCOTs (asterisks) associated with impacted teeth. b Intraoperative view showing cheese-like material within the angulo-mandibular lesion (arrow). c Surgical specimen showing the KCOT (asterisk) and the associated tooth (thin long arrow). d Histology (haematoxylin-eosin stain, original magnification 40×): corrugated (dashed arrows) parakeratinised epithelium with distinct basal columnar cells with inverted polarity (arrows) and flat connective tissue interface
Fig. 6
Fig. 6
Histologically proven multilocular ameloblastoma. a Axial bone window CT image. b Three-dimensional reconstruction, frontal view. c T1-weighted axial image. d T1-weighted axial image after injection of gadolinium chelates. Multilocular expansile radiolucency with characteristic “soap bubble” appearance (asterisks) and major facial deformation. Cystic components with variable signal intensity on the unenhnanced T1-weighted image suggesting variable protein content. Note variable enhancement of solid components ranging from thin enhancing walls to thick enhancing solid portions (arrows)
Fig. 7
Fig. 7
Recurrent multilocular ameloblastoma. a OPT showing a well-defined, multilocular radiolucency (arrows) with sclerotic borders. b Resected specimen and c specimen radiograph clearly show bony expansion, destruction of the alveolar ridge and characteristic multilocular appearance. d Histology (haematoxylin-eosin stain, original magnification 20×): follicular ameloblastoma with squamous metaplasia (red asterisks) within follicles (arrows). Largely fibrous stroma (black asterisks) containing scattered lymphocytes
Fig. 8
Fig. 8
Histologically proven eosinophilic granuloma. a OPT-like curved thick slab reconstruction, b axial CT bone window and (c) 3D reconstruction from CT data set show a well-defined radiolucent lesion (arrows) located in the angle of the mandible. Sharply delineated slightly sclerotic borders. Periosteal reaction (dashed arrow). d PET/CT showing that high FDG uptake within the posterior mandible and perimandibular soft tissues (arrow). SUVmean = 6, SUVmax = 9. e Axial T2 and f sagittal T1 after intravenous gadolinium show a large extraosseous component (arrows) with invasion of the masseter muscle. Close vicinity to the submandibulat gland. Note high signal intensity on T2 and strong enhancement after gadolinium. g Fused T2 and b 1,000 showing restricted diffusion. h ADC map showing a moderately low ADC value (ADC = 1.21 × 10−3 mm2/s, arrow) within the lesion. Note inflammatory oedema around the lesion with high ADC values (asterisk)
Fig. 9
Fig. 9
Osteomyelitis after tooth extraction. a OPT. b Contrast-enhanced, axial CT image with bone window settings. c Three-dimensional reconstruction. Ill-defined osteolytic area (asterisks) extending into the ascending ramus of the mandible, with cortical destruction (arrows in b and c). d Axial T1-weighted image before (d) and after (e) injection of gadolinium chelates. Hypointense signal of the mandible (arrows in d) due to marrow oedema and strong enhancement (arrows in e) due to hyperaemia. Myositis of the masseter muscle (thick dashed arrow) and streaky enhancement of the subcutaneous fat and platysma muscle (thin dashed arrow) suggesting a phlegmon. f Histology (haematoxylin-eosin stain, original magnification 20×): non-viable trabeculae (large asterisks) with bone resorption and destroyed osteoblasts. Inflammatory infiltrate (small asterisks) with neutrophils and lymphocytes as well as increased vascularisation within the fatty marrow
Fig. 10
Fig. 10
Biphosphonate osteonecrosis. a OPT; b 3D reconstruction anteo-lateral view. Contrast-enhanced axial CT image with bone window settings (c) and soft tissue settings (d). Poorly defined osteolytic lesion of the left mandibular body (thick white arrows) with partly sclerotic margins (thin arrows in a) and large osseous defect (red arrows in b). Bone sequestra (dashed arrows). Associated subperiosteal phlegmon and myositis of the platysma (open arrows). e Histology (haematoxylin-eosin stain, original magnification 20×): necrotic bone (large asterisk) with inflammatory infiltration of the fatty marrow (small asterisks). Gingival mucosa (arrows)
Fig. 11
Fig. 11
CT aspect of osteoradionecrosis 5 years after radiotherapy of a floor of the mouth SCC. a OPT. b Axial bone window CT image. c Three-dimensional reconstruction, posterior view obtained after removing the bony structures of the cervical spine. Characteristic osteolytic bone defect (arrows) with poorly defined partly sclerotic margins and soft tissue ulceration (dashed arrow). Follow-up confirmed absence of tumour
Fig. 12
Fig. 12
MRI aspect of osteoradionecrosis 2 years after chemoradiotherapy of a tonsillar SCC. a Axial T1-weighted image. b Contrast-enhanced sagittal oblique T1-weighted image and ADC map (small image in b). Bilateral hypointensity of the bony marrow. Large osseous defect with cortical destruction on the left (arrow in a). Marked, non-specific contrast enhancement, bony destruction and necrotic hypointense sequestrae (arrow in b). Note high ADC value (red circle) measured at 1.53 × 10−3 mm2/s suggesting inflammation and absent recurrence. c Macroscopic resection specimen. The necrotic area is indicated by arrows. d Histology (haematoxylin-eosin stain, original magnification 40×): necrotic bone trabeculae with inflammatory infiltrative changes in the bony marrow
Fig. 13
Fig. 13
Osteoblastoma. a OPT. b Axial CT with bone window. c Sagittal oblique contrast-enhanced fat-saturated T1-weighted image. Ill-defined radiolucent lesion (arrows in a and b) with coarse sclerotic borders and calcifications (dashed arrow). Major contrast enhancement (arrow in c). d Histology (haematoxylin-eosin stain, original magnification 64×). Osteoid and woven bone (asterisk) with plump osteoblast-like cells (arrows), interposed fibroblasts and some inflammatory cells
Fig. 14
Fig. 14
SCC with mandibular invasion. Precise pre-operative assessment with MRI and PET/CT. a OPT. Poorly defined bony destruction (arrow) of the edentulous mandible. b Contrast-enhanced axial CT. Aggressive soft-tissue lesion (arrow) with secondary bone invasion. c Sagittal oblique PET/CT image. High metabolism of the tumour (black asterisk, SUVmean = 18, SUVmax = 22) and of two metastatic level I lymph nodes (arrows, SUVmean = 10, SUVmax = 15). d T2-weighted axial image. Tumour (asterisk) with marrow invasion and extensive infiltration of the floor of the mouth (dashed arrow). Note two metastatic level I lymph nodes (arrows). e The b 1,000 and f ADC map show restricted diffusion within the tumour (circle, ADC = 0.98 × 10−3 mm2/s). Variable ADC values within the metastatic lymph nodes due to the presence of necrosis (arrows in f). g Sagittal histological whole-organ slice of the resected specimen. Tumour (dashed black line) invading the mandible (black arrows) and the muscles (asterisk) of the floor of the mouth. The histological slice has the same orientation as (c)
Fig. 15
Fig. 15
Condylar metastasis from adenocarcinoma. OPT (a) with osteolytic ill-defined lesion of the mandibular condyle (arrow). b Sagittal PET/CT image shows high metabolism with SUV = 12 (arrow). c Axial, contrast-enhanced, fat-saturated T1-weighted image. The infiltrative, bulky lesion invades the condyle (arrow), the internal pterygoid muscle (dashed arrow) and part of the parotid gland (thin arrow). d Intraoperative view. Extensive condylar involvement. e Histology (haematoxylin-eosin stain, original magnification 80×): large atypical polygonal cells, some with several nuclei (arrow)
Fig. 16
Fig. 16
Stafne cyst discovered incidentally. a OPT-like reconstruction from CBCT data set showing a well-defined, unilocular radiolucency (arrow) with sclerotic borders in the region of 37 and 38. No relationship to teeth. b Axial, c coronal and d 3D reconstruction, posterior view. Bony defect (arrows) in characteristic location
Fig. 17
Fig. 17
Intracystic carcinoma. a Sagittal oblique and b axial CBCT image displaying the characteristic aspect of a dentigerous cyst with well-defined cyst borders (arrows). The cyst surrounds the crown of an impacted tooth. c T2-weighted image: solid intracystic component with moderately high signal intensity (arrows). Fluid with high signal intensity within the cyst (dashed arrow). Oedema in the masseter muscle (asterisk). d ADC map with low ADC values (circle) of solid parts (ADC = 0.89 × 10−3 mm2/s) suggesting an intracystic malignant tumour despite the benign appearance on CBCT. Histology revealed SCC arising within a dentigerous cyst
Fig. 18
Fig. 18
Mandibular NHL. a OPT. Difficulty to accurately identify the lesion due its median and paramedian position and the typical anterior OPT artefact (arrowheads) masking the lesion. Subtle enlargement of the right mental foramen (long arrow) compared with the normal contralateral side (short arrow). b, c T1-weighted unenhanced axial images. d T1-weighted fat-saturated contrast-enhanced sagittal image. Large infiltrative lesion (asterisks) extending from the vestibule through the mandible into the floor of the mouth (arrows). The mandibular cortical rim is mostly preserved although the lesion shows diffuse marrow infiltration

References

    1. Dunfee BL, Sakai O, Pistey R, Gohel A. Radiologic and pathologic characteristics of benign and malignant lesions of the mandible. Radiographics. 2006;26:1751–1768. doi: 10.1148/rg.266055189. - DOI - PubMed
    1. Devenney-Cakir B, Subramaniam RM, Reddy SM, Imsande H, Gohel A, Sakai O. Cystic and cystic-appearing lesions of the mandible: review. AJR Am J Roentgenol. 2011;196:WS66–WS77. doi: 10.2214/AJR.09.7216. - DOI - PubMed
    1. Scholl RJ, Kellett HM, Neumann DP, Lurie AG. Cysts and cystic lesions of the mandible: clinical and radiologic-histopathologic review. Radiographics. 1999;19:1107–1124. doi: 10.1148/radiographics.19.5.g99se021107. - DOI - PubMed
    1. Cotti E, Campisi G. Advanced radiographic techniques for the detection of lesions in bone. Endod Top. 2004;7:52–72. doi: 10.1111/j.1601-1546.2004.00064.x. - DOI
    1. Minami M, Kaneda T, Ozawa K, Yamamoto H, Itai Y, Ozawa M, et al. Cystic lesions of the maxillomandibular region: MR imaging distinction of odontogenic keratocysts and ameloblastomas from other cysts. AJR Am J Roentgenol. 1996;166:943–949. doi: 10.2214/ajr.166.4.8610578. - DOI - PubMed

LinkOut - more resources