. 2013 Dec 24;110(52):21000-5.
doi: 10.1073/pnas.1315858110. Epub 2013 Dec 9.

Resolution doubling in fluorescence microscopy with confocal spinning-disk image scanning microscopy

Affiliations

Resolution doubling in fluorescence microscopy with confocal spinning-disk image scanning microscopy

Olaf Schulz et al. Proc Natl Acad Sci U S A. .

Abstract

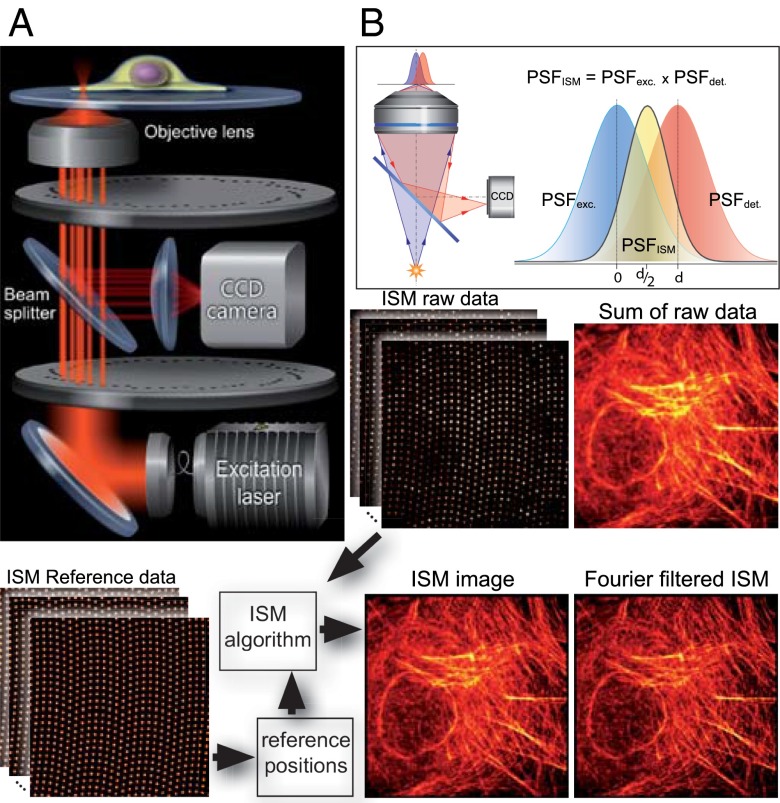
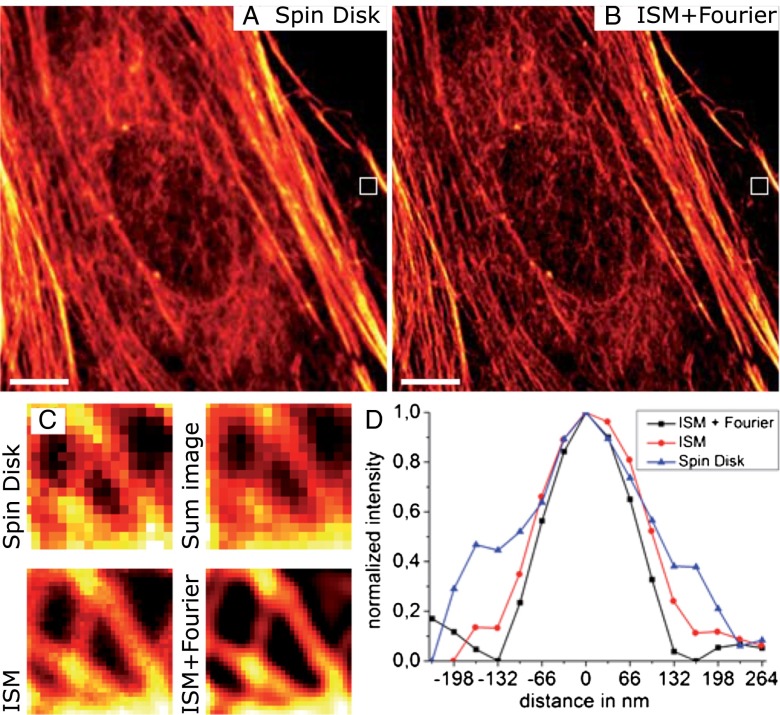
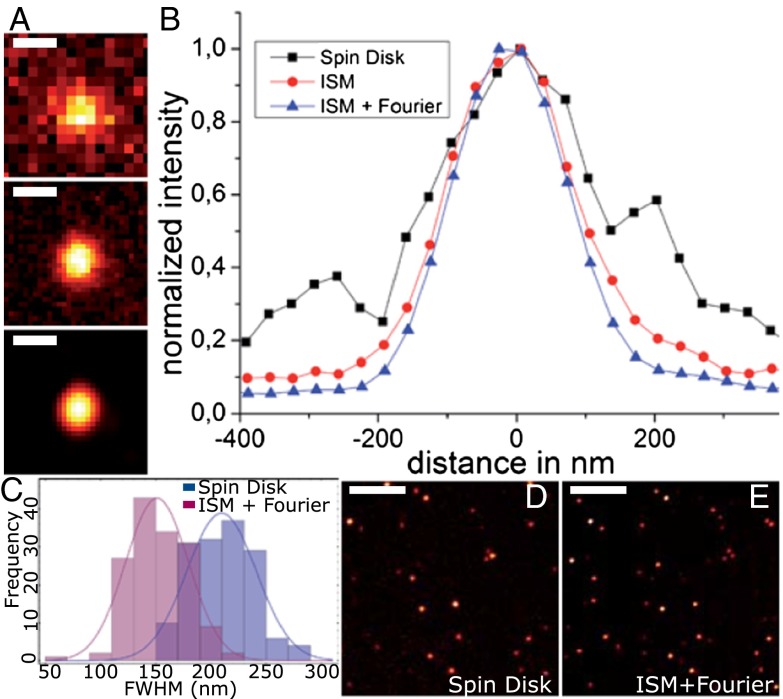
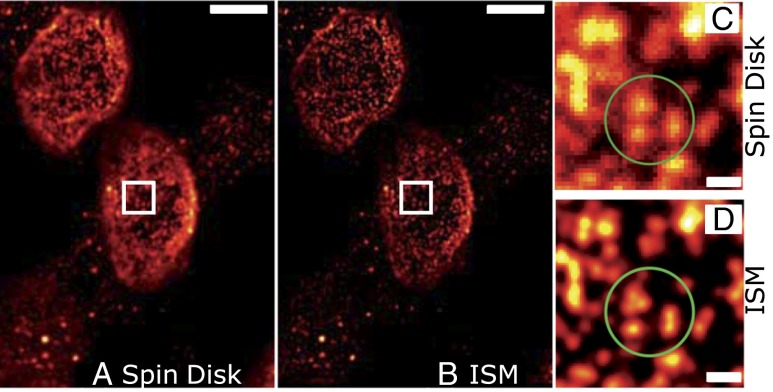
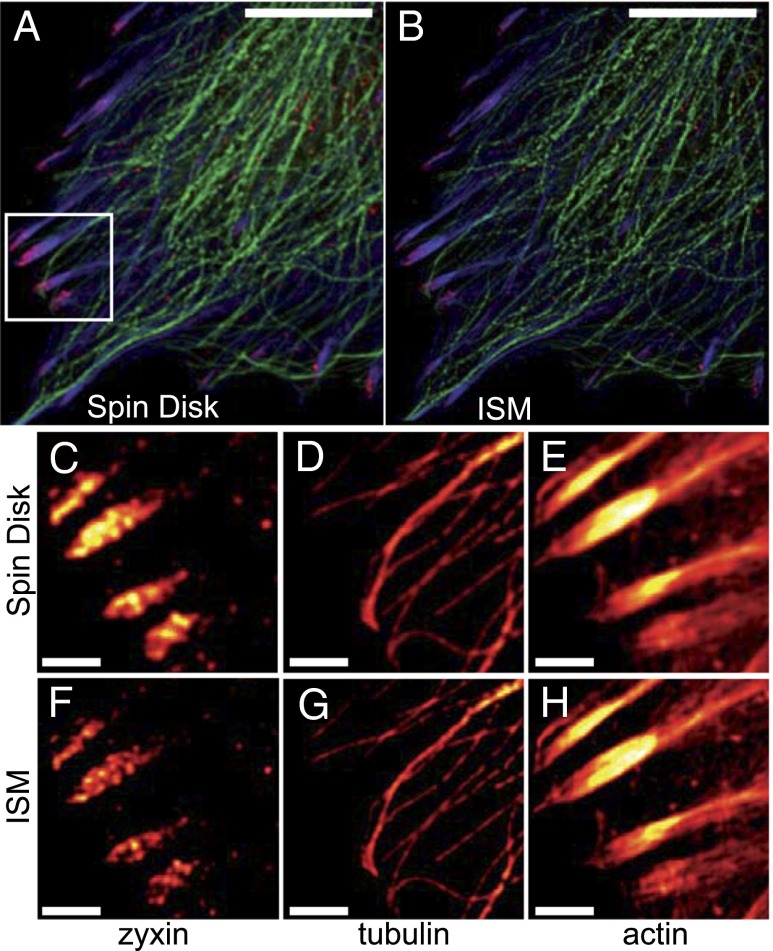
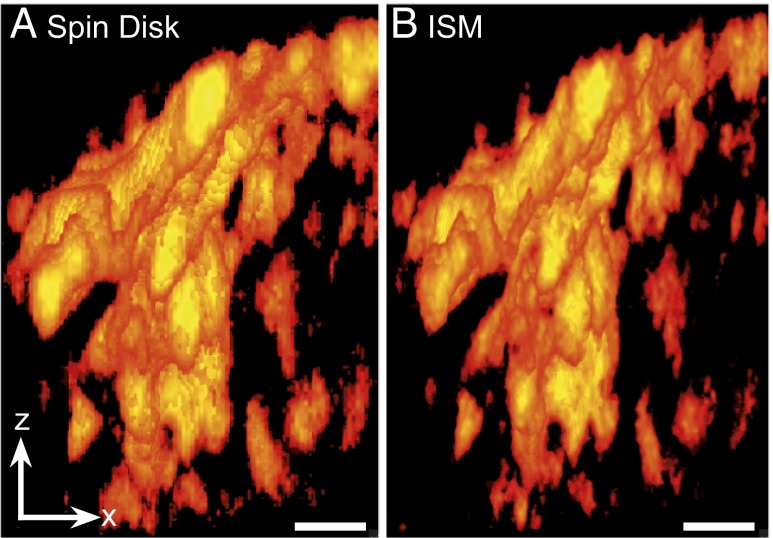
We demonstrate how a conventional confocal spinning-disk (CSD) microscope can be converted into a doubly resolving image scanning microscopy (ISM) system without changing any part of its optical or mechanical elements. Making use of the intrinsic properties of a CSD microscope, we illuminate stroboscopically, generating an array of excitation foci that are moved across the sample by varying the phase between stroboscopic excitation and rotation of the spinning disk. ISM then generates an image with nearly doubled resolution. Using conventional fluorophores, we have imaged single nuclear pore complexes in the nuclear membrane and aggregates of GFP-conjugated Tau protein in three dimensions. Multicolor ISM was shown on cytoskeletal-associated structural proteins and on 3D four-color images including MitoTracker and Hoechst staining. The simple adaptation of conventional CSD equipment allows superresolution investigations of a broad variety of cell biological questions.


Conflict of interest statement

The authors declare no conflict of interest.

Figures

Fig. 1.
Fig. 1.
Basics of CSD-ISM. (A) Schematic drawing of the optical setup. The excitation light (400 nm, 488 nm, 561 nm, or 647 nm) is coupled into the spin-disk confocal unit via an optical fiber. A Nipkow disk with microlenses focuses the light onto pinholes of an opposing disk. The microscope objective focuses the light emerging from the pinholes to diffraction-limited spots in the sample. The fluorescence emission from these spots is collected by the same objective and passes through the pinholes onto a CCD camera via a dichroic beam splitter. (B) A pixel on the CCD camera, if it is small enough, detects light from a diffraction-limited region of the sample. Pixels offset from the optical axis will detect an area of the sample that does not coincide with the excitation; thus, the product of these two point-spread functions, which is proportional to the amount of light detected, will be shifted. This way, each pixel on the CCD records a confocal image that is shifted by half its distance from the optical axis. The bottom of the figure illustrates the work flow in CSD-ISM. Reference data from a homogenously fluorescing sample is recorded to determine the center position of each pinhole. These reference positions are fed into the ISM algorithm that shifts the raw data from every pinhole, as indicated in B. Finally, Fourier filtering is performed to gain the full resolution enhancement of ISM.
Fig. 2.
Fig. 2.
Doubling the resolution for actin imaging in mammalian cells with CSD-ISM. Rat embryonal fibroblasts (REF52) were labeled for actin with Alexa 488–phalloidin. The exposure time for the conventional spin-disk image (A) was 10 ms. The CSD-ISM image (B) was calculated from 250 single images with an exposure time of 138 µs per frame (∼20 s acquisition time). (C) Comparison of a small area (white frame) where individual actin filaments can be distinguished. The size of the magnified region is 1 μm. As expected, the conventional spin-disk image and the sum over all 250 single shots of the CSD-ISM dataset are of comparable quality, whereas the CSD-ISM image and the CSD-ISM image after Fourier reweighting show more detail. (D) The graphs show a section through the actin filament in the center of the zoom-in. Gaussian fits to these sections exhibit FWHMs of 201 nm, 162 nm, and 130 nm for the spin-disk image, the CSD-ISM image, and the Fourier reweighted CSD-ISM image, respectively. The scale bars in A and B are 5 μm.
Fig. 3.
Fig. 3.
Quantification of resolution enhancement using single Atto 655 molecules on glass. (A) Comparison among conventional spin disk, CSD-ISM, and CSD-ISM with Fourier reweighting of a single Atto 655 molecule. The spin-disk image (D) was taken at an exposure time of 1 s. The CSD-ISM image (E) was calculated from 1,000 single images, each with an exposure time of 138 µs (∼80 s acquisition time). (B) Plot of a section through the center of the molecule for the different images in A. The FWHMs (Gauss fit) of the sections are 248 ± 12 nm, 186 ± 3 nm, and 171 ± 2 nm (SE), respectively. The histogram of FWHMs of single-molecule fluorescence (C) is determined by a 2D Gauss fit. The histogram contains both the x and y values of the FWHM of 86 single-molecule spots. The scale bar is 300 nm in A and 4 μm in D and E.
Fig. 4.
Fig. 4.
Improved identification of single NPCs with CSD-ISM. Image of NPCs immunolabeled by mAb414 and Alexa 488. (A) Conventional spinning-disk image with an exposure time of 50 ms. (B) Final CSD-ISM image, calculated from 500 single images with an exposure of 138 µs per image (∼40 s acquisition time). (C and D) Direct comparison of a smaller area between conventional spin disk (C) and CSD-ISM (D). The superior performance of CSD-ISM is immediately clear. Single NPCs, which were obscured in the confocal image, can be distinguished clearly (green circled area). The scale bars are 5 μm in the overview and 500 nm in the indicated magnified region.
Fig. 5.
Fig. 5.
ISM allows higher resolution in multicolor imaging. Multicolor ISM of fixed REF52 cells showing Alexa 488-labeled actin (blue) and TRITC-labeled tubulin (green) cytoskeletal networks together with the Alexa 647-labeled focal adhesion protein zyxin (red). A confocal image is shown in A. The corresponding CSD-ISM image from 378 single images is shown in B. For CSD-ISM images of Alexa 488 and TRITC, each single image was exposed for 66 µs (∼15 s acquisition time), and for Alexa 647 an exposure of 210 µs (∼45 s acquisition time) was used. Magnifications of the indicated regions of interest are shown in CH. The scale bars are 10 μm for the overview and 2 μm for the regions of interest.
Fig. 6.
Fig. 6.
ISM gives enhanced resolution in three dimensions. Three-dimensional representation of confocal (A) and CSD-ISM (B) z-stack data of GFP-fused 3PO-Tau aggregates in an N1E115 neuroblastoma cell. The increased level of detail in the ISM data allows for better characterization of different types and progression of aggregates. The data were acquired using the 16-pulse laser sequence (Synchronization and Data Acquisition). The images were calculated from 125 single images with an exposure time of 6 µs per image (∼0.8 s acquisition time). The scale bar (1 μm) is the same for x- and z-direction. A movie of these data may be found as Movie S1.

References

    1. Hell SW, Wichmann J. Breaking the diffraction resolution limit by stimulated emission: Stimulated-emission-depletion fluorescence microscopy. Opt Lett. 1994;19(11):780–782. - PubMed
    1. Betzig E, et al. Imaging intracellular fluorescent proteins at nanometer resolution. Science. 2006;313(5793):1642–1645. - PubMed
    1. Rust MJ, Bates M, Zhuang X. Sub-diffraction-limit imaging by stochastic optical reconstruction microscopy (STORM) Nat Methods. 2006;3(10):793–795. - PMC - PubMed
    1. Müller CB, Enderlein J. Image scanning microscopy. Phys Rev Lett. 2010;104(19):198101. - PubMed
    1. Gustafsson MG. Surpassing the lateral resolution limit by a factor of two using structured illumination microscopy. J Microsc. 2000;198(Pt 2):82–87. - PubMed

Publication types

MeSH terms