. 2013 Dec 24;110(52):21006-11.
doi: 10.1073/pnas.1317441110. Epub 2013 Dec 9.

Biased migration of confined neutrophil-like cells in asymmetric hydraulic environments

Affiliations

Biased migration of confined neutrophil-like cells in asymmetric hydraulic environments

Harrison V Prentice-Mott et al. Proc Natl Acad Sci U S A. .

Abstract

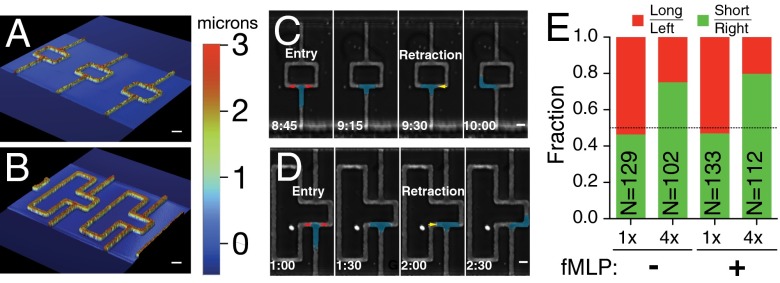
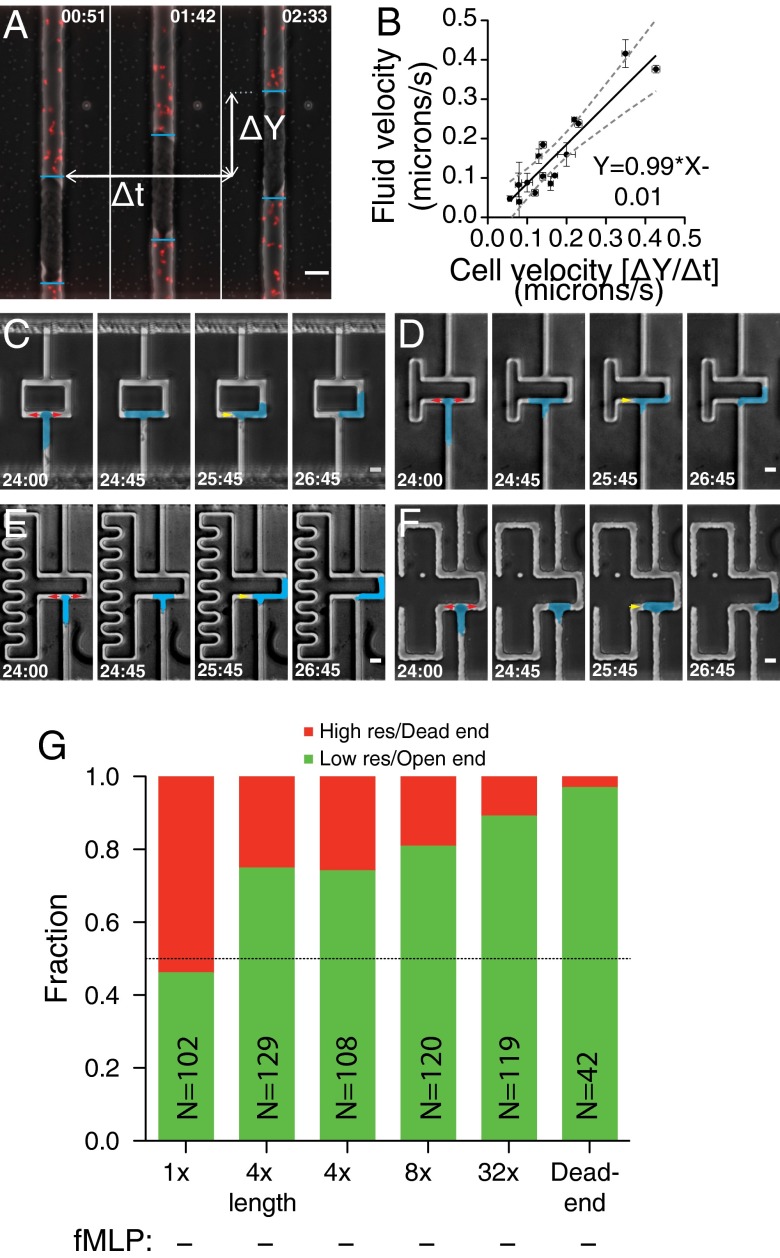
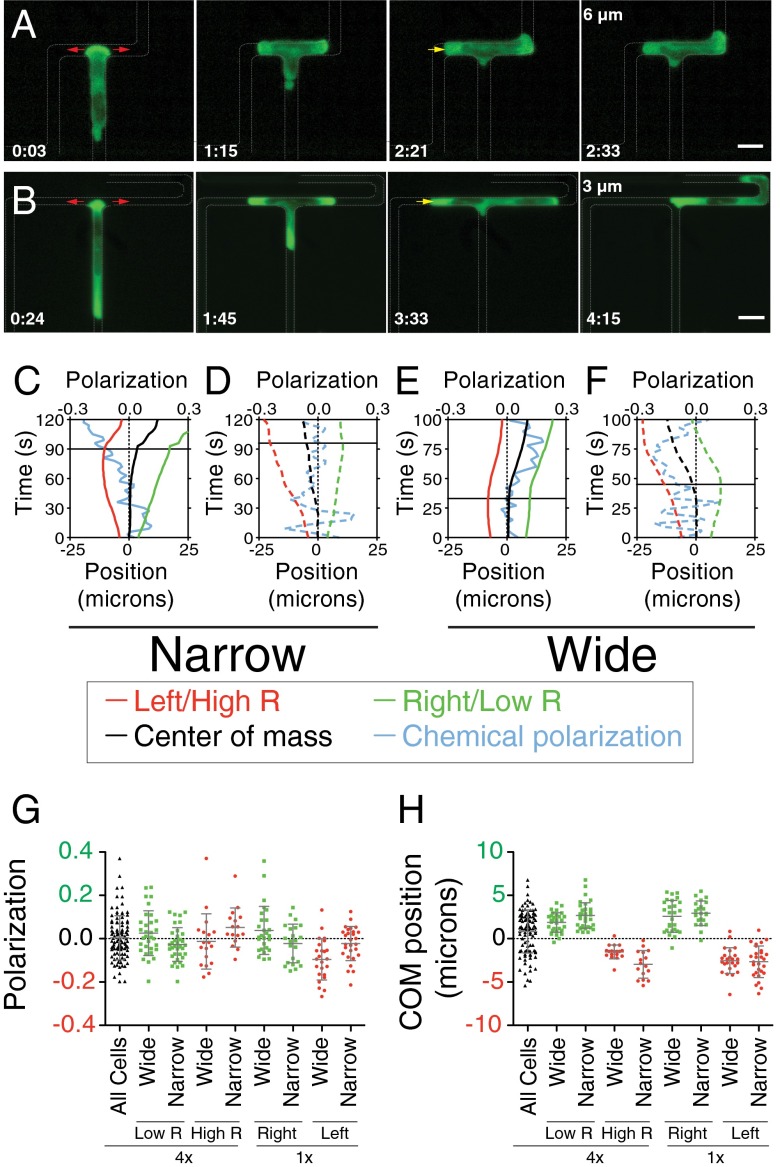
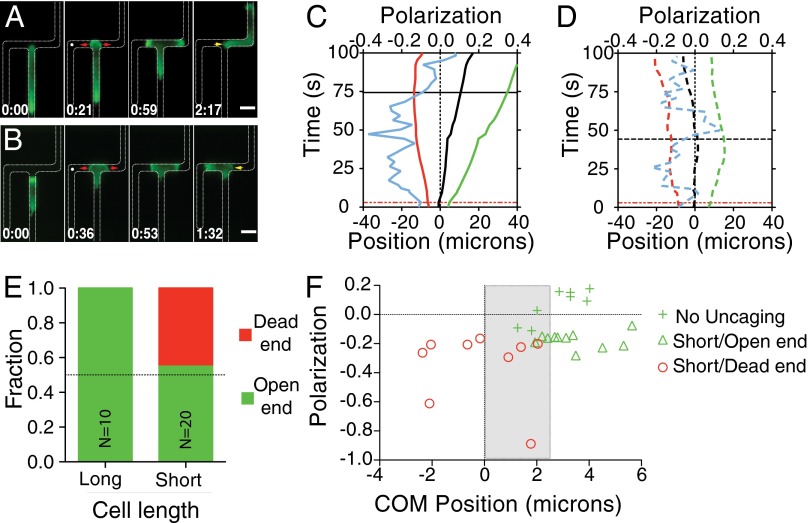
Cells integrate multiple measurement modalities to navigate their environment. Soluble and substrate-bound chemical gradients and physical cues have all been shown to influence cell orientation and migration. Here we investigate the role of asymmetric hydraulic pressure in directional sensing. Cells confined in microchannels identified and chose a path of lower hydraulic resistance in the absence of chemical cues. In a bifurcating channel with asymmetric hydraulic resistances, this choice was preceded by the elaboration of two leading edges with a faster extension rate along the lower resistance channel. Retraction of the "losing" edge appeared to precipitate a final choice of direction. The pressure differences altering leading edge protrusion rates were small, suggesting weak force generation by leading edges. The response to the physical asymmetry was able to override a dynamically generated chemical cue. Motile cells may use this bias as a result of hydraulic resistance, or "barotaxis," in concert with chemotaxis to navigate complex environments.

Keywords: cell confinement; cell migration; microfluidics; photocaged chemoattractant; physical forces.


Conflict of interest statement

The authors declare no conflict of interest.

Figures

Fig. 1.
Fig. 1.
Confined cells can identify shorter paths independent of chemical cues. (A and B) Images from an optical profilometer showing 3D geometry of bifurcating microchannel features on a silicon master for 1× (A) and 4× (B) length ratios. (Scale bar, 10 µm.) The color bar gives the height of the features, as measured by the profilometer. (C and D) Time course montage of a cell migrating through a bifurcation in 1× (C) and 4× (D) length ratio geometries. Cells are false-colored for visibility. Frames are labeled to emphasize the processes of entering the bifurcation (red arrows) and retracting one of the two leading edges (yellow arrow). (Scale bar, 10 µm.) (E) Directional decision statistics for cells in 1× and 4× length ratio geometries and in the absence or presence of chemokine (fMLP). Green denotes cells that migrated toward the shorter length (or right) side, and red denotes cells that migrated toward the longer length (or left) side. N indicates number of cells measured.
Fig. 2.
Fig. 2.
Cells push water and can identify the path of least resistance. (A) Time course montage of a cell in a microchannel with fluorescent beads. ΔY shows the distance traveled by the cell, and Δt shows time taken to travel ΔY. Image was acquired with a 40× oil 1.0 NA immersion objective. Correlation data were acquired with a 10× air 0.25 NA objective. (Scale bar, 10 µm.) (B) Plot and fit of fluid velocity calculated by STICS (y axis) compared with measured cell velocity (x axis). Gray dashed lines show 95% CI of fit, shown by black line. A nonlinear regression gave a slope of 0.99 ± 0.26 and an intercept of 0.01 ± 0.05. Fit equation is shown. (CF) Time course montages of cell migrating in channels with resistance ratios of 4× (C), 8× (D), 32× (E), and dead end (F). Cells are false-colored for visibility. (Scale bar, 10 µm.) Red arrows indicate the process of entering the microchannel, while the yellow arrow indicates the process of retracting the nonpersistent leading edge. (G) Directional decision statistics of cells in all geometries in the absence of chemokine.
Fig. 3.
Fig. 3.
Asymmetries in leading edge extension predict cellular directional decision. (A and B) Time course montage of a cell expressing PH-Akt migrating in 4× length ratio bifurcation geometry with widths of 6 µm (A) and 3 µm (B). (Scale bar, 10 µm.) The red arrows denote the process of entering the bifurcation, and the yellow arrow denotes the retraction of the nonpersistent leading edge. (CF) Trajectories of the position of the low-resistance leading edge (green), high-resistance leading edge (red), center of mass (black), and PH-Akt polarization (cyan) vs. time. Plots are grouped according to whether the cell migrated in narrow channels (C and D) or wide channels (E and F). Dashed trajectories represent a cell choosing the high-resistance channel; solid trajectories represent a cell choosing the low-resistance channel. Horizontal lines show the retraction time for each cell. (G and H) Column scatter dot plots of the position of the PH-Akt polarization (G) and center of mass (COM) (H) at retraction time for 4× and 1× geometries. All plots show distribution for cells in narrow and wide geometries for the 4× resistance ratio in black. The distribution for cells that migrate toward the low-resistance/right side is shown in green, grouped by resistance ratio. The distribution for cells that migrated toward the high-resistance/left side is shown in red, grouped by resistance ratio.
Fig. 4.
Fig. 4.
Physical asymmetry can override chemical activation. (A and B) Time course montages of cells in the presence of caged fMLP exposed to laser excitation. Location of uncaging (white dot) and uncaging time are shown in the second image. Cells migrated toward the open end (A) or toward the dead end (B), albeit with different statistics. (Scale bar, 10 µm.) The red arrows denote the process of entering the bifurcation, and the yellow arrow denotes the retraction of the nonpersistent leading edge. (C and D) Leading edge trajectories as shown previously for cells exposed to uncaging of caged fMLP and migrating away from the dead end (C) or toward the dead end (D). Note the increase in polarization magnitude after cfMLP uncaging. Red line represents the uncaging time, while the black line represents the retraction time. (E) Directional decision statistics for cells that were exposed to laser excitation in the presence of caged fMLP. Cells were grouped according to whether they were longer (“long”) or shorter (“short”) than 40 µm. (F) Scatter plot of the maximum polarization (negative is toward the dead end) following uncaging and the center of mass (COM) bias directly before retraction. Shown are all short cells exposed to uncaging and cells in dead-end bifurcations not exposed to uncaging. Gray box marks the region in which cells with a physical bias toward the open end migrate toward the dead end.

References

    1. Swaney KF, Huang C-H, Devreotes PN. Eukaryotic chemotaxis: A network of signaling pathways controls motility, directional sensing, and polarity. Annu Rev Biophys. 2010;39:265–289. - PMC - PubMed
    1. Insall RH. Understanding eukaryotic chemotaxis: A pseudopod-centred view. Nat Rev Mol Cell Biol. 2010;11(6):453–458. - PubMed
    1. Parent CA. Making all the right moves: Chemotaxis in neutrophils and Dictyostelium. Curr Opin Cell Biol. 2004;16(1):4–13. - PubMed
    1. Fuller D, et al. External and internal constraints on eukaryotic chemotaxis. Proc Natl Acad Sci USA. 2010;107(21):9656–9659. - PMC - PubMed
    1. Kay RR, Langridge P, Traynor D, Hoeller O. Changing directions in the study of chemotaxis. Nat Rev Mol Cell Biol. 2008;9(6):455–463. - PubMed

Publication types

LinkOut - more resources