. 2013 Dec 24;110(52):21048-53.
doi: 10.1073/pnas.1319097110. Epub 2013 Dec 9.

Visualization of repetitive DNA sequences in human chromosomes with transcription activator-like effectors

Affiliations

Visualization of repetitive DNA sequences in human chromosomes with transcription activator-like effectors

Hanhui Ma et al. Proc Natl Acad Sci U S A. .

Erratum in

  • Proc Natl Acad Sci U S A. 2014 Jan 21;111(3):1222

Abstract

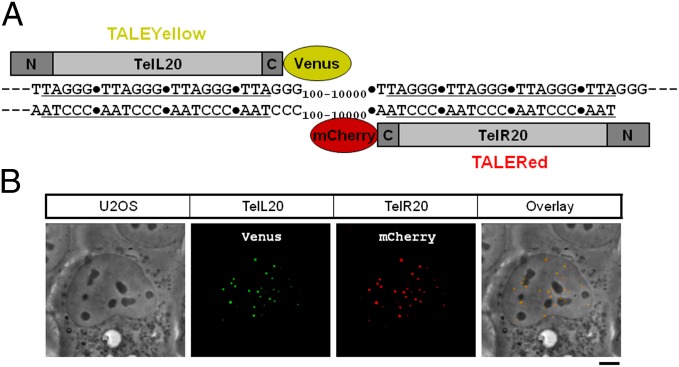
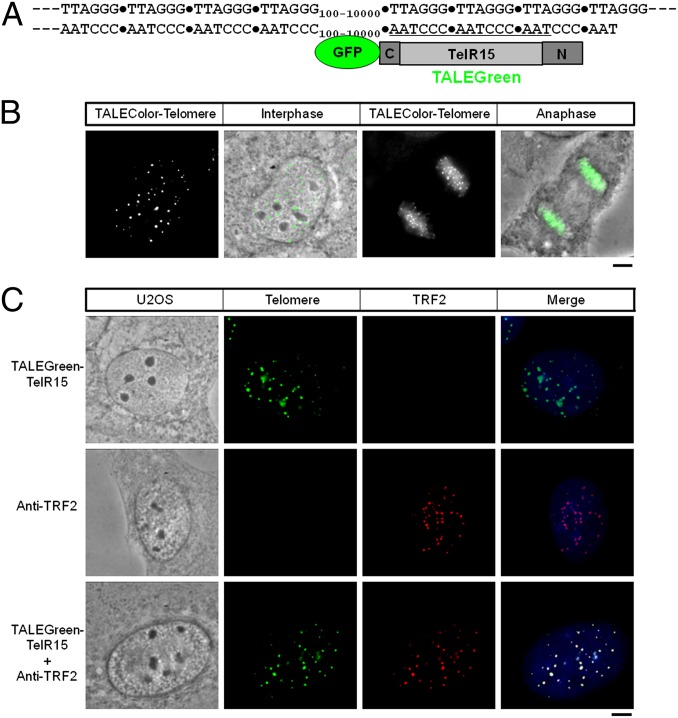
We describe a transcription activator-like effector (TALE)-based strategy, termed "TALEColor," for labeling specific repetitive DNA sequences in human chromosomes. We designed TALEs for the human telomeric repeat and fused them with any of numerous fluorescent proteins (FPs). Expression of these TALE-telomere-FP fusion proteins in human osteosarcoma's (U2OS) cells resulted in bright signals coincident with telomeres. We also designed TALEs for centromeric sequences unique to certain chromosomes, enabling us to localize specific human chromosomes in live cells. Meanwhile we generated TALE-FPs in vitro and used them as probes to detect telomeres in fixed cells. Using human cells with different average telomere lengths, we found that the TALEColor signals correlated positively with telomere length. In addition, suspension cells were followed by imaging flow cytometry to resolve cell populations with differing telomere lengths. These methods may have significant potential both for basic chromosome and genome research as well as in clinical applications.


Conflict of interest statement

Conflict of interest statement: H.M. is an inventor on a US patent application filed by the University of Massachusetts.

Figures

Fig. 1.
Fig. 1.
Illustration of telomere detection by TALEColor. (A) TALEYellow and TALERed probes were designed to target either strand of the telomere repeat by fusion of Venus or mCherry at C terminus. (B) U2OS cells were cotransfected with TALEYellow-TelL20 (Center Left) and TALERed-TelR20 (Center Right) and labeling was assessed in the live cells 24 h later. The Far Left panel is the phase-contrast images and the Far Right panel is the two-color overlays, respectively. (Scale bar, 5 μm.)
Fig. 2.
Fig. 2.
Live cell imaging of centromeres and telomeres by TALEColor. U2OS cells were cotransfected for 24 h with TALEmCherry-TelR20 to label telomeres together with one of three TALEs designed to recognize centromeric repeats. (Top row) TALEVenus-PanCen, a TALE predicted to bind all human centromeres. (Middle row) TALEVenus-Cen18, specific for an α-satellite higher order repeat on chromosome 18 (D18Z1). (Bottom row) TALEVenus-Cen15, a specific α-satellite higher order repeat on chromosome 15 (D15Z3). Overlay images are shown in the Far Right column. (Scale bar, 5 μm.)
Fig. 3.
Fig. 3.
TALE–FPs label telomeres in fixed cells. (A) Diagram of TALEGreen-TelL15. (B) U2OS cells were fixed in 90% methanol and incubated with the probe. Shown are representative images in an interphase and anaphase cell. (C) After exposing fixed cells to the TALEGreen telomere probe, immunostaining was carried out with a TRF-2 antibody followed by a TRITC-labeled secondary antibody. (Top row) Probe imaged in both the green and red channels. (Middle row) TRF2 immunostaining imaged in both channels. (Bottom row) Probe and TRF2 immunostaining imaged in each channel. The Far Left column shows phase-contrast images and the Far Right column shows images in which both the probe and TRF2 merged onto DAPI staining. (Scale bars in AC, 5 μm.)
Fig. 4.
Fig. 4.
Spectral variants of TALEColor probes. (A) TALE-TelR15 probes were designed with various fused fluorescent proteins as indicated and applied to fixed U2OS cells. Images were captured in the appropriate channels (Lower row). (B) TALE-TelR15 probe with no fused fluorescent protein was produced carrying internal lysine resides labeled with a green dye (Materials and Methods). The labeling obtained (Upper row) was imaged and compared with that with the same TALE carrying fused mCherry (Lower row), with the Far Right column representing the respective images overlaid onto DAPI images. (Scale bar in A and B, 5 μm.)
Fig. 5.
Fig. 5.
Telomeres compared by TALEColor in variety of human cell lines. U2OS, HeLa 1.3, HeLa S3, IMR90, and RPE1 cells were fixed and incubated with TALEGreen-TelR15 (Middle row). All of the images of TALEGreen-TelR15 (Middle row) are scaled to the same. The phase images are shown in Top row and images merged with DAPI are shown in the Bottom row. (Scale bar, 5 μm.)
Fig. 6.
Fig. 6.
Imaging flow cytometry assessment of average telomere length and intracell population heterogeneity. (A) HeLa 1.3 and HeLa S3 cells cultured either alone or together and then incubated with TALEGreen-TelR15 and imaged. (Scale bar, 10 μm.) (B) Separate coverglass cultures of HeLa 1.3 and HeLa S3 cells were trypsinized, fixed, and incubated with TALEGreen-TelR15 together with DNA staining with DAPI or DRAQ5 for the HeLa 1.3 and S3 cells, respectively. The two cell populations were then mixed and imaging flow cytometry was carried out immediately. Single cells were gated by an aspect ratio program in the instrument’s software (Middle row, Far Left). DAPI positive cells (purple) and DRAQ5 positive cells (red) were gated by their intensity (Top row, Far Left) and their intensity plots are shown in the indicated panels. The DNA intensity plots of the two cell populations (resolved out from the mixture of the two cell lines) are shown in the indicated panels. The scatter plot of TALEGreen-TelR15 signals in all cells is shown (Bottom row, Far Left). These were sorted into DAPI positive (purple) and DRAQ5 positive (red) populations (Bottom row, Middle). The DAPI positive cells were then sorted into distinct levels of telomere labeling: a high level (R1, light green, Top row, Far Right) and a moderate level (R2, dark green, Top row, Far Right). DRAQ5 positive cells with their low level of telomere labeling were sorted in parallel (R3, teal, Middle row, Far Right). (C) Representative DAPI images for HeLa 1.3 cells not labeled with TALEGreen-TelR15 (Far Left three columns), DAPI positive R1 cells (Center Left four columns), DAPI positive R2 cells (Center Right four columns), DRAQ5 positive R3 cells (Far Right four columns). BF, brightfield.

Comment in

References

    1. Boch J, et al. Breaking the code of DNA binding specificity of TAL-type III effectors. Science. 2009;326(5959):1509–1512. - PubMed
    1. Baker M. Gene-editing nucleases. Nat Methods. 2012;9(1):23–26. - PubMed
    1. Bogdanove AJ, Voytas DF. TAL effectors: Customizable proteins for DNA targeting. Science. 2011;333(6051):1843–1846. - PubMed
    1. Politz JC, Tuft RA, Pederson T. Diffusion-based transport of nascent ribosomes in the nucleus. Mol Biol Cell. 2003;14(12):4805–4812. - PMC - PubMed
    1. Henderson AS, Warburton D, Atwood KC. Location of ribosomal DNA in the human chromosome complement. Proc Natl Acad Sci USA. 1972;69(11):3394–3398. - PMC - PubMed

Publication types

MeSH terms

Substances