. 2013 Dec 24;110(52):21089-94.
doi: 10.1073/pnas.1320999110. Epub 2013 Dec 9.

Genetic disruption of CD8+ Treg activity enhances the immune response to viral infection

Affiliations

Genetic disruption of CD8+ Treg activity enhances the immune response to viral infection

Tobias A W Holderried et al. Proc Natl Acad Sci U S A. .

Abstract

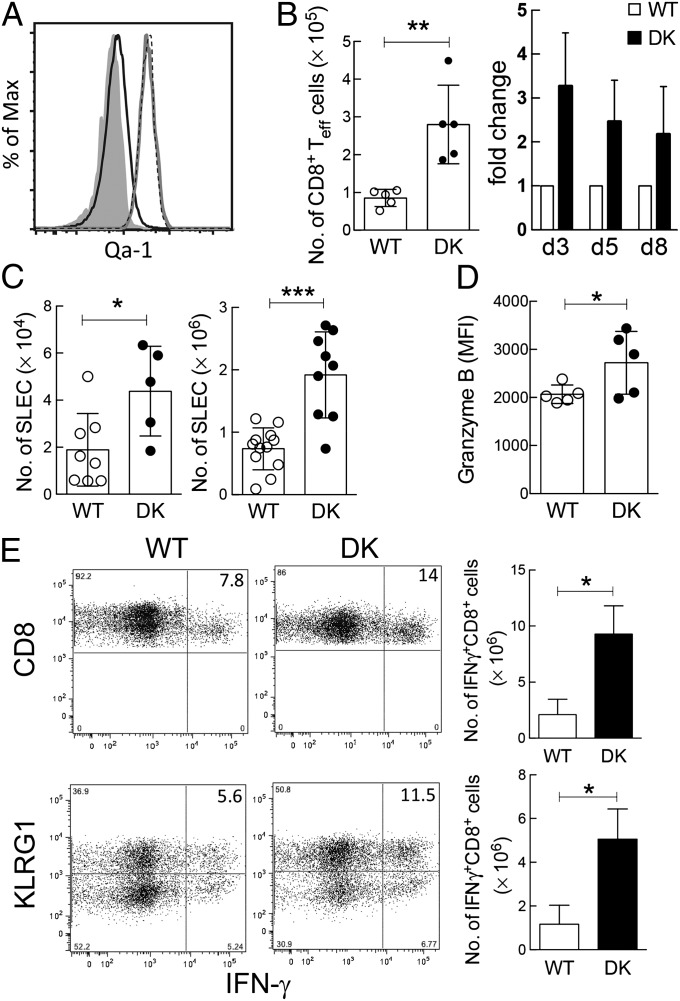
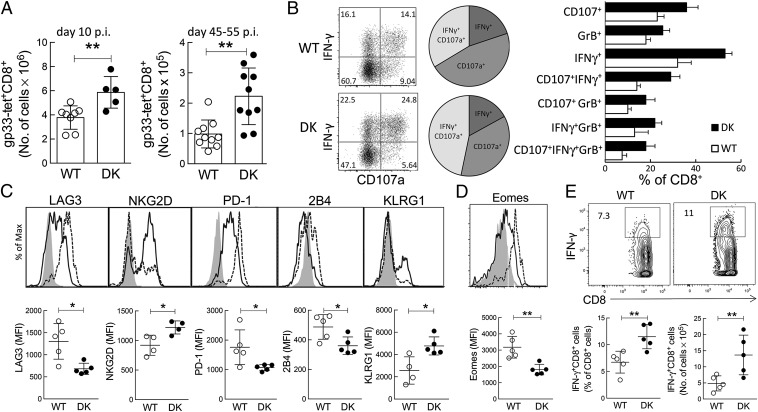
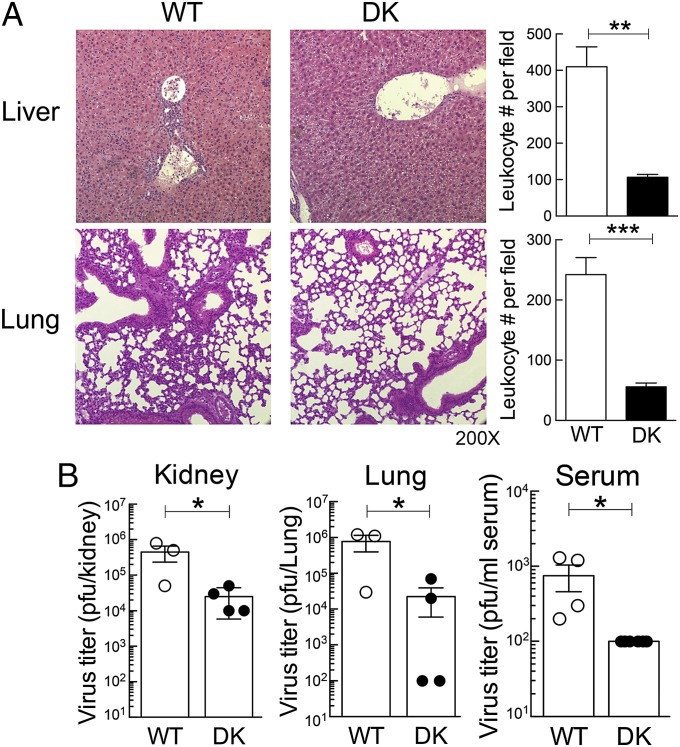
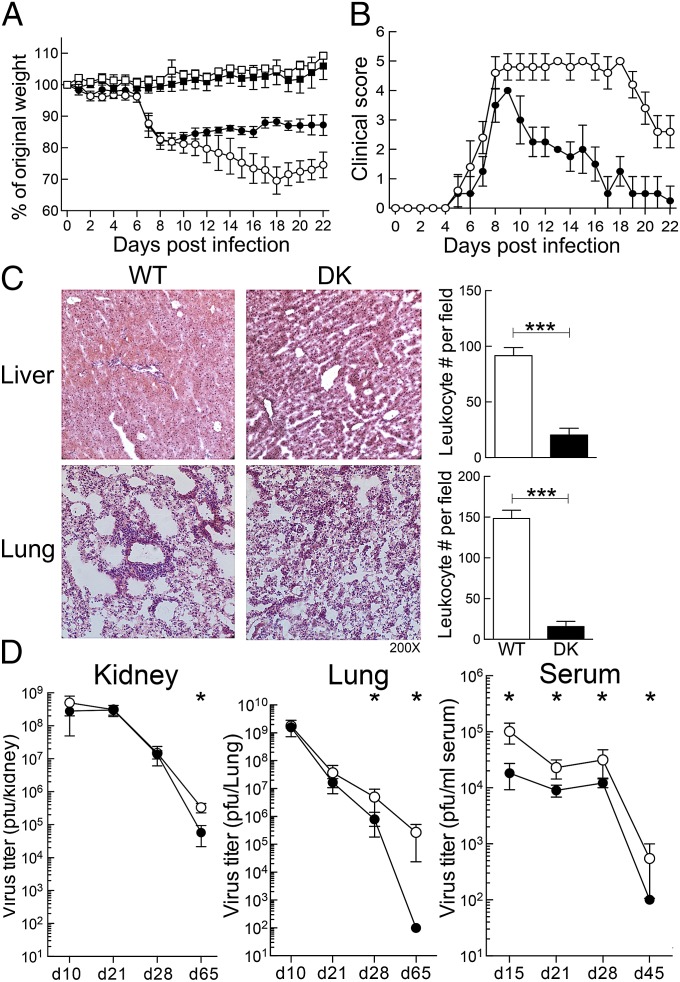
The immunological interactions that regulate the T-cell response to chronic viral infection are insufficiently understood. Here we study a cellular interaction that may enhance the antiviral immune response and constrain immunopathology. We analyze the contribution of Qa-1-restricted CD8(+) regulatory T cells (Treg cells) to antiviral immunity after infection by lymphocytic choriomeningitis virus. These CD8(+) Treg cells recognize and eliminate target cells through an interaction with the murine class Ib MHC molecule Qa-1 (HLA-E in humans). Using Qa-1 mutant mice (B6.Qa-1-D227K [B6-DK]) that harbor a single mutation that abrogates binding of Qa-1 peptide to the CD8-TCR (T-cell receptor) complex, we show that disruption of immune suppression mediated by CD8(+) Treg cells results in robust antiviral immune responses in both acute and chronic viral infection. Enhanced antiviral responses of B6-DK mice were accompanied by increased control of virus, reduced tissue inflammation in the acute phase, and dramatic alleviation of disease in the chronic phase. In addition, CD8(+) effector T cells in B6-DK mice displayed a less exhausted phenotype characterized by decreased expression of programmed cell death 1 (PD-1), LAG3 (CD223), and 2B4 (CD244) and increased expression of NKG2D (CD314) and killer cell lectin-like receptor subfamily G member 1 (KLRG1). Enhanced antiviral immunity in B6-DK mice reflected, in part, reduced inhibition of CD8(+) effector cells by CD8(+) Treg cells. These findings indicate that direct inhibition of effector CD8(+) T cells by Qa-1-restricted CD8(+) Treg cells results in increased disease severity and delayed recovery. These data suggest that depletion or inactivation of CD8(+) Treg cells represents a potentially effective strategy to enhance protective immunity to chronic viral infection.

Keywords: T-cell exhaustion; immune regulation; killer cell Ig-like receptor.


Conflict of interest statement

The authors declare no conflict of interest.

Figures

Fig. 1.
Fig. 1.
Genetic disruption of CD8+ Treg cell activity results in enhanced antiviral CD8+ response during acute LCMV infection. (A) B6-WT and B6-DK mice were infected i.p. with LCMV-Arm (2 × 10⁵ pfu). On day 5 postinfection, LCMV-specific H-2/Db-gp33+ CD44+CD62LCD3+CD8+ T cells and naive gp33CD44CD62L+CD3+CD8+ T cells from spleen were evaluated by flow cytometry for expression of Qa-1. Expression of Qa-1 on naive CD8+ T cells (black line), B6-WT LCMV-specific CD8+ T cells (gray line), and B6-DK LCMV-specific CD8+ T cells (dotted line), as well as Qa-1-isotype staining (gray shading), are shown (n > 3 per group). (B) B6-WT and B6-DK mice were infected i.p. with LCMV-Arm (2 × 10⁵ pfu). On days 3, 5, and 8 postinfection, CD3+CD8+ T cells from the spleens were evaluated by flow cytometry. Total CD62LCD44+CD3+CD8+ effector T-cell numbers in B6-WT and B6-DK mice on day 3 (Left) and fold increase in B6-DK mice of CD62LCD44+CD3+CD8+ effector T cells during the further course of infection (Right) are shown (n > 3 per group per time). (C) B6-WT and B6-DK mice were infected i.p. with LCMV-Arm (2 × 10⁵ pfu). On days 5 and 8 postinfection, virus-specific H-2/Db-gp33+ CD3+CD8+ splenocytes were evaluated by flow cytometry for expression of CD44, CD62L, KLRG1, and CD127. Data shown represent total cell numbers of H-2/Db-gp33+ CD62LCD44+CD127KLRG1+CD8+ T cells at day 5 (Left) and day 8 (Right) postinfection. (D) B6-WT and B6-DK mice were infected i.p. with LCMV-Arm (2 × 10⁵ pfu). On day 8 postinfection, virus-specific H-2/Db-gp33+ CD3+CD8+ splenocytes were evaluated by flow cytometry for expression of granzyme B in virus-specific CD8+ T cells. Data shown represent mean fluorescence intensity day 8 postinfection. (E) (Upper) Representative dot plots of B6-WT and B6-DK mice 8 d after infection with LCMV-Arm . Cells were gated on CD3+ cells, and IFN-γ+ CD8+ splenocytes were compared between the two groups. IFN-γ+CD8+ cell percentage (Left) and number (Right) are shown (n = 3 per group). (Right) IFN-γ production in SLECs from B6-WT versus B6-DK mice was compared. For analysis, splenocytes were gated on CD3+CD8+CD127low cells, and KLRG1 expression was plotted against IFN-γ. Representative dot plots are shown, and the KLRG1highIFN-γ+ cell percentage (Left) and number (Right) are shown (n = 3 per group).
Fig. 2.
Fig. 2.
Increased virus-specific CD8+ T cells on chronic LCMV infection. (A) B6-WT and B6-DK mice were infected i.v. with LCMV clone 13 (1 × 10⁶ pfu). On days 10 and between 45–55 d postinfection, virus-specific H-2/Db-gp33+ CD3+CD8+ splenocytes were evaluated by flow cytometry. Data shown represent total cell numbers during early (Left) and late (Right) stages of chronic infection. (B) B6-WT and B6-DK mice were infected i.v. with LCMV clone 13 (1 × 10⁶ pfu). On day 30 postinfection, total CD8+ T cells were evaluated for degranulation (CD107a) and coexpression of IFN-γ and granzyme B by flow cytometry. (Left) Dot plots for coexpression of CD107a and IFN-γ in B6-WT and B6-DK mice are shown. (Center) Pie charts represent relation of coexpression of IFN-γ, CD107a, and both in B6-WT and B6-DK mice. (Right) Percentages of single-, double-, and triple-coexpression of CD107a, granzyme B, and IFN-γ in CD8+ T cells are compared between WT (white) and B6-DK (black) mice (n > 3 per group). (C) Virus-specific H-2/Db-gp33+ CD3+CD8+ splenocytes were further assessed on day 45 postinfection with LCMV clone 13 for expression of surface markers for CD8+ T-cell memory/exhaustion. Representative histograms gated on WT H-2/Db-gp33+ CD3+CD8+ T cells (dotted line), B6-DK H-2/Db-gp33+ CD3+CD8+ T cells (solid line), and gp33CD44CD62L+CD8+ T (naive) T cells (gray), as well as mean fluorescence intensity (MFI), are shown. (D) Virus-specific H-2/Db-gp33+ CD3+CD8+ splenocytes were assessed on d45 postinfection with LCMV clone 13 for expression of transcription factor Eomes. Representative histograms gated on WT H-2/Db-gp33+ CD3+CD8+ T cells (dotted line), B6-DK H-2/Db-gp33+ CD3+CD8+ T cells (solid line), and gp33CD44CD62L+CD8+ T (naive) T cells (gray), as well as MFI, are shown. (E) IFN-γ expression in CD3+CD8+ splenocytes from WT and B6-DK mice 45 d postinfection with LCMV clone 13 was measured by flow cytometry. Representative dot plots gated on CD3+CD8+ T cells (Upper), as well as comparison between WT and B6-DK CD3+CD8+IFN-γ+ percentage (Lower, Left) and cell number (Lower, Right).
Fig. 3.
Fig. 3.
Effective clearance during acute infection by B6-DK mice is associated with diminished leukocyte infiltration into peripheral tissue. (A) Histopathology of the liver and lung of B6-WT and B6-DK mice is shown. (Right) Leukocyte infiltration of liver and lung per field was enumerated and compared between B6-WT and B6-DK mice. (B) On day 5 after infection with LCMV-Arm (2 × 10⁵ pfu), virus titer in organs of B6-WT and B6-DK mice was determined via standard plaque assay. Viral titer of kidney, lung, and serum are shown as plaque-forming units.
Fig. 4.
Fig. 4.
B6-DK mice develop enhanced antiviral response during chronic infection. (A) B6-WT (○) and B6-DK (●) mice were infected i.v. with 1 × 10⁶ pfu LCMV clone 13 on day 0 or not infected (WT control [□] and DK control [■]). Body weight was measured daily before (day 0) and after infection. Percentage of original body weight is shown (n > 4 per group). (B) Illness scores of B6-WT (○) and B6-DK (●) mice after infection with LCMV-Cl13 are shown. Scores were evaluated as described in Methods (n > 4/group). (C) Histopathology of liver and lung from B6-WT and B6-DK mice on day 55 after LCMV clone 13 infection is shown. (Right) Leukocyte infiltration of liver and lung per field was enumerated and compared between B6-WT and B6-DK mice. (D) During chronic LCMV infection, virus titers in B6-WT (○) and B6-DK (●) mice at the indicated times after infection with LCMV-Cl13 were assessed by standard plaque assay. Course of viral titer is shown in pfu in kidney, lung, and serum.
Fig. 5.
Fig. 5.
Qa-1–restricted inhibition of CD8+ effector cells by CD8+ Treg cells underlies the attenuated antiviral response. (A) CD45.1+Ly49+CD8+ Treg cells and CD45.1+Ly49CD8+ T cells (as controls), as well as B6-WT and B6-DK CD8+CD44CD62L+-naive T cells, were highly purified via FACS sorting and 4 groups of Rag2−/− hosts were transferred with CD45.1+Ly49+CD8+ Treg cells and WT CD8+CD44CD62L+-naive T cells, CD45.1+Ly49+CD8+ Treg cells and B6-DK CD8+CD44CD62L+-naive T cells, CD45.1+Ly49CD8+ T cells and B6-WT CD8+CD44CD62L+-naive T cells, or CD45.1+Ly49CD8+ T cells and B6-DK CD8+CD44CD62L+-naive T cells. After cell transfer mice were infected with LCMV-Arm i.p. (2 × 10⁵ pfu). On day 5, CD45.1 splenic mononuclear cells were assessed for antiviral immune response. Shown are total cell numbers of CD45.1CD3+CD8+CD62LCD44+CD127KLRG1+ SLECs (n = 3 per group). (B) In vivo LCMV-Arm activated Thy1.1+Ly49+CD122+CD8+ Treg cells were cotransferred with in vivo activated and Celltrace Violet-labeled B6-WT CD45.1+P14+CD8+ T cells and Celltrace Violet-labeled B6-DK CD45.2+P14+CD8+ T cells into the same Rag2−/− host at a 2:1:1 ratio. Twelve hours after transfer, host mice were immunized i.v. with 0.5 μg gp33-peptide/mouse. (Left) Seventy-two hours after immunization, proliferation of LCMV-specific B6-WT (gray shading) and B6-DK (solid line) CD8+ T cells were evaluated by Celltrace Violet dilution. (Right) Percentage of B6-WT and B6-DK LCMV-specific CD8+ T cells that proliferated for >6 generations is shown (n = 3 per group).

References

    1. Rehermann B. Pathogenesis of chronic viral hepatitis: Differential roles of T cells and NK cells. Nat Med. 2013;19(7):859–868. - PMC - PubMed
    1. Jenner E. On the Origin of the Vaccine Inoculation. London, UK: Shury; 1801. - PMC - PubMed
    1. Rouse BT, Lukacher AE. Some unmet challenges in the immunology of viral infections. Discov Med. 2010;10(53):363–370. - PMC - PubMed
    1. Jost S, Altfeld M. Control of human viral infections by natural killer cells. Annu Rev Immunol. 2013;31:163–194. - PubMed
    1. Terilli RR, Cox AL. Immunity and hepatitis C: A review. Curr HIV/AIDS Rep. 2013;10(1):51–58. - PMC - PubMed

Publication types

MeSH terms

Substances

LinkOut - more resources