. 2014 Mar 14;289(11):7856-72.
doi: 10.1074/jbc.M113.505065. Epub 2013 Dec 9.

Overexpression of c-Met and CD44v6 receptors contributes to autocrine TGF-β1 signaling in interstitial lung disease

Affiliations

Overexpression of c-Met and CD44v6 receptors contributes to autocrine TGF-β1 signaling in interstitial lung disease

Shibnath Ghatak et al. J Biol Chem. .

Abstract

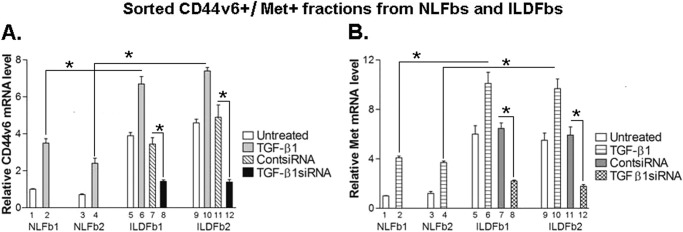
The hepatocyte growth factor (HGF) and the HGF receptor Met pathway are important in the pathogenesis of interstitial lung disease (ILD). Alternatively spliced isoforms of CD44 containing variable exon 6 (CD44v6) and its ligand hyaluronan (HA) alter cellular function in response to interaction between CD44v6 and HGF. TGF-β1 is the crucial cytokine that induces fibrotic action in ILD fibroblasts (ILDFbs). We have identified an autocrine TGF-β1 signaling that up-regulates both Met and CD44v6 mRNA and protein expression. Western blot analysis, flow cytometry, and immunostaining revealed that CD44v6 and Met colocalize in fibroblasts and in tissue sections from ILD patients and in lungs of bleomycin-treated mice. Interestingly, cell proliferation induced by TGF-β1 is mediated through Met and CD44v6. Further, cell proliferation mediated by TGF-β1/CD44v6 is ERK-dependent. In contrast, action of Met on ILDFb proliferation does not require ERK but does require p38(MAPK). ILDFbs were sorted into CD44v6(+)/Met(+) and CD44v6(-)/Met(+) subpopulations. HGF inhibited TGF-β1-stimulated collagen-1 and α-smooth muscle cell actin expression in both of these subpopulations by interfering with TGF-β1 signaling. HGF alone markedly stimulated CD44v6 expression, which in turn regulated collagen-1 synthesis. Our data with primary lung fibroblast cultures with respect to collagen-1, CD44v6, and Met expressions were supported by immunostaining of lung sections from bleomycin-treated mice and from ILD patients. These results define the relationships between CD44v6, Met, and autocrine TGF-β1 signaling and the potential modulating influence of HGF on TGF-β1-induced CD44v6-dependent fibroblast function in ILD fibrosis.

Keywords: Cd44; Collagen; Fibroblast; Pulmonary Fibrosis; Transforming Growth Factor beta (TGFbeta).


Figures

FIGURE 1.
FIGURE 1.
Levels of CD44v6 and Met protein synthesis in cultured lung fibroblasts from normal subjects and ILD patients. A–H, representative Western blots for Met (A and B) and CD44v6 (C and D) are shown for lysates from NLFb1–3 and ILDFb1–3 cultures treated with control shRNA (A–D) or Met shRNA (A and B) or CD44v6 shRNA (C and D), as described under “Experimental Procedures.” E, the representative results for three NLFbs and three ILDFbs are shown. Met and CD44v6 protein levels were quantitated for three NLFbs (white bars) and three ILDFbs (black bars) from experiments in A–D. The bar graphs show the results of scans of Western blots from three independent experiments (n = 9) normalized to β-tubulin and then normalized to untreated samples (100 arbitrary units). Data (as means ± S.D. (error bars)) are expressed relative to those in untreated samples (100 arbitrary units). F, ILDFb1 and ILDFb2 cultures in QBSF-51 medium were treated with 10 ng/ml TGF-β1 for 24 h, and cell lysates and total RNA were isolated. Cell lysates were immunoblotted for CD44v6 and CD44s and reprobed for β-actin. G and H, qRT-PCR analyses of RNAs from NLFbs and ILDFbs treated with or without 10 ng/ml TGF-β1 for 24 h, followed by transfection with control shRNA or CD44v6 shRNA. After 48 h of transfection, total RNAs were isolated, and steady state CD44s and CD44v6 mRNA levels were analyzed by qRT-PCR. The data in these experiments (G and H) are from three sets of each lung fibroblast population with three independent experiments for each mRNA level and are expressed as the means ± S.D. Statistical analysis was done using analysis of variance as applicable. p ≤ 0.05 (*) was considered statistically significant.
FIGURE 2.
FIGURE 2.
Localization of CD44v6 and Met receptors by immunocytochemistry. Representative micrographs show the localization of Met receptor (green), CD44v6 receptor (red), and nuclear stain (blue) in the lung sections from saline- or bleomycin-treated mice (21 days after tracheal instillation of 0.015 units/mouse) (A) or from an ILD patient and a normal subject (B). The mouse and human images are at the same magnification (scale bars, 100 μm).
FIGURE 3.
FIGURE 3.
Flow cytometric separation of cells with and without CD44v6 and Met receptors. Representative analyses show the sorted distributions of NFLb1 and -2 populations (A and B) and ILDFb1 and -2 populations (C and D) either unstained (A and B) or stained (C and D) with antibodies to Met and CD44v6. E, graphical presentation of the CD44v6+/Met+ and CD44v6/Met+ populations as a percentage of unsorted cells is shown for three independent experiments for the NFLbs and ILDFbs. Data are expressed as means ± S.D. (error bars). Statistical analyses were done using Student's t test with Mann-Whitney modification as applicable. p ≤ 0.05 (*) was considered statistically significant.
FIGURE 4.
FIGURE 4.
Levels of Met and CD44v6 mRNA expression in CD44v6+/Met+ FACS-sorted populations of NLFbs and ILDFbs. A and B, CD44v6+/Met+ sorted NLFbs and ILDFbs were cultured without or with 10 ng/ml TGF-β1 for 24 h and analyzed for CD44v6 mRNA and Met mRNA. CD44v6+/Met+ sorted ILDFbs were transfected with control siRNA (scrambled siRNA) or TGF-β1 siRNA and cultured for 96 h. Total RNAs were extracted from the transfected and treated cell populations and analyzed for Met and CD44v6 by qRT-PCR as described under “Experimental Procedures.” The data in these experiments (A and B) are from three sets of each lung fibroblast population with three independent experiments for each mRNA level and are expressed as the means ± S.D. (error bars). Statistical analyses were done using Student's t test with Mann-Whitney modification as applicable. p ≤ 0.05 (*) was considered statistically significant.
FIGURE 5.
FIGURE 5.
TGF-β1 synthesis by ILDFbs and NLFbs. ILDFb1–3 and NLFb1–3 cultures were incubated for different times and assayed for the bioactive form of TGF-β1 by an ELISA as described under “Experimental Procedures.” The data represent three independent experiments for each set of lung fibroblasts. Error bars, means ± S.D.
FIGURE 6.
FIGURE 6.
TGF-β1 autoregulates Met and CD44v6 expression in NLFbs and ILDFbs. A, Western blots (WB) show increased Met expression when NLFbs were treated with increased amounts of TGF-β1 for 16 h as described under “Experimental Procedures.” Western blots of β-tubulin were used to confirm equal protein loading. Western blots show increased Met (B) and CD44v6 (C) with time following TGF-β1 treatment in NLFb1s. D, Western blots show that Met is suppressed when TGF-β1 is silenced in ILDFb1 and ILDFb3 cultures. Cultures were transfected with scrambled siRNA (Cont siRNA) or TGF-β1 siRNA and incubated for 16 h as described under “Experimental Procedures.” E, qRT-PCR data show that the mRNA levels for CD44v6 and Met are decreased when TGF-β1 is silenced in ILDFb1 and ILDFb2 cultures treated as described in D. The data in these experiments are representative of three independent experiments for each set of cultured fibroblasts. The mRNA analyses for each separate experiment were repeated three times. Data are expressed as means ± S.D. (error bars). Statistical analyses were done using Student's t test with Mann-Whitney modification as applicable. p ≤ 0.05 (*) was considered statistically significant.
FIGURE 7.
FIGURE 7.
The effect of blocking TGF-β1 on cell proliferation in cultured ILDFbs and NLFbs. A, TGF-β1 increases cell proliferation in NLFb3s and ILDFb3s, and silencing TGF-β1 decreases cell proliferation in TGF-β1-stimulated NLFb3 and ILDFb3 cultures that were grown and treated as described under “Experimental Procedures.” Cell proliferation is shown by BrdU uptake (red). Nuclei are stained blue. B, cell proliferation levels were measured using the BrdU cellular ELISA kit and are expressed as a percentage of untreated cells. Error bars, means ± S.D.
FIGURE 8.
FIGURE 8.
The effect of ERK, Met, and CD44v6 on cell proliferation in cultured ILDFbs and NLFbs. A, ILDFb3 cultures were pretreated with the ERK inhibitor U0126 (10 μm), the PI3K/AKT inhibitor LY29402 (20 μm), or the p38 inhibitor SC68376 (10 μm) or transfected with control, CD44v6, or Met siRNA, as described under “Experimental Procedures.” The cell lysates were immunoblotted (WB) for pERK1/2, pAKT (Ser-473), pp38MAPK, and β-actin (as an internal standard). They were also immunoblotted for total ERK, AKT, and p38MAPK, which did not change from the untreated controls after treatment (data not shown). B, statistical analyses of pERK, pAKT, and pp38MAPK protein levels from the experiment in A were quantitated by scanning densitometry and corrected for the levels of β-actin for three independent sets of ILDFb3 cultures. Data (as means ± S.D. (error bars)) are expressed relative to untreated samples (100 arbitrary units). Statistical analyses of the Western blots for different treatments in the same group were done using Student's t test with Mann-Whitney modification. p ≤ 0.05 (*) was considered statistically significant. C, ILDFb3s were grown and transfected with control, CD44v6, Met, or TGF-β1 siRNA or their combination as shown in the figure and as described under “Experimental Procedures.” Cell proliferation levels were measured using the BrdU cellular ELISA kit and are expressed as the ratio to untreated cells. D, ILDFb3s were pretreated with U0126, LY294002, or SC68376 or were transfected with control, CD44v6, or Met siRNA and cultured as in A. Cell proliferation levels were measured using the BrdU cellular ELISA kit and are expressed as the ratio to untreated cells. E, NLFb2s were grown to ∼75% confluence and treated with U0126, LY294002, or SC68376 as in A. Cell proliferation was measured using the BrdU cellular ELISA kit. The data are the means ± S.D. The data in these experiments (C–E) are representative of three independent experiments (n = 3) for each set of cultured fibroblasts. Statistical analyses of the cell proliferation data (C–E) for different treatments in the same group were done using Student's t test with Mann-Whitney modification. p ≤ 0.05 (*) was considered statistically significant.
FIGURE 9.
FIGURE 9.
HGF synthesis by ILDFbs and NLFbs. ILDFb1 and -2 and NLFb1 and -2 cultures were incubated for different times and assayed for HGF by an ELISA as described under “Experimental Procedures.” The data represent three independent experiments for each set of lung fibroblasts. Error bars, means ± S.D.
FIGURE 10.
FIGURE 10.
HGF blocks TGF-β1-induced α-SMA and collagen-1 expression in cell lysates from CD44v6+/Met+ and CD44v6/Met+ subpopulations of ILDFb cultures. In all of the experiments, every 12 h, the media were changed with fresh media containing freshly added HGF (50 ng/ml) and/or TGF-β1 (10 ng/ml). A, CD44v6+/Met+ subpopulations from the three sets of ILDFbs were incubated without or with HGF for 72 h. Cell lysates (20 μg) were analyzed for collagen-1, α-SMA, and β-tubulin by Western blots. B, CD44v6+/Met+ and CD44v6/Met+ subpopulations of ILDFb1s were incubated without or with HGF and/or TGF-β1 for the indicated times. Cell lysates were analyzed for α-SMA and β-tubulin by Western blots. C, α-SMA protein levels from the experiment in B were quantitated by scanning densitometry and corrected for the levels of β-tubulin for CD44v6+/−/Met+ sorted fractions from the three sets of ILDFbs. Data (as means ± S.D. (error bars)) are expressed relative to those in untreated samples (100 arbitrary units). Statistical analyses of the Western blots for different treatments in the same group were done using Student's t test with Mann-Whitney modification. p ≤ 0.05 (*) was considered statistically significant. D, expression of collagen-1 protein and β-actin (loading control) were determined from cell lysates (20 μg) by Western blotting (A). E and F, cultures of the CD44v6+/Met+ and CD44v6/Met+ ILDFb1 subpopulations were treated with TGF-β1 without or with HGF for 72 h and analyzed for collagen-1 and β-actin by Western blots of cell lysates (40 μg). G and H, qRT-PCR analysis of collagen-1 (α1 and α2) mRNA in CD44v6+/Met+ and CD44v6/Met+ sorted fractions of ILDFb1 are shown. Data are presented as -fold level of unsorted ILDFbs. I and J, qRT-PCR analysis of collagen-1 (α1) mRNA in CD44v6+/Met+ and CD44v6/Met+ sorted fractions of ILDFb1s treated with or without 50 ng/ml HGF for 72 h and/or TGF-β1 for 72 h are shown. Data are presented as -fold level of untreated CD44v6+/Met+, and CD44v6/Met+ ILDFbs, respectively. G–J, error bars (means ± S.D.).
FIGURE 11.
FIGURE 11.
HGF-mediated reduction in α-SMA expression in ILDFbs is through an ERK1/2 pathway. In all of the experiments, every 12 h, the media were changed with fresh media containing freshly added HGF (50 ng/ml) and/or TGF-β1 (10 ng/ml). A, stimulation of the CD44v6+/Met+ subpopulation of LDFb1s with HGF for 30 min results in activation of pAKT, pERK1/2, and pp38, as shown by Western blots (WB) with phospho-specific antibodies. Total AKT, ERK1/2, and p38 protein levels were also assessed as controls for protein loading. B, CD44v6+/Met+ ILDFb1s were pretreated with or without vehicle (DMSO) or with U0126, LY29402, or SC68376 for 30 min. The cells were washed after treatment with inhibitors for 30 min and then treated with HGF for 72 h followed by TGF-β1 for 72 h. α-SMA expression was analyzed by Western blots. Results shown are representative of three independent experiments. C, α-SMA protein levels for the different treatments in B were quantitated by scanning densitometry and corrected for the levels of β-tubulin from three sets of ILDFbs. Data (as means ± S.D. (error bars)) are expressed relative to untreated samples (100 arbitrary units). D, ILDFb2 cells were transfected with HGF expression plasmids, the transfectants were allowed to grow for 48 or 72 h. The total protein was extracted, and Western blots were probed for Smad7 protein and β-actin. Results are representative of three independent experiments. E, ILDFb2 cells were treated with 10 ng/ml TGF-β1 for 3 or 24 h, or they were first transfected with HGF expression plasmids, and the transfectants were allowed to grow for 72 h followed by treatment with 10 ng/ml TGF-β1 for 3 h. Nuclear extracts were prepared (see “Experimental Procedures”), and Western blots were probed for phosphorylated Smad2 protein and β-actin. Results are representative of three independent experiments.
FIGURE 12.
FIGURE 12.
HGF promotes expression of CD44v6 in ILDFbs, which increases collagen matrix deposition in response to TGF-β1 in the CD44v6+/Met+ subpopulation. In the experiments shown in A and C, every 12 h, the media were changed with fresh media containing freshly added HGF (50 ng/ml) and/or TGF-β1 (10 ng/ml). A, CD44v6+/Met+ subpopulations of ILDFb1s were incubated without or with HGF and/or TGF-β1 for the indicated times. Cell lysates were analyzed for CD44v6 and β-tubulin by Western blots. B, Western blots (WB) of immunoprecipitates (IP) with anti-CD44v6 and anti-TGF-β1R1 were probed reciprocally for TGF-β1R1 and CD44v6 as described under “Experimental Procedures.” C, cultures of NLFb3s and ILDFb3s were treated without or with TGF-β1 for 72 h and with control, CD44v6, or TGF-β1 siRNA and analyzed by Western blots for collagen-1, HSP47, and β-tubulin, as described under “Experimental Procedures.” The data are representative of three independent experiments for each set of cultures.
FIGURE 13.
FIGURE 13.
Localization of CD44v6 (red), collagen-1 (green), and nuclei (DAPI) (blue) in sections of lungs from mice treated with bleomycin or saline. Representative micrographs show Masson staining for collagen expression (top panels) and for localization of collagen-1 (green), CD44v6 (red), and nuclei (blue) in the lung sections of mice 21 days after treatment with bleomycin (middle panels) or saline (bottom panels). The micrographs are representative of sections from three mice in each group. The images in each panel are at the same magnification (scale bars, 100 μm).
FIGURE 14.
FIGURE 14.
Localization of CD44v6 (red), collagen 1 (green), and nuclei (DAPI) (blue) in sections of lungs from a normal individual and an ILD patient. Representative micrographs show Masson staining for collagen expression (top panels) and for localization of collagen-1 (green), CD44v6 (red), and nuclei (blue) in the lung sections from the ILD patient (middle panels) or the normal subject (bottom panels). The micrographs are representative of sections from three subjects in each group. The images in each panel are at the same magnification (scale bars, 100 μm).
FIGURE 15.
FIGURE 15.
Model for involvement of CD44v6 and Met due to autocrine TGF-β1 signaling in ILDFbs. The elevated HGF expression at the onset of chronic injury may compensate and support a regenerative process (62), but repetitive lung injury results in overexpression of TGF-β1 and TGF-β1-induced autocrine signaling that induces a sustained expression of CD44v6 and Met that activates ILDFbs with subsequent increased collagen matrix synthesis. In normal lung fibroblasts, TGF-β1 treatment also activates the Met and CD44v6 receptors. Although HGF interferes with TGF-β1 signaling, in view of the fact that HGF decreases in a reciprocal manner to the increase in TGF-β1 level (for reference, see “Conclusion”) during the progression of chronic injury in ILD fibrosis, TGF-β1-induced CD44v6 and Met can have a crucial role for the sustained ILDFb fibrogenic activation.

References

    1. Kajihara I., Jinnin M., Makino T., Masuguchi S., Sakai K., Fukushima S., Maruo K., Inoue Y., Ihn H. (2012) Overexpression of hepatocyte growth factor receptor in scleroderma dermal fibroblasts is caused by autocrine transforming growth factor β signaling. Biosci. Trends 6, 136–142 - PubMed
    1. Schnaper H. W., Hayashida T., Hubchak S. C., Poncelet A. C. (2003) TGF-β signal transduction and mesangial cell fibrogenesis. Am. J. Physiol. Renal Physiol. 284, F243–F252 - PubMed
    1. Ziyadeh F. N., Hoffman B. B., Han D. C., Iglesias-De La Cruz M. C., Hong S. W., Isono M., Chen S., McGowan T. A., Sharma K. (2000) Long-term prevention of renal insufficiency, excess matrix gene expression, and glomerular mesangial matrix expansion by treatment with monoclonal antitransforming growth factor-β antibody in db/db diabetic mice. Proc. Natl. Acad. Sci. U.S.A. 97, 8015–8020 - PMC - PubMed
    1. Han D. C., Hoffman B. B., Hong S. W., Guo J., Ziyadeh F. N. (2000) Therapy with antisense TGF-β1 oligodeoxynucleotides reduces kidney weight and matrix mRNAs in diabetic mice. Am. J. Physiol. Renal Physiol. 278, F628–F634 - PubMed
    1. Ihn H., Yamane K., Kubo M., Tamaki K. (2001) Blockade of endogenous transforming growth factor β signaling prevents up-regulated collagen synthesis in scleroderma fibroblasts. Association with increased expression of transforming growth factor β receptors. Arthritis Rheum. 44, 474–480 - PubMed

Publication types

MeSH terms