. 2013 Nov 26:7:160.
doi: 10.3389/fncir.2013.00160. eCollection 2013.

Next-generation transgenic mice for optogenetic analysis of neural circuits

Affiliations

Next-generation transgenic mice for optogenetic analysis of neural circuits

Brent Asrican et al. Front Neural Circuits. .

Abstract

Here we characterize several new lines of transgenic mice useful for optogenetic analysis of brain circuit function. These mice express optogenetic probes, such as enhanced halorhodopsin or several different versions of channelrhodopsins, behind various neuron-specific promoters. These mice permit photoinhibition or photostimulation both in vitro and in vivo. Our results also reveal the important influence of fluorescent tags on optogenetic probe expression and function in transgenic mice.

Keywords: cerebellum; channelrhodopsin; cortex; hippocampus; optogenetics; photoinhibition; photostimulation; pons.


Figures

Figure 1
Figure 1
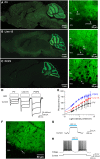
Expression of eNpHR2.0 in Thy1-eNpHR2.0 line 4 transgenic mouse brain. (A) Sagittal section from an adult transgenic mouse brain (Thy1-eNpHR2.0 line 4). (B) Expression of eNpHR2.0 in cortical pyramidal cells (line 2). (C) Expression of eNpHR2.0 in anteroventral thalamic nucleus (line 2). (D) Expression of eNpHR2.0 in CA1 pyramidal cells. (E) Expression of eNpHR2.0 in cerebellar mossy fibers (line 2); ML, molecular layer; PC, Purkinje cell layer; GCL, granule cell layer.
Figure 2
Figure 2
Illumination evokes outward photocurrents and inhibition of action potential firing in cortical layer 5 pyramidal cells from Thy1-eNpHR2.0 line 4 mice. (A) 1-s long light flash (575 nm) induced photocurrents that increased in amplitude with brighter light flashes. (B) Relationship between photocurrent amplitude and light intensity. Points indicate means ± sem of eighteen neurons and curve is a fit of the Hill equation. (C) Light pulses of varying intensity elicited graded hyperpolarization and inhibition of action potentials firing in a pyramidal cell.
Figure 3
Figure 3
Photoinhibition increases over development in Thy1-eNpHR2.0 mouse lines. (A) Photocurrents induced by a series of light flashes (575 nm, 1 s duration) in pyramidal neurons in cortical slices from Thy1-eNpHR2.0 mice of the indicated ages. (B) Relationship between photocurrent amplitude and light intensity determined for mice of different ages. Points indicate means ± sem (P13: n = 4; P17: n = 9; P49–56: n = 7). Curves are fits of the Hill equation. (C) Relationship between light intensity and degree of inhibition of action potential firing at the indicated ages. Photoinhibition is greater in older mice, due to a higher level of eNpHR2.0 expression.
Figure 4
Figure 4
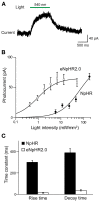
Comparison of photocurrents generated by NpHR and eNpHR2.0. (A) Illumination (1 s duration; 186 mW/mm2) evokes outward photocurrent in pyramidal cell from Thy1-NpHR mice. (B) Comparison of photocurrents induced by varying light intensity in neurons from Thy1-NpHR (age P13–36; n = 6) and Thy1-eNpHR 2.0 (P17 line 4, n = 9) mice. (C) Both the activation (rise time constant) and deactivation (decay time constant) of photocurrents is slower for NpHR 1.0 than for NpHR 2.0 (mice line 2 and 4 together). Data for Thy1-NpHR mice modified from Zhao et al. (2008). Measured time constants for activation did not take into account slow inactivation of the currents, which should have little effect because activation is much more rapid than inactivation.
Figure 5
Figure 5
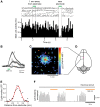
In vivo photoinhibition of neuronal activity and limb movement in Thy 1-eNpHR2.0 mice. (A) Top—Raster display of multiunit activity (MUA) recorded from a single microelectrode in the motor cortex; Bottom—histogram of average MUA frequency. Spot illumination (559 nm) within 0.1 mm of the tip of the recording electrode inhibited spontaneous MUA recorded by the electrode, while illumination with the same spot ~1 mm away from the recording site did not. (B) Local field potentials (LFPs) caused by activation of eNpHR2.0, recorded at the location indicated by the red circle in (C), in response to light spots positioned at the numbered locations in (C). (C) Map of amplitudes of LFPs evoked when eNpHR2.0 was activated. Each of the 32 × 32 pixels in the map was illuminated (559 nm) and the amplitude of the LFP evoked at each pixel was encoded into the pseudocolor scale shown at right. (D) Schematic dorsal view of the cortical surface; boxed region is the photostimulation mapping area and the magenta square denotes the bregma. (E) Line scan across the map shown in (C) yields the spatial range of photoinhibition, which was 0.65 mm (full-width at half maximum) in this experiment. (F) Left forelimb movements were induced by microstimulation at times indicated by arrowheads. Whole-field illumination (594 nm) at the time indicated by orange bars caused a pronounced photoinhibition of forelimb movements.
Figure 6
Figure 6
Expression of VChR1 in transgenic mouse brain. (A) Sagittal section from a Thy1-VChR1 transgenic mouse brain (line 8, age P29), revealing widespread expression of VChR1 in many brain regions. (B–D) Expression of VChR1 in neurons within indicated brain regions.
Figure 7
Figure 7
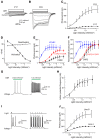
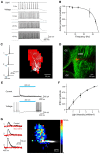
Photostimulation of cortical pyramidal cells via VChR1. (A) Illumination (540 nm, 1 s duration) evokes inward photocurrents (bottom) in pyramidal cell in a cortical slice from a P17 Thy1-VChR1 mouse (line 8). The amplitude of the photocurrent varies with the intensity of the light pulse (top). (B) Same experiment in a neuron from a P23 mouse elicits larger photocurrents. (C) Relationship between photocurrent amplitude and light intensity for P17 (n = 4) and P23 (n = 8) mice. Smooth curves are fits of Hill equation. (D) Dependence of photocurrent activation and deactivation time constants on the intensity of the light pulse. Measured time constants for activation did not take into account slow inactivation of the currents, which should have little effect because activation is much more rapid than inactivation. (E) Comparison of relationship between light intensity (480 nm) and absolute photocurrent amplitude for ChR2, ChR2-H134R, and VChR1. (F) Comparison of relationship between light intensity (480 nm) and normalized photocurrent amplitude for ChR2, ChR2-H134R, and VChR1. VChR1 requires an order of magnitude lower light level for half activation, even at 480 nm. (G) Photostimulation (540 nm) increased action potential frequency in neurons expressing VChR1, with brighter stimuli evoking more action potentials (line 8 mice). (H) Relationship between light intensity and number of light-evoked action potentials in slices from P23 mice (line 8, n = 8). Curve is fit of the Hill equation. (I) Prolonged depolarization associated with VChR1 activation. Left—a brief light flash (5 ms duration; 1.27 mW/mm2) caused a prolonged membrane potential depolarization and repetitive action potential firing. Right—Repeated brief light flashes (6 Hz) induced a sustained depolarization and firing of bursts of action potentials. (J) Relationship between light intensity and photocurrent amplitude for responses measured in neurons from line 8 (n = 8) and line 4 (n = 4) mice (both groups age P23).
Figure 8
Figure 8
Neuronal circuit mapping with Thy1-VChR1 transgenic mice. (A–C) Mapping the light sensitivity of a VChR1-expressing CA1 pyramidal neuron in a hippocampal slice (line 8). (A) 2-photon image of a pyramidal neuron filled with Alexa 594 dye; patch pipette is to the right. The numbers on the cell image indicate locations where the responses shown in B were evoked. (B) Changes in membrane potential evoked by laser light spots (559 nm; 27 μW) positioned at the sites indicated in (A). Only illumination near the cell body evoked action potentials (trace 1). Bar below the traces indicates the time of illumination (8 ms). (C) Scanning the light spot across the specimen revealed locations where light-induced depolarizations were evoked; pseudocolor scale at right indicates the amplitude of these responses. Red pixels reflect regions where action potentials were evoked. (D–F) Mapping of local excitatory circuits within the nucleus reticularis tegmenti pontis (NRTP; line 8). (D) Structure of NRTP neuron filled with Alexa 594 dye. The numbers indicate locations where photostimulation evoked the synaptic responses shown in (E). (E) Light-induced postsynaptic currents (holding potential = −70 mV), detected when a laser light spot (559 nm, 280 μW) was positioned at the locations indicated in (F). Black traces indicate responses recorded in control conditions and red traces indicate responses measured after treatment with kynurenic acid (2 mM). Bars above traces indicate time of illumination. (F) Map of locations where light evoked EPSCs; the magnitude of these currents is indicated by the pseudocolor scale at right.
Figure 9
Figure 9
Comparison of ChR2 tagged with mCherry and EYFP. (A,B) Sagittal sections from the whole brain (A) and cerebellum (B) of a PV-ChR2-mCherry mouse. (C,D) Images of sagittal sections from the whole brain (C) and cerebellum (D) of a PV-ChR2-EYFP mouse. (E) Peak photocurrents (lower traces) induced by light (480 nm; top) in Purkinje cells from ChR2-mCherry (middle) or ChR2-EYFP mice (bottom). Light intensity was 4.5 mW/mm2 for ChR2-mCherry and 5.3 mW/mm2 for EYFP. (F) Relationship between light intensity and photocurrent amplitude for the two lines (n = 8 cells for ChR2-mCherry and n = 4 for ChR2-EYFP). Error bars denote sem.
Figure 10
Figure 10
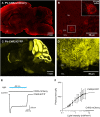
Mild photostimulation with ChR2 tagged with tdTomato. (A) Sagittal brain section from a Thy1-hChR2-tdTomato mouse. (B) Higher-resolution image of cortical pyramidal cells. (C) Photocurrents (bottom) evoked by light pulses (top, 480 nm, 100 ms duration) in a pyramidal cell from a cortical slice from ChR2-tdTomato mouse. (D) Relationship between light intensity and photocurrent amplitude in cortical neurons (n = 7; means ± sem). Smooth curve is fit of Hill equation. (E) Changes in membrane potential evoked by brief (10 ms, 480 nm) light flashes in a cortical pyramidal neuron. Depolarizations typically were too small to evoke action potentials. (F) Relationship between light intensity and membrane potential depolarization in cortical neurons (n = 2; means ± sem). Smooth curve is fit of Hill equation. (G) Synaptic currents evoked in a cortical pyramidal neuron that expressed minimal ChR2-tdTomato. When the slice was illuminated with 480 nm light, multiple EPSCs were elicited during the light flash (750 ms duration). Traces indicate responses to five repeated exposures to the same light stimulus.
Figure 11
Figure 11
Photostimulation of Purkinje cells in 3 lines of ChR2 transgenic mice. (A–C) Images of ChR2-EYFP fluorescence in sagittal sections from brains of PV, Line 15 and PCP2 mice. Left—whole-brain images. Right: high magnification images showing ChR2-EYFP expression in cerebellar molecular layer interneurons (MLI), pinceau terminals and Purkinje neurons (PC). ML, molecular layer; PCL, Purkinje cell layer; GCL, granular cell layer. (D) Photocurrents (bottom) elicited by light pulses (top) in Purkinje cells in cerebellar slices from the 3 mouse lines (for information see Table 1). (E) Relationship between photocurrent amplitude and light intensity; curves are fits of the Hill equation. (PV, n = 4; Line 15, n = 5; PCP2, n = 11). (F) Expression of Arch-EGFP in cerebellar Purkinje cells. (G) Outward photocurrent induced in a Purkinje cell by illumination (460 nm; 29.6 mW/mm2). Holding potential was −60 mV. (H) Photoinhibition of Purkinje cell activity by blue light (460 nm; 144 mW/mm2). Same cell as in (G).
Figure 12
Figure 12
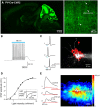
Photostimulation of Purkinje cells allows mapping of DCN inhibitory circuits. (A) Action potentials evoked in a Purkinje cell from PV mouse line by repetitive light flashes (480 nm, 11.7 mW/mm2, 10 ms duration) applied at various frequencies. (B) Relationship between photostimulus frequency and probability of evoking action potentials in a Purkinje cell. Smooth curve is the fit of a Lorentzian function with a cut-off frequency of 47 Hz (n = 3). (C) Mapping the light sensitivity of a ChR2-expressing Purkinje cell in a cerebellar slice (PV line). Left—Action potentials evoked by brief (405 nm, 0.27 mW, 4 ms duration) laser light spots. Numbers represent locations indicated by the numbered pixels in the image at right. Bar below the traces indicates the time of illumination (8 ms). Right—Scanning the light spot across the slice revealed locations (red pixels) where light evoked action potentials in the Purkinje cell. (D) Image showing ChR2-YFP expression in DCN and surrounding cerebellar cortex (CC). Red shows image of dye-filled DCN neuron. (E) Light-induced IPSC (upper) and IPSP (lower) measured in a DCN neuron in response to 2 s illumination (480 nm, 11.7 mW/mm2) of a cerebellar slice. (F) Relationship between light intensity (405 nm, 6 ms duration) and IPSC amplitude measured in DCN neurons (n = 6). Curve is a fit of the Hill equation. (G) Optogenetic mapping of inhibitory inputs to a DCN neuron. The amplitude of light-evoked IPSCs (left, black traces) recorded at the indicated locations (image) was mapped in the pseudocolor scale shown at right. Responses were blocked by bicuculline (red traces), confirming that they are IPSCs. Laser pulses were 405 nm, 0.48 mW, and 4 ms duration.
Figure 13
Figure 13
Mapping interneuronal circuits using floxed ChR2 mice. (A) ChR2-EYFP expression in a sagittal section from brain of a PV-Cre × double-floxed stop ChR2 transgenic mouse. Left—low magnification image of whole brain. Right—high magnification image of somatosensory cortex showing interneurons expressing ChR2-EYFP in their plasma membrane (white arrowheads). (B) Photostimulation (480 nm, 500 ms duration) evoked action potentials in an interneuron expressing ChR2. (C) Mapping the light sensitivity of a ChR2-expressing interneuron in a cortical slice. Left—Action potentials evoked by brief (405 nm, 0.54 mW, 4 ms duration) laser light spots. Numbers represent locations indicated by the numbered pixels in the image at right. Bar below the traces indicates the time of illumination. Right—Scanning the light spot across the slice revealed locations (red pixels) where light evoked action potentials in the interneuron. (D) Relationship between light intensity and amplitude of IPSPs evoked in a cortical pyramidal neuron in response to wide-field (460 nm) photostimulation of presynaptic interneurons. Curve is fit of the Hill equation. Inset shows IPSP evoked in a cortical pyramidal neuron evoked by 7.1 mW/mm2 photostimulus. (E) Optogenetic mapping of inhibitory inputs to a cortical pyramidal cell. The amplitude of light-evoked IPSCs (left, black traces) recorded at the indicated locations (image) was mapped in the pseudocolor scale shown at right. Responses were blocked by bicuculline (red traces), confirming that they are IPSCs. Laser pulses were 405 nm, 0.48 mW, and 4 ms duration.

References

    1. Adamantidis A. R., Zhang F., Aravanis A. M., Deisseroth K., de Lecea L. (2007). Neural substrates of awakening probed with optogenetic control of hypocretin neurons. Nature 450, 420–424 10.1038/nature06310 - DOI - PMC - PubMed
    1. Akerboom J., Carreras Calderon N., Tian L., Wabnig S., Prigge M., Tolo J., et al. (2013). Genetically encoded calcium indicators for multi-color neural activity imaging and combination with optogenetics. Front. Mol. Neurosci. 6:2 10.3389/fnmol.2013.00002 - DOI - PMC - PubMed
    1. Anchisi D., Scelfo B., Tempia F. (2001). Postsynaptic currents in deep cerebellar nuclei. J. Neurophysiol. 85, 323–331 - PubMed
    1. Arenkiel B. R., Peca J., Davison I. G., Feliciano C., Deisseroth K., Augustine G. J., et al. (2007). In vivo light-induced activation of neural circuitry in transgenic mice expressing channelrhodopsin-2. Neuron 54, 205–218 10.1016/j.neuron.2007.03.005 - DOI - PMC - PubMed
    1. Atasoy D., Aponte Y., Su H. H., Sternson S. M. (2008). A FLEX switch targets Channelrhodopsin-2 to multiple cell types for imaging and long-range circuit mapping. J. Neurosci. 28, 7025–7030 10.1523/JNEUROSCI.1954-08.2008 - DOI - PMC - PubMed

Publication types