Review
. 2013 Nov 26:7:84.
doi: 10.3389/fnint.2013.00084.

From ear to uncertainty: vestibular contributions to cognitive function

Affiliations
Review

From ear to uncertainty: vestibular contributions to cognitive function

Paul F Smith et al. Front Integr Neurosci. .

Abstract

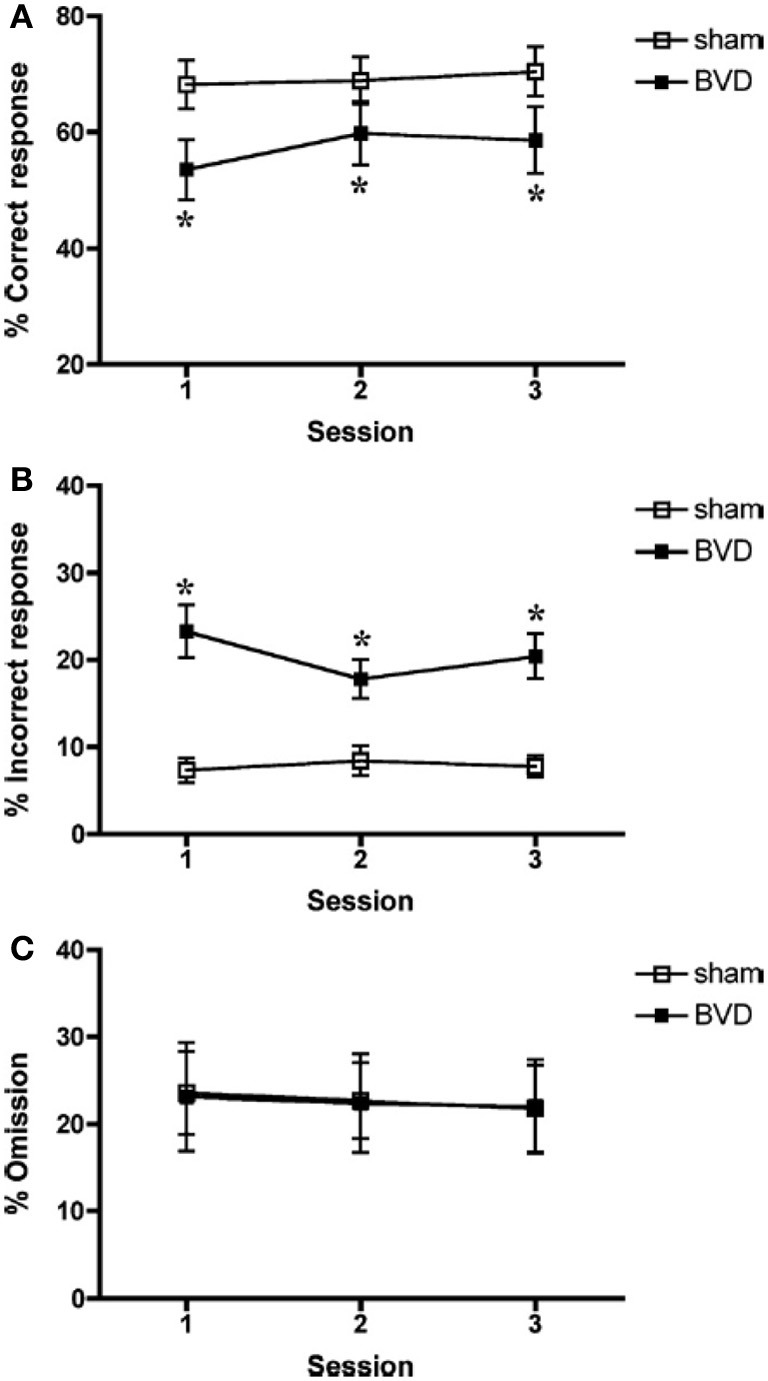
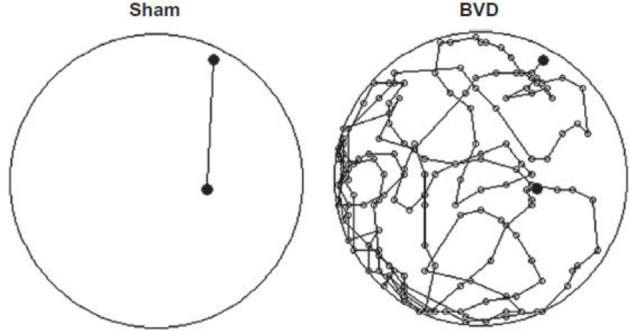
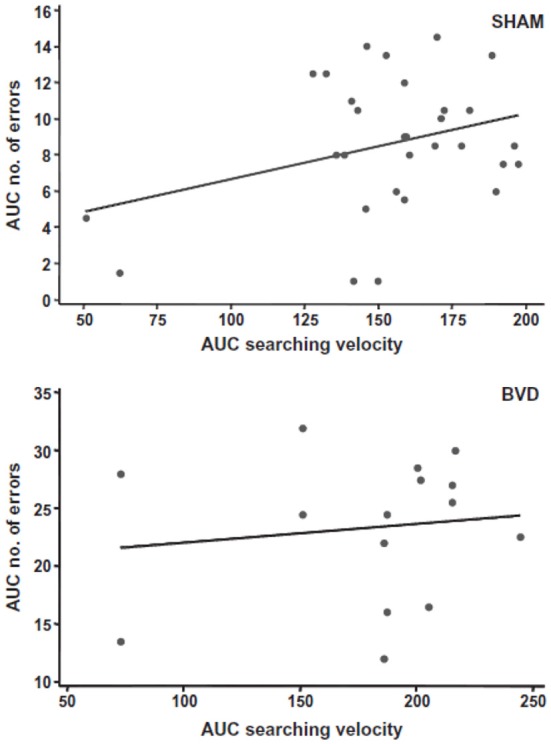
In addition to the deficits in the vestibulo-ocular and vestibulo-spinal reflexes that occur following vestibular dysfunction, there is substantial evidence that vestibular loss also causes cognitive disorders, some of which may be due to the reflexive deficits and some of which are related to the role that ascending vestibular pathways to the limbic system and neocortex play in spatial orientation. In this review we summarize the evidence that vestibular loss causes cognitive disorders, especially spatial memory deficits, in animals and humans and critically evaluate the evidence that these deficits are not due to hearing loss, problems with motor control, oscillopsia or anxiety and depression. We review the evidence that vestibular lesions affect head direction and place cells as well as the emerging evidence that artificial activation of the vestibular system, using galvanic vestibular stimulation (GVS), can modulate cognitive function.

Keywords: cognition; hippocampus; spatial memory; vestibular; vestibular lesions.


Figures

Figure 1
Figure 1
A Rose diagram indicating the initial heading angles of SHAM and BVD rats at 14 months post-op. in a foraging task in darkness, in which they had to remember their way to a home base. The mean vector is indicated by the black line and the 95% confidence interval (CI) for the mean is indicated by the line extending either side. The 95% CIs for the BVD animals were unreliable due to the low concentration of vectors. The inner circles (dotted line) indicate the number of observations for the given vectors (blue triangles). Reproduced with permission from Baek et al. (2010).
Figure 2
Figure 2
The area under the curve (AUC) for the number of errors exhibited in the same foraging task described in Figure 1, for the sham and BVD animals at 14 month post-op. in darkness, showing the effects of surgery, drug treatment with a cannabinoid receptor agonist, WIN55,212-2 (which one would normally expect to make spatial memory worse), and their interaction. (A) Effects of surgery; (B) Drug treatment; and (C) Drug dose. Data are represented as mean ± s.e.m. Reproduced with permission from Baek et al. (2010).
Figure 3
Figure 3
Mean % correct responses in the spatial T maze task in light over 8 days for the BVD and sham animals at 4–5 months post-op. Reproduced with permission from Zheng et al. (2012a,b). Data are expressed as means ± a 95% confidence interval.
Figure 4
Figure 4
Effects of sequential unilateral vestibular lesions on performance of rats, compared to sham controls, in a radial arm maze task. (A) Number of reference memory errors. (B) Number of working memory errors. Data are represented as mean ± s.e.m. Reproduced with permission from Besnard et al. (2012).
Figure 5
Figure 5
Percentage of correct responses (A), incorrect responses (B), and omissions (C) for sham (open square) and BVD rats (closed square) in a 5 choice serial reaction time task in light. Data are expressed as means ± s.e.m. Asterisks indicate significant differences. Reproduced with permission from Zheng et al. (2009a,b).
Figure 6
Figure 6
An example of a homeward path taken by a BVD rat and a sham control rat at 14 months post-op. during a foraging task in darkness in which animals had been trained to forage for food and navigate their way back to a home base. Whereas the Sham rat traveled the shortest path back home, the BVD rat could not remember the correct path. Reproduced with permission from Baek et al. (2010).
Figure 7
Figure 7
A scatter graph showing a simple linear regression analysis to predict the number of errors made by all of the sham or BVD animals (in terms of the area under the curve) from their searching velocities in the foraging task, as an index of their locomotor hyperactivity. There was no significant prediction of spatial memory error from locomotor activity. Reproduced with permission from Baek et al. (2010).
Figure 8
Figure 8
Random forest regression, showing variables in order of importance from the top to the bottom, to predict the performance of BVD and sham animals in a spatial T maze task from the animals' performance in other behavioral tasks, such as the elevated plus maze, the open field maze and the elevated T maze. “group:” whether the animals had received a BVD or a sham operation. “epmdur:” duration of open arm entries in the elevated plus maze. “lnIO:” the ln of the ratio of time spent in the inner/middle to the outer zones of the open field maze. “e3:” 3rd escape latency in the elevated T maze. “a3:” 3rd avoidance latency in the elevated T maze. “dist:” distance traveled in the open field maze. “sdur:” duration of supported rearing in the open field maze. “udur:” duration of unsupported rearing in the open field maze. Reproduced with permission from Smith et al. (2013).
Figure 9
Figure 9
Effects of 0.5 mg/kg diazepam, which was shown to have an anxiolytic effects, on spatial memory performance in a radial arm maze of bilateral vestibular lesion (BVL) and sham C rats. (A) Number of reference memory errors. (B) Number of working memory errors. Cs, control saline; Cd, control diazepam; BVLs, BVL saline; BVLd, BVL diazepam. Diazepam did not reduce the spatial memory deficits of the BVL rats. Data are expressed as means ± s.e.m. Reproduced with permission from Machado et al. (2012b).
Figure 10
Figure 10
(A) Mean percentage search time that male and female control and bilateral vestibular lesion (BVL) patients spent in the correct platform quadrant during the no-platform trial in a virtual Morris water maze task. (B) Initial heading error in the same task. Data are expressed as means ± s.e.m. Reproduced with permission from Brandt et al. (2005).

References

    1. Agrawal Y., Carey J. P., Della Santina C. C., Schubert M. C., Minor L. B. (2009). Disorders of balance and vestibular function in US adults: data from the National Health and Nutrition Examination Survey, 2001-2004. Arch. Int. Med. 169, 938–944 10.1001/archinternmed.2009.66 - DOI - PubMed
    1. Andersson G., Hagman J., Talianzadeh R., Svedberg A., Larsen H. C. (2002). Effects of cognitive load on postural control. Brain Res. Bull. 58, 135–139 10.1016/S0361-9230(02)00770-0 - DOI - PubMed
    1. Andersson G., Hagman J., Talianzadeh R., Svedberg A., Larsen H. C. (2003). Dual task study of cognitive and postural interference in patients with vestibular disorders. Otol. Neurotol. 24, 289–293 10.1097/00129492-200303000-00026 - DOI - PubMed
    1. Angelaki D. E., Klier E. M., Snyder L. H. (2009). A vestibular sensation: probabilistic approaches to spatial perception. Neuron 64, 448–461 10.1016/j.neuron.2009.11.010 - DOI - PMC - PubMed
    1. Asmundson G. J., Larsen D. K., Stein M. B. (1998). Panic disorder and vestibular disturbance: an overview of empirical findings and clinical implications. J. Psychosom. Res. 44, 107–120 10.1016/S0022-3999(97)00132-3 - DOI - PubMed

LinkOut - more resources