. 2013 Nov 26:7:173.
doi: 10.3389/fnbeh.2013.00173. eCollection 2013.

Optogenetic stimulation of VTA dopamine neurons reveals that tonic but not phasic patterns of dopamine transmission reduce ethanol self-administration

Affiliations

Optogenetic stimulation of VTA dopamine neurons reveals that tonic but not phasic patterns of dopamine transmission reduce ethanol self-administration

Caroline E Bass et al. Front Behav Neurosci. .

Abstract

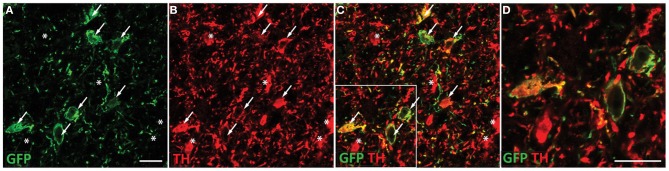
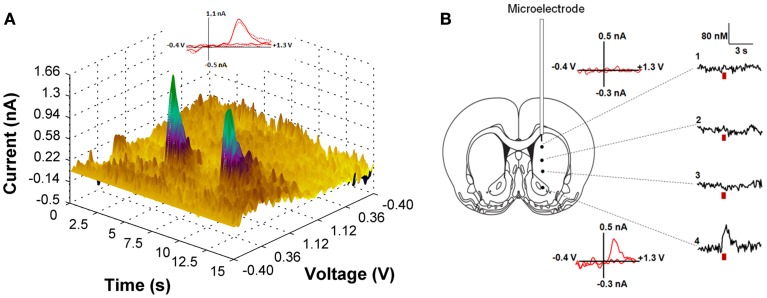
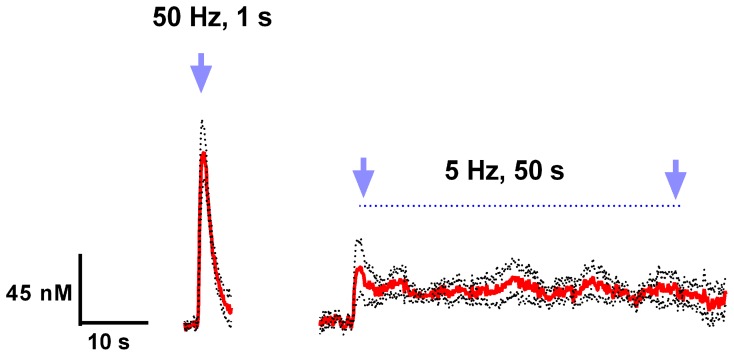
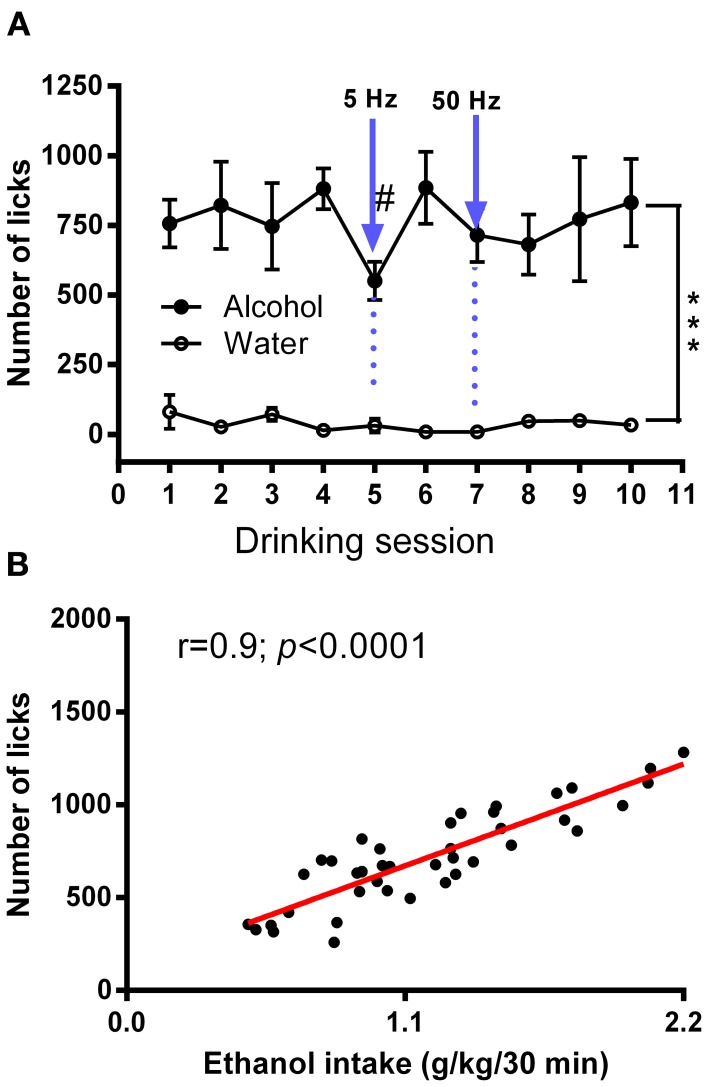
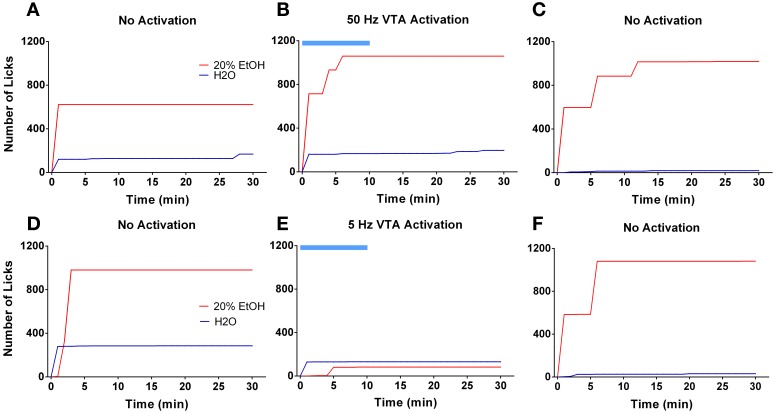
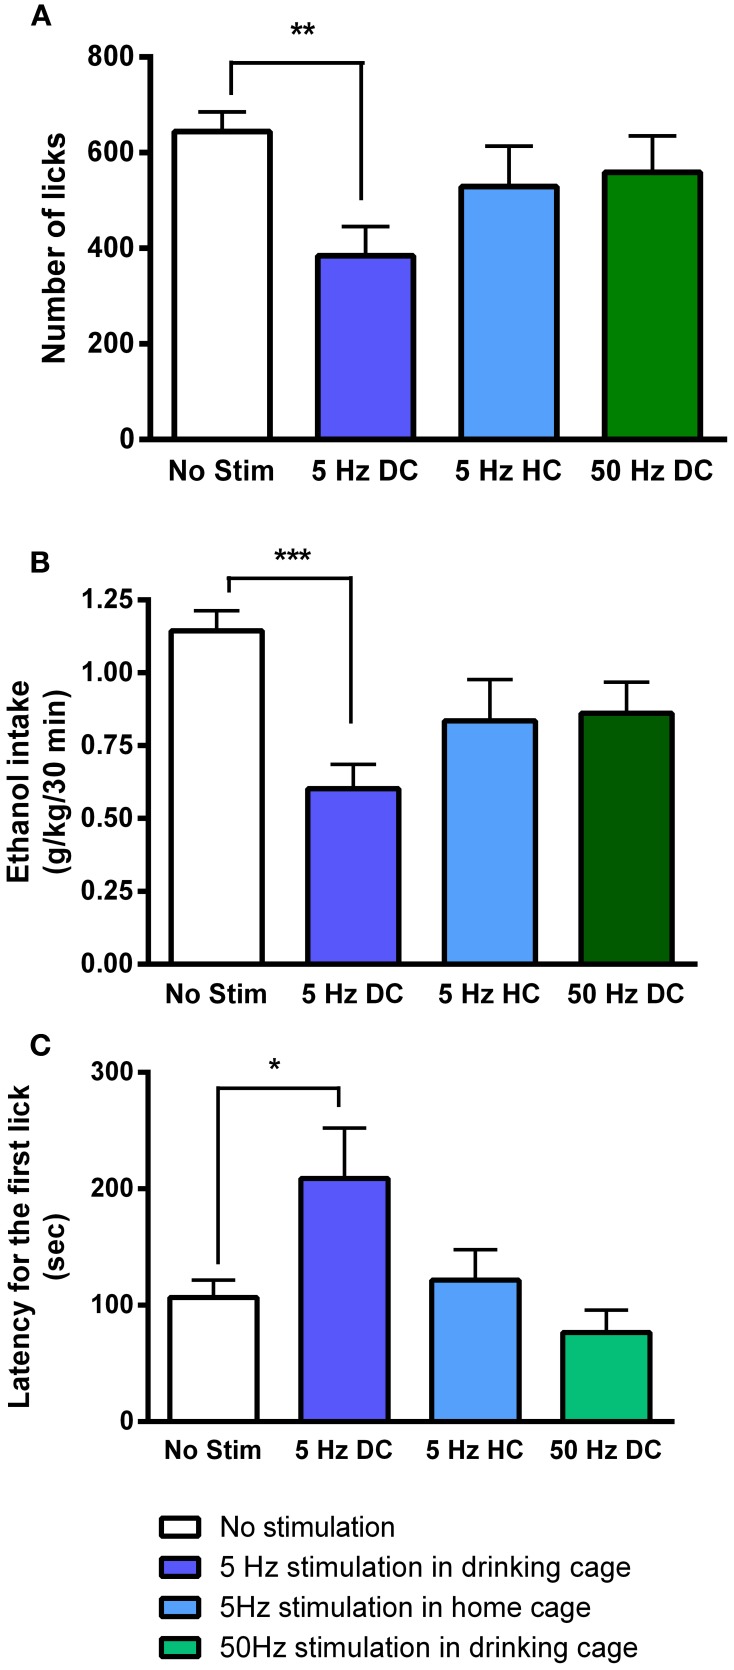
There is compelling evidence that acute ethanol exposure stimulates ventral tegmental area (VTA) dopamine cell activity and that VTA-dependent dopamine release in terminal fields within the nucleus accumbens plays an integral role in the regulation of ethanol drinking behaviors. Unfortunately, due to technical limitations, the specific temporal dynamics linking VTA dopamine cell activation and ethanol self-administration are not known. In fact, establishing a causal link between specific patterns of dopamine transmission and ethanol drinking behaviors has proven elusive. Here, we sought to address these gaps in our knowledge using a newly developed viral-mediated gene delivery strategy to selectively express Channelrhodopsin-2 (ChR2) on dopamine cells in the VTA of wild-type rats. We then used this approach to precisely control VTA dopamine transmission during voluntary ethanol drinking sessions. The results confirmed that ChR2 was selectively expressed on VTA dopamine cells and delivery of blue light pulses to the VTA induced dopamine release in accumbal terminal fields with very high temporal and spatial precision. Brief high frequency VTA stimulation induced phasic patterns of dopamine release in the nucleus accumbens. Lower frequency stimulation, applied for longer periods mimicked tonic increases in accumbal dopamine. Notably, using this optogenetic approach in rats engaged in an intermittent ethanol drinking procedure, we found that tonic, but not phasic, stimulation of VTA dopamine cells selectively attenuated ethanol drinking behaviors. Collectively, these data demonstrate the effectiveness of a novel viral targeting strategy that can be used to restrict opsin expression to dopamine cells in standard outbred animals and provide the first causal evidence demonstrating that tonic activation of VTA dopamine neurons selectively decreases ethanol self-administration behaviors.

Keywords: VTA; dopamine; ethanol self-administration; nucleus accumbens; optogenetics.


Figures

Figure 1
Figure 1
ChR2-EYFP expression is targeted to dopaminergic neurons in the VTA. Coronal section containing the midbrain of a representative rat injected with TH restricted ChR2 AAVs were co-stained with EYFP and TH antibodies. TH staining was apparent throughout the VTA and substantia nigra. Robust EYFP expression was observed in the VTA only. EYFP immunohistochemical staining revealed multiple ChR2 positive cell bodies present (A). Tyrosine hydroxylase co-staining (B) demonstrated many TH positive neurons in the VTA, which colocalized with the ChR2 signal (C). A portion of the merged image is magnified in (D). Neurons that express both TH and ChR2 are marked with arrows while neurons that are TH positive only (no apparent ChR2) are marked with asterisks. ChR2 was not observed in non-TH positive neurons. Scale bar equals 20 microns.
Figure 2
Figure 2
(A) Light-induced dopamine release in the ventral striatum. The left panel demonstrates a three dimensional color plot topographically depicting voltammetric data collected with FSCV in the nucleus accumbens of a single anesthetized rat before, during and after optical stimulation of the VTA. Green spikes represent dopamine transients triggered by 30 Hz, 30 pulses light stimulation with 5 s intervals between pulse-train groups. Inset: Background-subtracted cyclic voltammograms taken at the end of the light stimulation indicate that the change in current is due to dopamine oxidation (solid line—for the first dopamine spike; dotted line—for the second spike). (B) Optically-evoked dopamine concentrations in different regions of the striatum from one representative animal are presented. The fiber optic was fixed in the VTA (anterior-posterior, 5.8 mm; lateral, 0.7 mm; dorsal-ventral, 7.3 mm), while the voltammetric carbon fiber electrode was lowered to various depths throughout the dorsal and ventral striatum to determine level of dopamine release (anterior-posterior, 1.2 mm; lateral, 2.0 mm and dorsal-ventral varied with 1: 4.2 mm; 2: 5.2 mm; 3: 6.2 mm; 4: 7.2 mm). Red bar indicates the time of light stimulation. Background-subtracted cyclic voltammograms from 1 and 4 are also presented.
Figure 3
Figure 3
Light activation of VTA dopaminergic neurons can mimic phasic and tonic dopamine release. Average dopamine concentration changes recorded in rat nucleus accumbens were evoked by 50 Hz, 50 pulses, and 5 Hz, 250 pulses (4 ms pulse width) optical stimulation of the VTA. Dopamine was identified by its oxidation (≈0.6 V) and reduction (≈−0.2 V on the negative going scan) features. These data are presented as a mean ± s.e.m. denoted by red solid and black broken lines, respectively (n = 5).
Figure 4
Figure 4
Average numbers of licks for ethanol and water in an intermittent 2-bottle choice drinking assay with optical stimulation. (A) Average daily ethanol (20%) and water licks during 10 drinking sessions was measured. There was a significant difference in the number of licks between ethanol and water [F(1, 72) = 55.29; ***P < 0.0001). The effects of tonic (5 Hz) and phasic (50 Hz) optical stimulation of VTA dopaminergic neurons applied during the first 10 min of the 5 and 7th session, respectively, were explored. No significant changes in the number of water licks was found, while there was a considerable trend (t = 2.4) toward a decrease in ethanol licking following 5-Hz stimulation. Data are presented as a mean ± SEM (n = 5). (B) Relationship between ethanol dose (g/kg) and total number of licks obtained during a 30 min drinking session. There was a strong, positive correlation between the number of ethanol licks and the amount of ethanol consumed (Pearson r = 0.9; p < 0.0001). The measures were taking from multiple sessions.
Figure 5
Figure 5
Tonic but not phasic dopamine release reduces ethanol self-administration. Graphs demonstrate representative cumulative records of licking during consecutive 30 min drinking sessions, where 20% ethanol solution and water are available. The top panel demonstrates ethanol and water drinking patterns of a single rat during 3 separate sessions that were performed 2 days apart: (A,C) two sessions were with no stimulation; (B) one session was with optical stimulation of the VTA at 50 Hz frequency. The bottom panel shows drinking patterns from analogous sessions with 5 Hz frequency stimulation: (D,F) two sessions were with no stimulation; (E) one session with VTA stimulation at 5 Hz frequency. Optogenetic activation of VTA dopamine neurons at a low (5 Hz) but not high (50 Hz) frequency affects ethanol drinking behavior. The blue bar indicates a time of the stimulation.
Figure 6
Figure 6
Tonic dopamine release alters ethanol drinking measures only when optogenetic stimulation is applied in the drinking cage. Bar graphs illustrate averaged values of (A) number of licks, (B) total dose of ethanol consumed (g/kg), and (C) latency for the first lick (s) across multiple sessions. The sessions were performed in the drinking cage (DC) with no stimulation (No Stim), with 5-Hz (5 Hz DC) and with 50-Hz stimulation (50 Hz DC), applied in the first 10 min, and in the home cage (HC, 10 min immediately prior to being placed in the drinking cage) with 5-Hz stimulation (5 Hz HC). The effect of 5-Hz stimulation applied in the drinking cage compared to No Stim was significant for all drinking parameters. *P < 0.05, **P < 0.01, ***P < 0.001 compared with the session when no stimulation was applied.

References

    1. Anstrom K. K., Miczek K. A., Budygin E. A. (2009). Increased phasic dopamine signaling in the mesolimbic pathway during social defeat in rats. Neuroscience 161, 3–12 10.1016/j.neuroscience.2009.03.023 - DOI - PMC - PubMed
    1. Bass C. E., Grinevich V. P., Vance Z. B., Sullivan R. P., Bonin K. D., Budygin E. A. (2010). Optogenetic control of striatal dopamine release in rats. J. Neurochem. 114, 1344–1352 10.1111/j.1471-4159.2010.06850.x - DOI - PMC - PubMed
    1. Beckstead R. M., Domesick V. B., Nauta W. J. (1979). Efferent connections of the substantia nigra and ventral tegmental area in the rat. Brain Res. 175, 191–217 10.1016/0006-8993(79)91001-1 - DOI - PubMed
    1. Belle A. M., Owesson-White C., Herr N. R., Carelli R. M., Wightman R. M. (2013). Controlled iontophoresis coupled with fast-scan cyclic voltammetry/electrophysiology in awake, freely moving animals. ACS Chem. Neurosci. 4, 761–771 10.1021/cn400031v - DOI - PMC - PubMed
    1. Berke J. D., Hyman S. E. (2000). Addiction, dopamine, and the molecular mechanisms of memory. Neuron 25, 515–532 10.1016/S0896-6273(00)81056-9 - DOI - PubMed

LinkOut - more resources