. 2013 Nov 12;8(11):e77389.
doi: 10.1371/journal.pone.0077389. eCollection 2013.

Linking reproduction and survival can improve model estimates of vital rates derived from limited time-series counts of pinnipeds and other species

Affiliations

Linking reproduction and survival can improve model estimates of vital rates derived from limited time-series counts of pinnipeds and other species

Brian C Battaile et al. PLoS One. .

Abstract

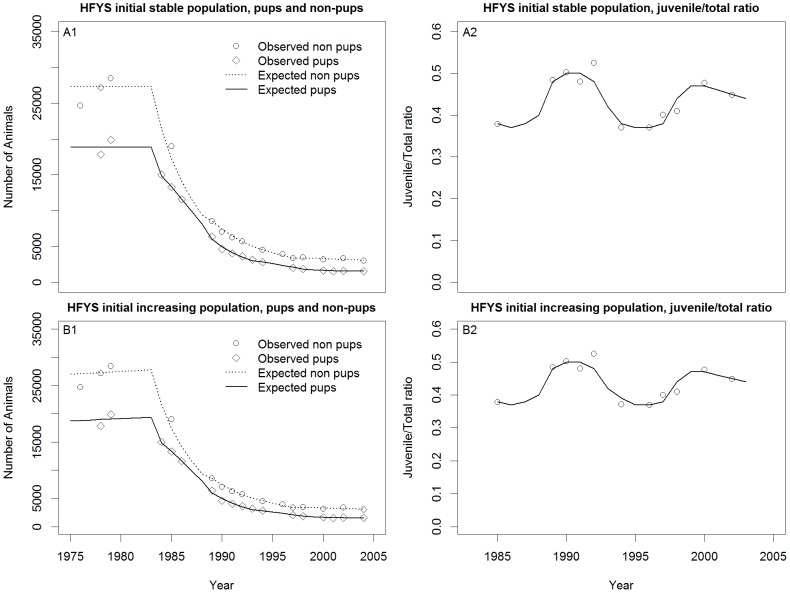
We propose a method to model the physiological link between somatic survival and reproductive output that reduces the number of parameters that need to be estimated by models designed to determine combinations of birth and death rates that produce historic counts of animal populations. We applied our Reproduction and Somatic Survival Linked (RSSL) method to the population counts of three species of North Pacific pinnipeds (harbor seals, Phoca vitulina richardii (Gray, 1864); northern fur seals, Callorhinus ursinus (L., 1758); and Steller sea lions, Eumetopias jubatus (Schreber, 1776))--and found our model outperformed traditional models when fitting vital rates to common types of limited datasets, such as those from counts of pups and adults. However, our model did not perform as well when these basic counts of animals were augmented with additional observations of ratios of juveniles to total non-pups. In this case, the failure of the ratios to improve model performance may indicate that the relationship between survival and reproduction is redefined or disassociated as populations change over time or that the ratio of juveniles to total non-pups is not a meaningful index of vital rates. Overall, our RSSL models show advantages to linking survival and reproduction within models to estimate the vital rates of pinnipeds and other species that have limited time-series of counts.


Conflict of interest statement

Competing Interests: The authors have declared that no competing interests exist.

Figures

Figure 1
Figure 1. Vital rate adjustment.
Examples of how northern fur seal survival (Sx) (Fig. A) and fertility (Fx) (Fig. B) changes over age when multiplied by a constant for fitting the models to count data by adjusting the vital rates in Leslie matrices that best describe the population dynamics over different time periods.
Figure 2
Figure 2. Final transition matrices for the Reproduction and Somatic Survival Linked (RSSL) model.
A. The multiplication of Fertility F and Survival S values from Table 1 and the initial stationary population adjustment parameter d. B. Final RSSL Leslie matrix for Steller sea lions (Eumetopias jubatus (Schreber, 1776)).
Figure 3
Figure 3. Time series counts for north pacific pinnipeds.
A. Northern fur seals (Callorhinus ursinus (L., 1758)) at St. Paul Island, Alaska, from the National Marine Fisheries Service Annual Fur Seal Investigation Reports and Lander , (B&C) Steller sea lions (Eumetopias jubatus (Schreber, 1776)) in the Central Gulf of Alaska from Holmes et al. and (D) harbor seals (Phoca vitulina richardii (Gray., 1864)) at Tugidak Island, Alaska, from Jemison et al. .
Figure 4
Figure 4. Estimation of survival, maturity and pregnancy rates for Northern fur seals (Callorhinus ursinus (L., 1758)).
A. Adult female survival data from age 4 to 25 with the fitted Siler curve (Eq. 2a). B. Female maturity rate based on late term pregnancy data from the first 11 age classes with the fitted logistic curve (Eq. 1). C. Female pregnancy rates from fitting the multiplication of the survival curve and the maturity curve extended out to age 25, by adjusting the scalar of the logistic maturity function, in this case up (Eq. 3). All data are from Lander .
Figure 5
Figure 5. Estimation of survival, maturity and pregnancy rates for Steller sea lions (Eumetopias jubatus (Schreber, 1776)).
A. Adult female survival data from the York Weibull model, using age 3 to 30 y with the fitted Weibull curve (Eq. 2c). B. Female maturity rate based on ovulation data with the fitted logistic curve (Eq. 1). C. Female pregnancy rates from the result of fitting the multiplication of the survival curve and the maturity curve by adjusting the scalar of the logistic maturity function, here, only late term pregnancy data to age 20 was used to fit the model to the data, as the data from age 21 to 30 y is represented by only 3 individuals.
Figure 6
Figure 6. Estimation of survival, maturity and pregnancy rates for Harbor seals (Phoca vitulina richardii (Gray., 1864)).
A. Survival data for both sexes and all ages showing the fitted polynomial for females age 4 to 27(Eq. 2a). Male survival rates were close enough to females from age 4 to 17 y that we used the female survival curve for males of those ages. B. Female maturity rate based ovulation data from ages 1–10 first age classes with the fitted logistic curve (Eq. 1). C. Female pregnancy rates from the result of fitting the multiplication of the survival curve and the maturity curve extended out to age 27 y, by adjusting the scalar of the logistic maturity function, in this case up. All data are from Pitcher , .
Figure 7
Figure 7. Northern fur seal (Callorhinus ursinus (L., 1758)) model fits.
Reproduction and Somatic Survival Linked (RSSL) model and a model using data from Lander fit to northern fur seal pup count data from St. Paul Island, Alaska. Both models have a relatively similar fit with the exception around 1975. Data and models are for the female portion of the population only.
Figure 8
Figure 8. Harbor seal (Phoca vitulina richardii (Gray., 1864)) model fits.
Reproduction and Somatic Survival Linked (RSSL) model and a model using data from Pitcher fit to harbour seal count data from Tugidak Island, Alaska.
Figure 9
Figure 9. Steller sea lion (Eumetopias jubatus (Schreber, 1776)) model fits.
Reproduction and Somatic Survival Linked (RSSL) initial stationary population (A1–A2) and RSSL initial increasing population (B1–B2).
Figure 10
Figure 10. Steller sea lion (Eumetopias jubatus (Schreber, 1776)) model fits.
Holmes et al. (HFYS) initial stationary population (A1–A2) and Holmes et al. initial increasing population (B1–B2).
Figure 11
Figure 11. Steller sea lion (Eumetopias jubatus (Schreber, 1776)) model fits.
Winship and Trites (WT) (A1–A2) and Calkins and Pitcher (CP) (B1–B2).

References

    1. National Marine Fisheries Service (2008) Recovery plan for the Steller sea lion (Eumetopias jubatus). Revision. National Marine Fisheries Service, Silver Spring, MD. pp. 325.
    1. Pitcher KW (1990) Major decline in number of harbor seals, Phoca vitulina richardsi, on Tugidak Island, Gulf of Alaska. Marine Mammal Science 6: 121–134.
    1. Trites AW, Larkin PA (1992) The status of Steller sea lion populations and the development of fisheries in the Gulf of Alaska and Aleutian Islands. Vancouver: Fisheries Centre, University of British Columbia. 134 p.
    1. Boyd IL (2010) Assessing the effectiveness of conservation measures: resolving the “wicked” problem of the Steller sea lion. Biological Conservation 143: 1664–1674.
    1. Holmes EE, Fritz LW, York AE, Sweeney K (2007) Age-Structured modeling reveals long-term declines in the natality of western Steller sea lions. Ecological Applications 17: 2214–2232. - PubMed

Publication types

LinkOut - more resources