. 2013 Nov 26;8(11):e81030.
doi: 10.1371/journal.pone.0081030. eCollection 2013.

Canonical Wnt signaling promotes early hematopoietic progenitor formation and erythroid specification during embryonic stem cell differentiation

Affiliations

Canonical Wnt signaling promotes early hematopoietic progenitor formation and erythroid specification during embryonic stem cell differentiation

Anuradha Tarafdar et al. PLoS One. .

Abstract

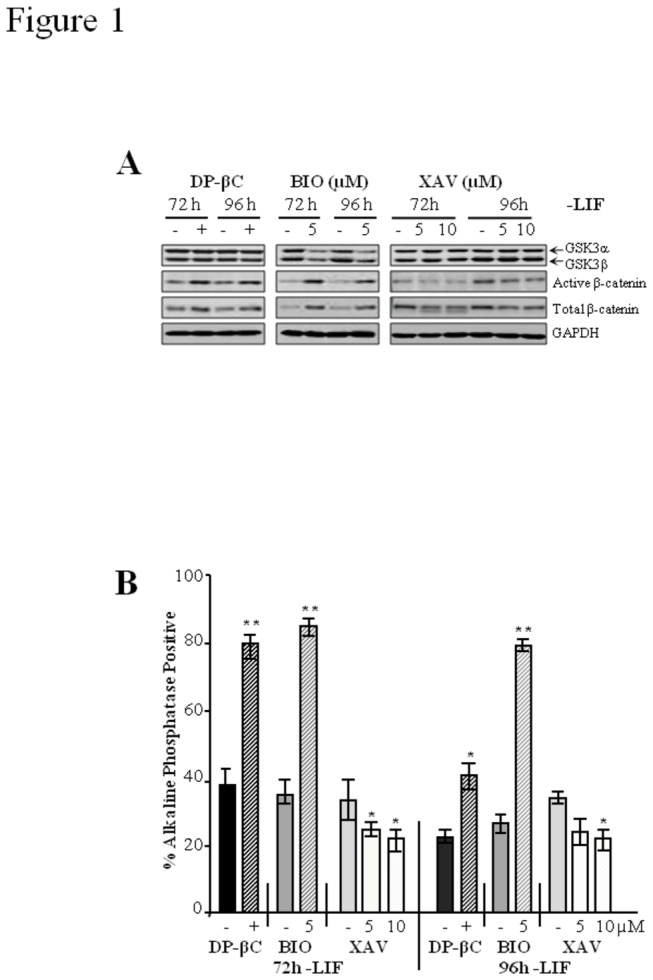
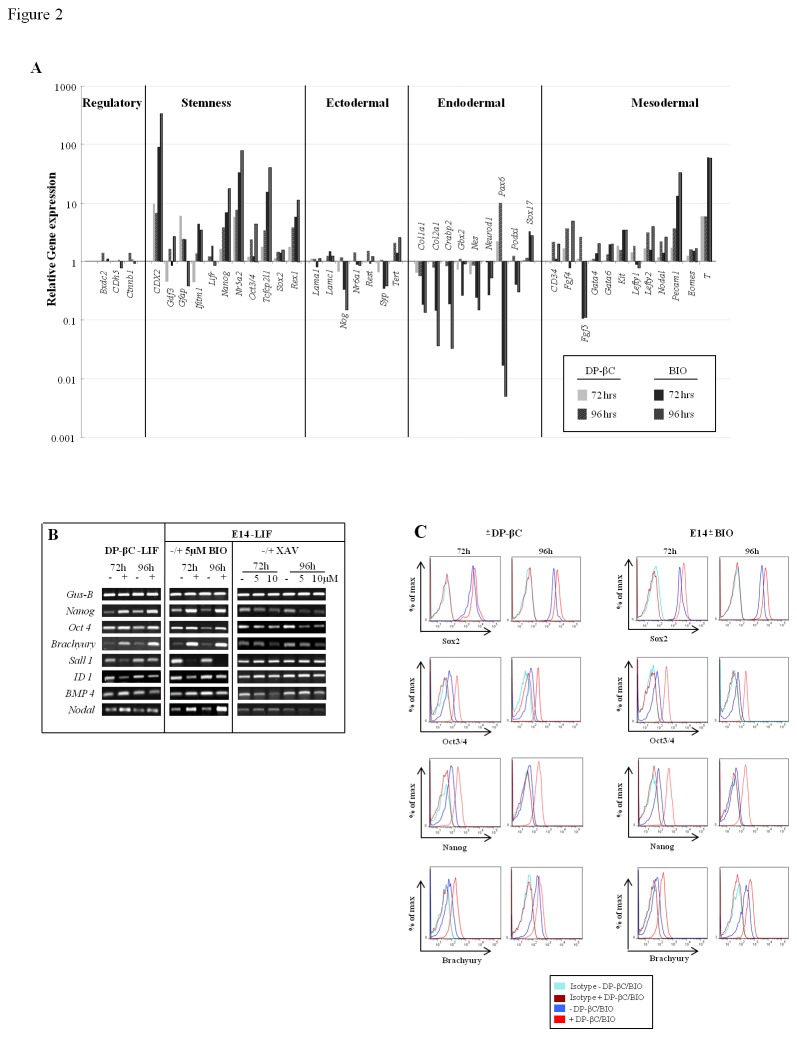
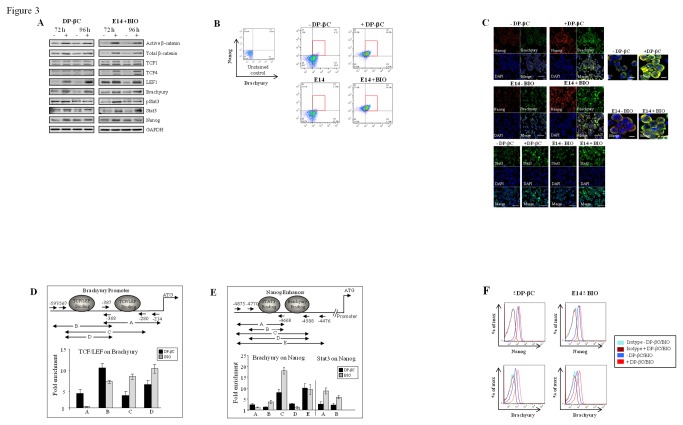
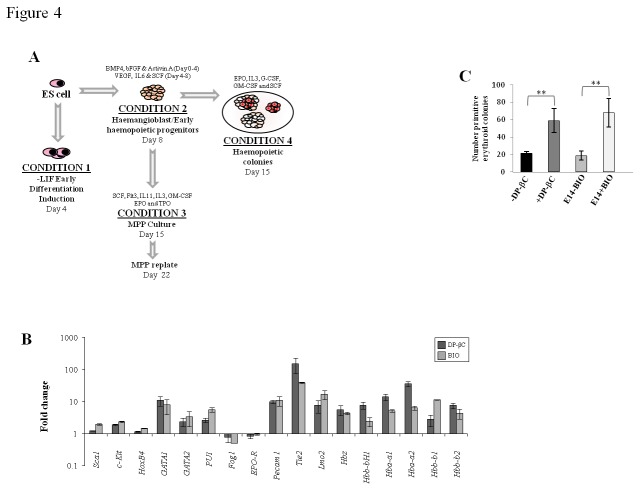
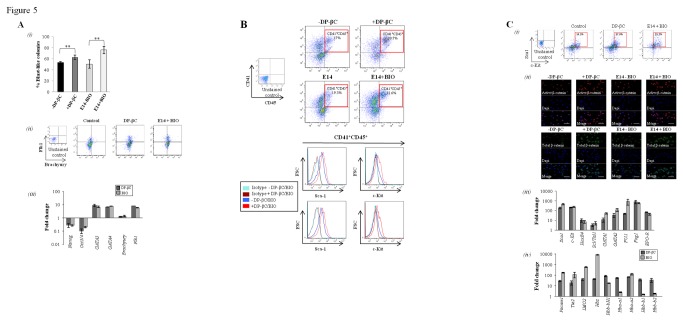
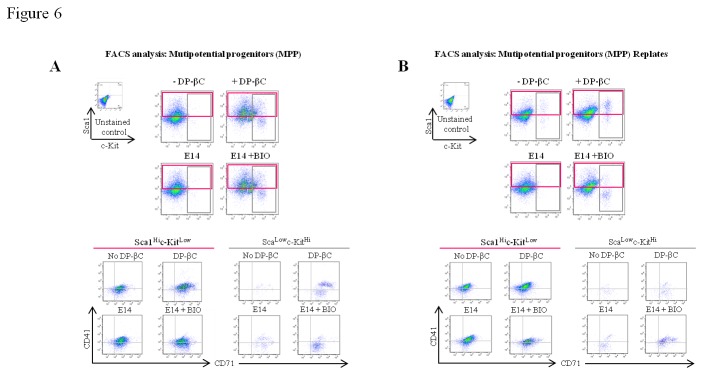
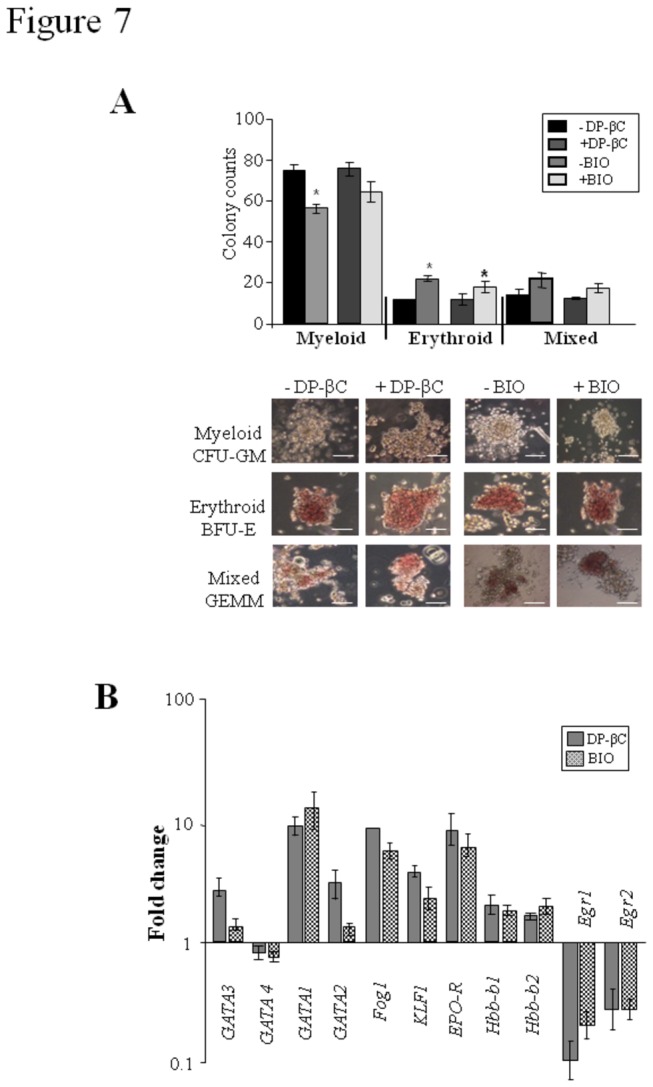
The generation of hematopoietic stem cells (HSCs) during development is a complex process linked to morphogenic signals. Understanding this process is important for regenerative medicine applications that require in vitro production of HSC. In this study we investigated the effects of canonical Wnt/β-catenin signaling during early embryonic differentiation and hematopoietic specification using an embryonic stem cell system. Our data clearly demonstrates that following early differentiation induction, canonical Wnt signaling induces a strong mesodermal program whilst maintaining a degree of stemness potential. This involved a complex interplay between β-catenin/TCF/LEF/Brachyury/Nanog. β-catenin mediated up-regulation of TCF/LEF resulted in enhanced brachyury levels, which in-turn lead to Nanog up-regulation. During differentiation, active canonical Wnt signaling also up-regulated key transcription factors and cell specific markers essential for hematopoietic specification, in particular genes involved in establishing primitive erythropoiesis. This led to a significant increase in primitive erythroid colony formation. β-catenin signaling also augmented early hematopoietic and multipotent progenitor (MPP) formation. Following culture in a MPP specific cytokine cocktail, activation of β-catenin suppressed differentiation of the early hematopoietic progenitor population, with cells displaying a higher replating capacity and a propensity to form megakaryocytic erythroid progenitors. This bias towards erythroid lineage commitment was also observed when hematopoietic progenitors were directed to undergo myeloid colony formation. Overall this study underscores the importance of canonical Wnt/β-catenin signaling in mesodermal specification, primitive erythropoiesis and early hematopietic progenitor formation during hematopoietic induction.


Conflict of interest statement

Competing Interests: The authors have declared that no competing interests exist.

Figures

Figure 1
Figure 1. Activation of the canonical Wnt pathway maintains self-renewal in the absence of LIF.
Parental E14 ES cells were cultured with or without BIO (5 µM) or XAV (5 or 10 µM) and DP-βC ES cells with or without Tet for 72 and 96 hours in the absence of LIF. (A) Protein extracts were immunoblotted for key signaling proteins involved in the Wnt pathway regulation; GSK-3, Active and total β-catenin with GAPDH used as a loading control, (Representative gel images shown, n=3). (B) Self-renewal potential was assessed by the percentage of colonies staining positive for alkaline phosphatase (AP) is given (Mean + SEMs, n=3 * p<0.05, ** p<0.005 by paired students t-test).
Figure 2
Figure 2. Active β-catenin directs mesodermal differentiation.
(A) Relative gene expression profile TaqMan® Mouse Stem Cell Pluripotency Array of mRNA harvested from DP-βC (+/- Tet) or E14 ES cells (+/- 5 µM BIO) following 72 and 96 hours without LIF. Relative expression of each gene calibrated to untreated controls (-DP-βC or -BIO) using the 2 –ΔΔCT method, plotted on a log scale with a relative expression of 1 representing no change to gene expression (Mean + SEMs, n=3). (B) Semi-quantitative RT-PCR for DP-βC (+/- Tet) and E14 ES cells (+/- 5 µM BIO, +/- 5 µM & 10 µM XAV) following 72 and 96 hours without LIF. (Representative gel images shown, n=3). (C) FACS plots confirming higher levels of Sox2, Oct3/4, Nanog or Brachyury over 72 and 96 hours following DP-βC or BIO treatment without LIF for 96 hours compared to control cells (Representative images shown, n=2).
Figure 3
Figure 3. Canonical Wnt signaling biases mesodermal commitment via altered TCF/LEF/Brachyury/Nanog transcription.
(A) Protein extracts from DP-βC (+/- Tet) and E14 ES cells +/- BIO) following 96 hour culture in no LIF were immunoblotted to measure levels of active and total β-catenin, TCF/LEF, Brachyury, pStat3, total Stat3 and Nanog with GAPDH used as the loading control. Representative gel images shown, n=3. (B) Flow cytometry showing higher percentage of cells were positive for both Nanog and Brachyury following DP-βC or BIO treatment without LIF for 96 hours compared to control cells (Representative images shown, n=2). (C) Immunofluorescence to show up regulation of self-renewal markers Nanog or Stat3 and mesodermal marker Brachyury following DP-βC expression or BIO treatment. Representative images shown, n=3. (D) Chromatin Immunoprecipitation was performed on DP-βC (+/- Tet) and E14 ES cells (-/+ BIO) cultured in the absence of LIF for 96 hours. The cells were harvested and IP was performed on the sonicated chromatin material using the TCF/LEF antibody sampler kit. The primer sets were designed on regions flanking the TCF/LEF binding sites (Start -597 to Start -368 on the Brachyury promoter). (E) In addition IP was performed using Brachyury or Stat3 antibody on the sonicated chromatin material. The primer sets were designed on regions flanking the Brachyury binding sites (Start -4875 to Start -4476) and Stat 3 binding sites (Start -4875 to Start -4668) on the Nanog enhancer region. Quantitative PCR was performed to measure the relative enrichment (Mean fold enrichment, +/- SEM, n=3). (F) Flow cytometry analysis indicating short-term activation of β-catenin signalling (DP-βC or BIO) rapidly up-regulates Brachyury prior to any significant changes in Nanog levels (Representative images shown, n=2).
Figure 4
Figure 4. Active β-catenin induces an embryonic erythroid program during early differentiation.
(A) Schematic diagram of the different differentiation stages examined. CONDITION 1 early differentiation, CONDITION 2 Hemangioblast/Early hematopoietic progenitors, CONDITION 3 MPP, MEP and GMP differentiation, CONDITION 4 Myeloid colony formation. (B) QRT-PCR demonstrating activation of the canonical Wnt signaling (DP-βC or E14 ES cells + BIO) up-regulates key genes important for establishing early hematopoietic commitment, primitive erythroid specification and embryonic/fetal globin genes during differentiation induction in the absence of LIF (CONDITION 1). Control cells (DP-βC + tet or E14 ES cells -BIO) were used as calibrators and the fold change was calculated using the 2 –ΔΔCT method (Mean of fold change +/- SEM, n=3). (C) Cells were directed to form EB’s and then cultured in M3434 to promote primitive erythroid colony formation and colonies scored. Active β-catenin signalling (DP-βC or BIO) resulted in a significant increase in primitive erythroid colonies (Mean %, +/- SEM, n=3).
Figure 5
Figure 5. β-catenin activation enhances hemangioblast formation.
(A) (i) Scoring of the number of BL-CFC compared to the number of EB’s for each condition by day 8 of differentiation shows activation of the canonical Wnt pathway (DP-βC or BIO) results in higher percentage of BL-CFC compared to control cultures (Mean %, +/- SEM, n=3). (ii) Hemangioblasts/Early hematopoietic progenitors (CONDITION 2) were analysis for expression of mesodermal markers Flk1 and Brachyury by flow cytometry. (iii) RT-PCR analysis of key self-renewal and differentiation genes. (B) Flow cytometry analysis was performed on the hemangioblast/early hematopoietic progenitors to determine the percentage of cells expressing CD41, CD45, c-Kit, Sca1 and Flt3. Gating on the CD41+, CD45+ population revealed that these early hematopoietic progenitors also expressed the HSC markers Sca1 and c-Kit (Representative images shown, n=3). (C) (i) Total cell population from CONDITION 2 were analyzed for key HSC markers Sca1 and c-Kit by flow cytometry. (ii) The early hematopoietic progenitor populations (Sca1+c-Kit+ cells) were sorted and Immunofluorescence performed to confirm higher levels of total and active β-catenin in DP-βC –tet and E14 cells + BIO. (iii) RT-PCR analysis of key hematopoietic genes within the Sca-1+c-kit+ hematopoietic progenitor cells and (iv) erythroid/globin genes. The control cells (DP-βC + tet or E14 ES cells -BIO) were used as calibrators and the fold change was calculated using the 2 -ΔΔCT method (Mean of fold change +/- SEM, n=3).
Figure 6
Figure 6. Activation of the canonical Wnt pathway increases MPP and MEP generation.
(A) Cells from CONDITION 2 of the differentiation, (DP-βC +/- Tet and E14 ES cells +/- BIO) were cultured in a MPP cocktail for 7 days prior to multi-parameter flow cytometry analysis of total cell population from CONDITION 3. Live cells from CONDITION 3 of the differentiation were gated and the expression of the hematopoietic progenitor markers, Sca1hic-Kitlo and Sca1loc-Kithi were profiled along with the megakaryocytic marker CD41 and transferrin receptor CD71. (B) MPP population (CONDITION 3) were then replated for an additional 7 days and analyzed for the same panel of markers outlined in (A). Images are representative of 3 independent experiments.
Figure 7
Figure 7. β-catenin permits granulocytic/macrophage colony formation.
(A) Cells from CONDITION 2 of the differentiation, were directed to undergo myeloid colony formation and the number of GM-CFU, GEMM, and BFU-E colonies counted-CONDITION 4. Graph represents the Mean % +/- SEM, n=3. Representative pictures of hematopoietic colonies x 10 magnification, scale bar 100 µM. (B) Gene expression profiling of erythroid and myeloid genes. The control cells (DP-βC +Tet or E14 ES cells -BIO) were used as calibrators and the fold change was calculated using the 2 –ΔΔCT method (Mean of fold change +/- SEM, n=3).

Similar articles

Cited by

References

    1. Van Den Berg DJ, Sharma AK, Bruno E, Hoffman R (1998) Role of members of the wnt gene family in human hematopoiesis. Blood 92: 3189-3202. PubMed: 9787155. - PubMed
    1. Behrens J, von Kries JP, Kühl M, Bruhn L, Wedlich D et al. (1996) Functional interaction of [beta]-catenin with the transcription factor LEF-1. Nature 382: 638-642. doi:10.1038/382638a0. PubMed: 8757136. - DOI - PubMed
    1. Huelsken J, Vogel R, Brinkmann V, Erdmann B, Birchmeier C et al. (2000) Requirement for β-catenin in anterior-posterior axis formation in mice. J Cell Biol 148: 567-578. doi:10.1083/jcb.148.3.567. PubMed: 10662781. - DOI - PMC - PubMed
    1. Ysebaert L, Chicanne G, Demur C, De Toni F, Prade-Houdellier N et al. (2006) Expression of [beta]-catenin by acute myeloid leukemia cells predicts enhanced clonogenic capacities and poor prognosis. Leukemia 20: 1211-1216. doi:10.1038/sj.leu.2404239. PubMed: 16688229. - DOI - PubMed
    1. Clements WK, Kim AD, Ong KG, Moore JC, Lawson ND et al. (2011) A somitic Wnt16/Notch pathway specifies haematopoietic stem cells. Nature 474: 220-224. doi:10.1038/nature10107. PubMed: 21654806. - DOI - PMC - PubMed

Publication types