. 2013 Dec 4;8(12):e80590.
doi: 10.1371/journal.pone.0080590. eCollection 2013.

Rb suppresses collective invasion, circulation and metastasis of breast cancer cells in CD44-dependent manner

Affiliations

Rb suppresses collective invasion, circulation and metastasis of breast cancer cells in CD44-dependent manner

Kui-Jin Kim et al. PLoS One. .

Abstract

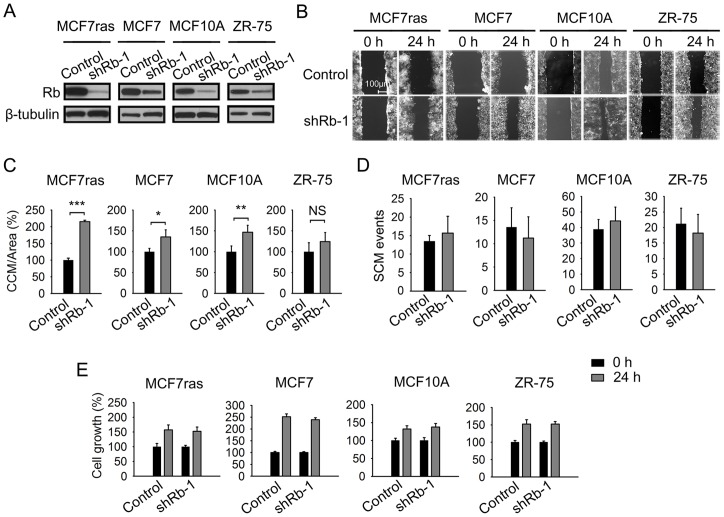
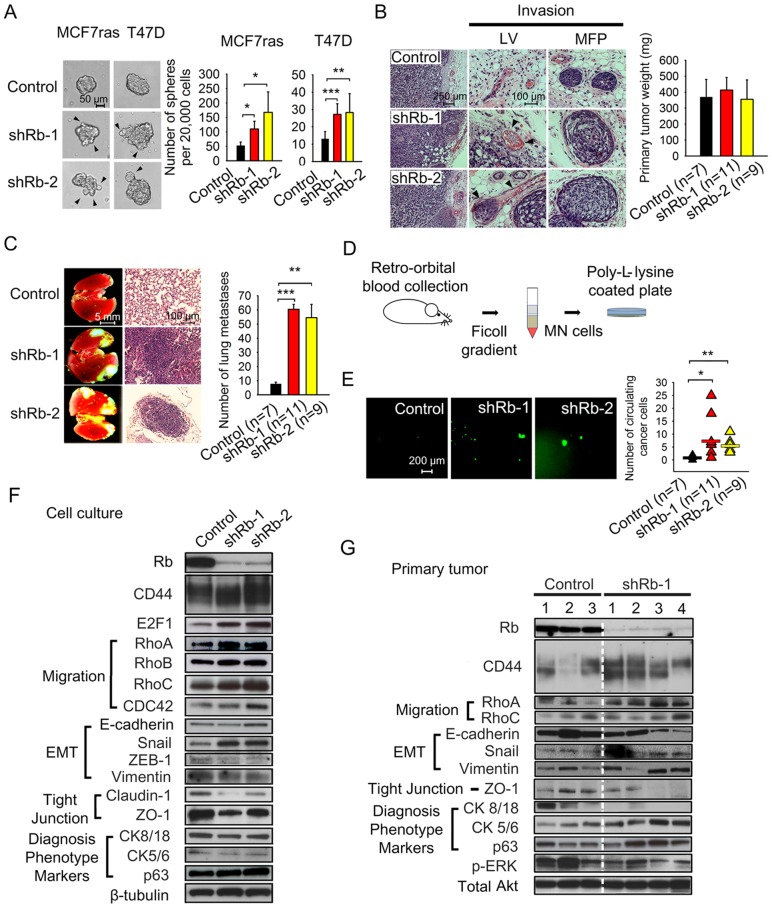
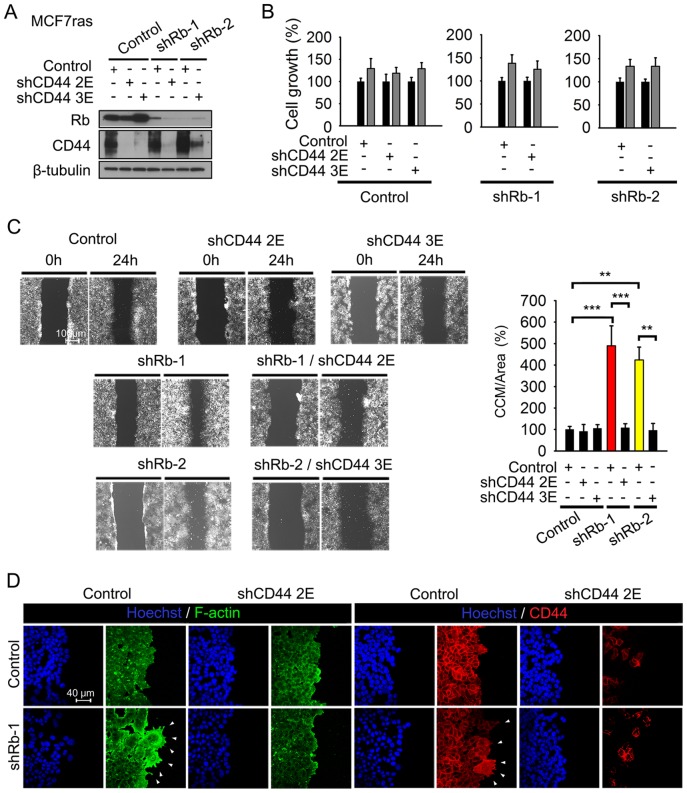
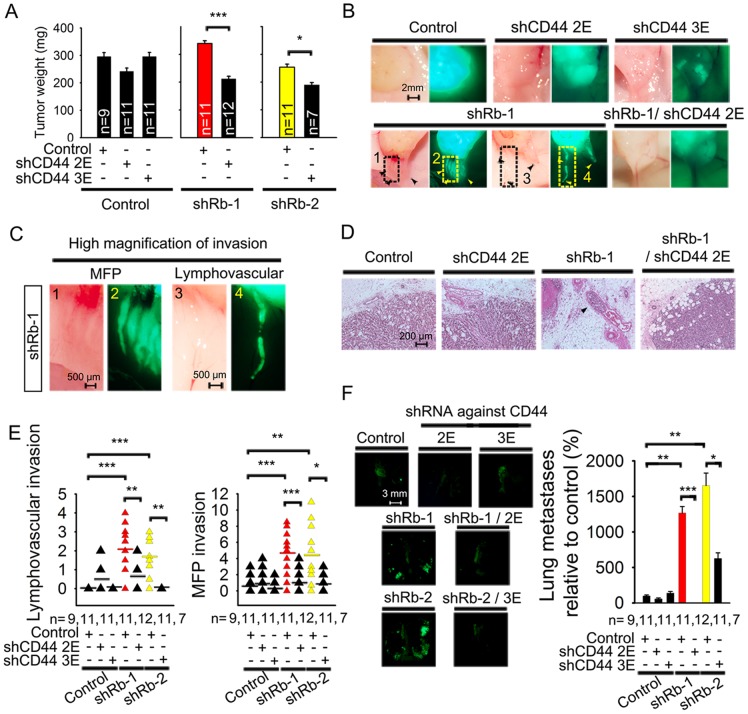
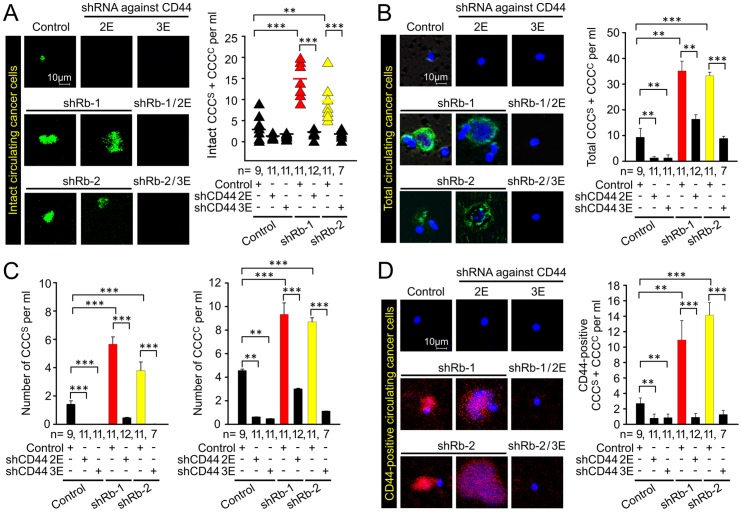
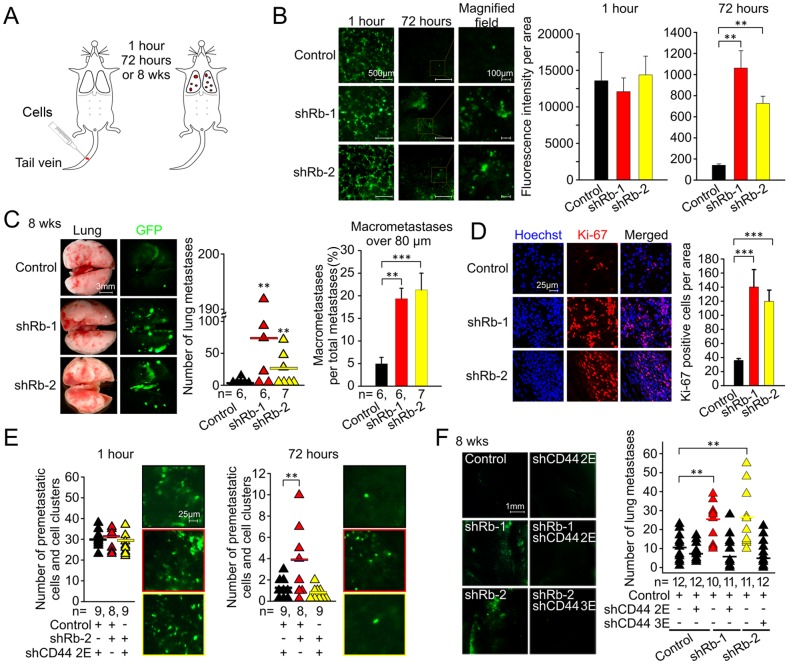
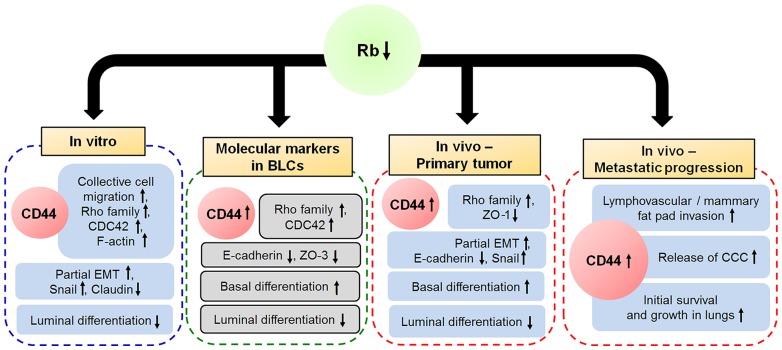
Basal-like breast carcinomas (BLCs) present with extratumoral lymphovascular invasion, are highly metastatic, presumably through a hematogenous route, have augmented expression of CD44 oncoprotein and relatively low levels of retinoblastoma (Rb) tumor suppressor. However, the causal relation among these features is not clear. Here, we show that Rb acts as a key suppressor of multiple stages of metastatic progression. Firstly, Rb suppresses collective cell migration (CCM) and CD44-dependent formation of F-actin positive protrusions in vitro and cell-cluster based lymphovascular invasion in vivo. Secondly, Rb inhibits the release of single cancer cells and cell clusters into the hematogenous circulation and subsequent metastatic growth in lungs. Finally, CD44 expression is required for collective motility and all subsequent stages of metastatic progression initiated by loss of Rb function. Altogether, our results suggest that Rb/CD44 pathway is a crucial regulator of CCM and metastatic progression of BLCs and a promising target for anti-BLCs therapy.


Conflict of interest statement

Competing Interests: The authors have declared that no competing interests exist.

Figures

Figure 1
Figure 1. Suppression of Rb expression in human breast cancer cell lines stimulates collective cell migration.
(A) Breast cancer cell lines were infected with a lentiviral construct expressing puromycin resistance gene and Rb-1 or control shRNA. Rb-knockdown efficiency in breast cancer cell lines was determined by a western blot. (B) Collective cell migration (CCM) assays for the indicated breast cancer cell lines derivatives. Scale bar, 100 μm. (C) Quantification of CCM for indicated breast cancer cell lines. CCM was quantified as an area covered between initial point and 24 hour point, and expressed as a percentage relative to the control. The experiment was performed three times in triplicate, data are presented as mean ± SD; equal variance Student's t-test, * p<0.05, ** p<0.01, *** p<0.001; NS indicates difference that was not significant. (D) Quantification of single cell migration (SCM) assays. Cells derived from indicated breast cancer cell lines were allowed to migrate overnight. The experiment was performed three times in triplicate. Data are presented as mean ± SD. (E) Breast cancer cell lines derivatives were analyzed 24 hours after seeding by MTT assay. Data from a representative experiment (n = 5) performed in triplicate are expressed as amount of metabolized MTT measured by absorbance normalized to the absorbance of control shRNA and presented as mean ± SD.
Figure 2
Figure 2. Loss of Rb expression promotes metastatic behavior in human breast cancer cell lines.
(A) Phase contrast images and quantification of mammosphere-forming potency of MCF7ras and T47D cells with Rb knockdown. Arrows indicate protrusions formed by invading cells and cell clusters. Scale bar, 50 μm; unequal variance Student's t-test, * p<0.05, ** p<0.01, *** p<0.001. (B) Morphology of primary tumors and lymphovascular (LV) or mammary fat pad (MFP) invasion. MCF7ras cells stably expressing shRNA against Rb or scrambled sequence were injected into the MFP of NOD/SCID mice. Primary tumors and other tissues were harvested after 8 weeks and H&E stained. Bar graph depicts primary tumor weight in each group expressed as mean ± SD where n is the number of animals in each group. Arrows indicate sites of lymphovascular invasion in Rb knockdown experiment. Scale bar, 50 μm (left panel) and 25 μm (middle panel). (C) Fluorescent and H&E stained images of metastatic tumor growth in lungs. Metastases containing EGFP-expressing Rb knockdown or control cells originated from orthotopic site. Images from n number of animals were quantified using ImageJ software (NIH). Data are presented as mean ± SD. Scale bar, 5 mm or 100 μm; equal variance Student's t-test, ** p<0.01, *** p<0.001. (D) Scheme showing isolation of circulating cancer cells (CCC) from mice bearing primary tumors. CCC were co-separated with the mononuclear fraction of blood and adhered to Poly-L-lysine-coated plates. (E) Fluorescent images and quantification of isolated EGFP-expressing circulating cancer cells and cell clusters. Scale bar, 200 μm; unequal variance Student's t-test, * p<0.05, ** p<0.01. (F) Western blot analysis of cell lysates from in vitro cultures of MCF7ras cells expressing Rb or control shRNA. β-tubulin staining was used as a loading control. (G) Western blot analysis of lysates from primary tumors. Total Akt was used as a loading control.
Figure 3
Figure 3. Suppression of Rb in basal mammary epithelium of E7 transgenic mice upregulates CD44 expression.
Immunofluorescent images of sections from mammary epithelium of E7 transgenic and control mice. Staining with antibodies to (A) E7, (B) Ki-67, and (C) CD44 and cytokeratins 5/6 was performed as described in the Materials and Methods section. Scale bar, 20 μm.
Figure 4
Figure 4. CD44 expression is essential for Rb knockdown-activated CCM in vitro.
(A) MCF7ras cells were co-infected with a lentiviral construct expressing puromycin resistance gene and Rb or control shRNA. After selection, cells were infected with shRNA against CD44 or a scrambled sequence in an EGFP-expressing vector. Lysates from all double knockdown cells were examined by western blot with anti-CD44 and anti-Rb antibodies. β-tubulin was used as a loading control. (B) Growth of MCF7ras cells with double knockdown of Rb and CD44 was analyzed by MTT assay, n = 3 experiments, data are presented as mean ± SD. Controls included single Rb knockdowns, and cells with shRNA against scrambled sequence with or without further infection with CD44 shRNA. (C) CCM of double knockdown cells. The analysis was performed as in Figure 1B. Data are presented as mean ± SD. The experiment was performed three times in triplicate. Scale bar, 100 μm; unequal variance Student's t-test, ** p<0.01, *** p<0.001. (D) Immunofluorescent analysis of F-actin, CD44 and E-cadherin expression in cells with single and double Rb/CD44 knockdowns. Scale bar, 40 μm.
Figure 5
Figure 5. CD44 expression is essential for lymphovascular invasion and lung metastases initiated by Rb knockdown.
(A) Weight of orthotopic primary tumors initiated by MCF7ras cells with double knockdown of Rb and CD44 eight weeks after mammary fat pad injection. Rb shRNAs and one of the control shRNAs were expressed in a vector conferring puromycin resistance. CD44 shRNAs and the second control shRNA were expressed in an EGFP vector. Data are presented as mean ± SD, n is the number of mice in each group. Equal variance Student's t-test, * p<0.05, *** p<0.001. (B) Representative phase contrast and fluorescent images of tumor-attached EGFP-positive cancer cells/clusters invading mammary fat pad or adjacent capillaries. Analysis was performed on the whole animal post mortem. Scale bar, 2 mm. (C) Representative high magnification phase contrast and fluorescent images of Rb-1 shRNA from Figure 5B with visible MFP and lymphovascular invasion. Scale bar, 500 μm. (D) H&E staining of primary tumors from mice injected with Rb and CD44 double knockdown cells. Arrows indicate areas of lymphovascular invasion. Scale bar, 200 μm. (E) Quantification of collective cell invasion into host mammary fat pad and extratumoral capillaries. Mammary fat pad invasion was quantified as incidence of EGFP-positive cell clusters in the area adjacent to tumor and not within a capillary (as judged by presence of erythrocytes in the phase contrast image). Cell clusters considered to be within a capillary were counted as lymphovascular invasion. Number of animals in each group is indicated as n. Unequal variance Student's t-test, * p<0.05, ** p<0.01, *** p<0.001. (F) Fluorescent images and quantification of lung metastases' numbers initiated by primary tumors 8 weeks after implantation of MCF7ras cells with double knockdown of Rb and CD44 into mammary fat pad. Number of metastases were quantified by ImageJ and normalized to the weight of primary tumor; number of animals in each group is indicated by n. Scale bar on fluorescent images, 3 mm. Unequal variance Student's t-test, * p<0.05, ** p<0.01, *** p<0.001.
Figure 6
Figure 6. Regulation of incidence of circulating single/clustered cancer cells (CCCS/CCCC) by Rb and CD44.
(A) Fluorescent images and quantification of circulating live cancer cells and cell clusters co-isolated with mononuclear fraction from blood of animals bearing tumors. The tumors were induced by orthotopic implantation of MCF7ras cells expressing shRNAs against Rb, CD44, and their combination, along with respective controls. EGFP is expressed in cytoplasm and its presence indicates both cancer cell identity and presumably intact membrane. Number of animals in each group is depicted on the graph. Scale bar, 10 μm; unequal variance Student's t-test, ** p<0.01, *** p<0.001. (B) Fluorescent images and quantification of total circulating cancer cells (both alive and dead) detected with a human-specific antibody to a nuclear antigen. Data are presented as mean ± SEM. Scale bar, 10 μm; unequal variance Student's t-test, ** p<0.01, *** p<0.001. (C) Number of CCCS and CCCC in the total number of cancer cells detected with a human-specific antibody to a nuclear antigen. Data are presented as mean ± SEM; unequal variance Student's t-test, ** p<0.01, *** p<0.001. (D) Fluorescent images and quantification of CD44 positive cancer cells detected with a human-specific anti-CD44 antibody. Data are presented as mean ± SEM. Scale bar, 10 μm; unequal variance Student's t-test, ** p<0.01, *** p<0.001.
Figure 7
Figure 7. Rb/CD44-dependent regulation of initial cell survival and metastatic progression.
(A) Illustration of tail vein injection experiment in mouse. (B) MCF7ras cells were infected with shRNA to Rb or control sequence expressed in an EGFP vector. The resulting cells were injected in tail vein and fluorescent images of whole lungs were taken at indicated time points. Representative images are shown. Total fluorescence of whole lung images was quantified and is plotted as mean ± SD. Scale bar, 500 μm (left and middle panels) and 100 μm (right panel); equal variance Student's t-test, ** p<0.01. (C) Metastatic-like tumor growth in lungs 8 weeks after tail vein injection. Total number of metastases quantified by ImageJ is plotted into the graph on the left. The ratio of macrometastases to the total number of metastases in each pair of lungs is presented in the graph on the right. The number of animals in each group is indicated as n. Data is shown as mean ± SEM. Scale bar, 3 mm; equal variance Student's t-test, ** p<0.01, *** p<0.001. (D) Immunofluorescence of frozen sections from lungs of mice with metastatic growth after tail vein injection. Number of Ki-67 positive cells was quantified by ImageJ and is presented as mean ± SD. Scale bar, 25 μm; equal variance Student's t-test, *** p<0.001. (E) Dissecting microscope fluorescent images and quantification of cells/cell clusters in lungs one hour or 72 hours after tail vein injection of MCF7ras cells with suppressed Rb and/or CD44 expression. Representative pictures are shown. Scale bar, 25 μm; unequal variance Student's t-test, ** p<0.01. (F) Whole lungs fluorescent images from metastatic tumor growth eight weeks after tail vein injection of single/double Rb/CD44 knockdowns. Number of metastatic foci per mouse was quantified by ImageJ and is plotted in the graph. Scale bar for fluorescent images, 1 mm; unequal variance Student's t-test, ** p<0.01.
Figure 8
Figure 8. Model of Rb-CD44 axis in metastatic progression.
Rb/CD44 regulate CCM, lymphovascular and mammary fat pad invasion, release of CCC and initiation and progression of metastasis in breast tumorigenesis. Inactivation of Rb suppresses epithelial integrity and promotes CD44-dependent CCM in vitro. In vivo, both loss of Rb and presence of CD44 are required for mammary fat pad and lymphovascular invasion, release of CCC into the blood stream, early survival, and subsequent metastatic growth in lungs. Clinical expression data suggest that Rb expression is suppressed and CD44 is upregulated in BLCs. In addition low Rb expression correlates with higher expression of basal markers, low expression of luminal markers, low expression of markers of epithelial integrity and high levels of Rho family proteins involved in cell motility and with.

References

    1. Talmadge JE, Fidler IJ (2010) AACR centennial series: the biology of cancer metastasis: historical perspective. Cancer Res 70: 5649–5669. - PMC - PubMed
    1. Friedl P, Alexander S (2011) Cancer invasion and the microenvironment: plasticity and reciprocity. Cell 147: 992–1009. - PubMed
    1. Ewald AJ, Brenot A, Duong M, Chan BS, Werb Z (2008) Collective epithelial migration and cell rearrangements drive mammary branching morphogenesis. Dev Cell 14: 570–581. - PMC - PubMed
    1. Sabatier R, Jacquemier J, Bertucci F, Esterni B, Finetti P, et al. (2011) Peritumoural vascular invasion: a major determinant of triple-negative breast cancer outcome. Eur J Cancer 47: 1537–1545. - PubMed
    1. Gauthier ML, Berman HK, Miller C, Kozakeiwicz K, Chew K, et al. (2007) Abrogated response to cellular stress identifies DCIS associated with subsequent tumor events and defines basal-like breast tumors. Cancer Cell 12: 479–491. - PMC - PubMed

Publication types

MeSH terms