Review
. 2013 Jan;15(1):2-20.
doi: 10.5853/jos.2013.15.1.2. Epub 2013 Jan 31.

Stroke statistics in Korea: part I. Epidemiology and risk factors: a report from the korean stroke society and clinical research center for stroke

Affiliations
Review

Stroke statistics in Korea: part I. Epidemiology and risk factors: a report from the korean stroke society and clinical research center for stroke

Keun-Sik Hong et al. J Stroke. 2013 Jan.

Abstract

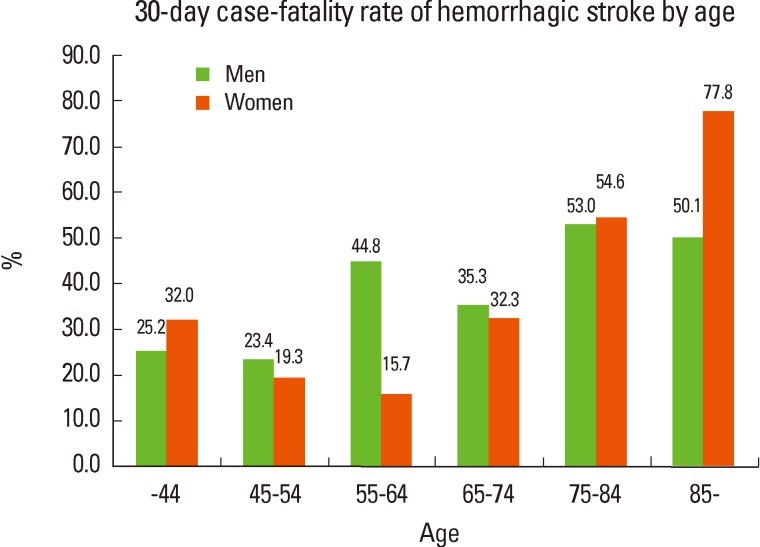
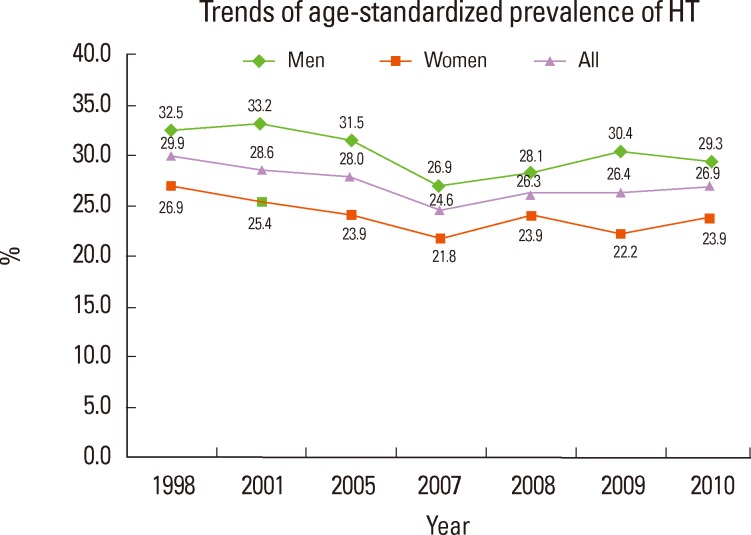
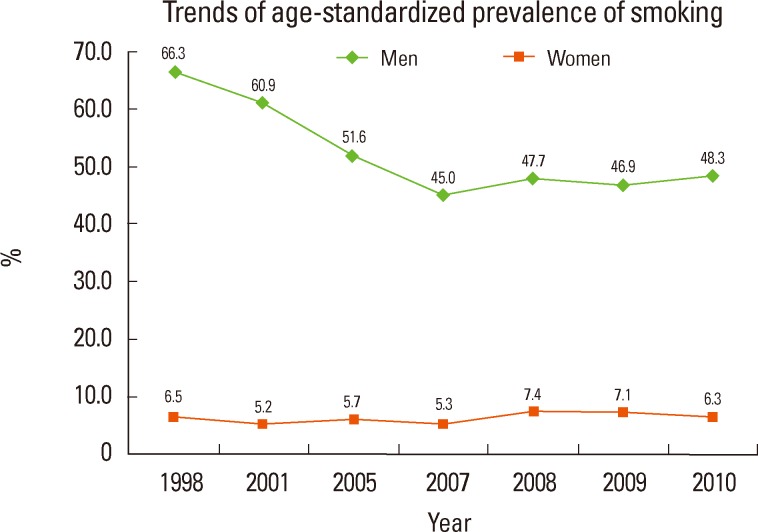
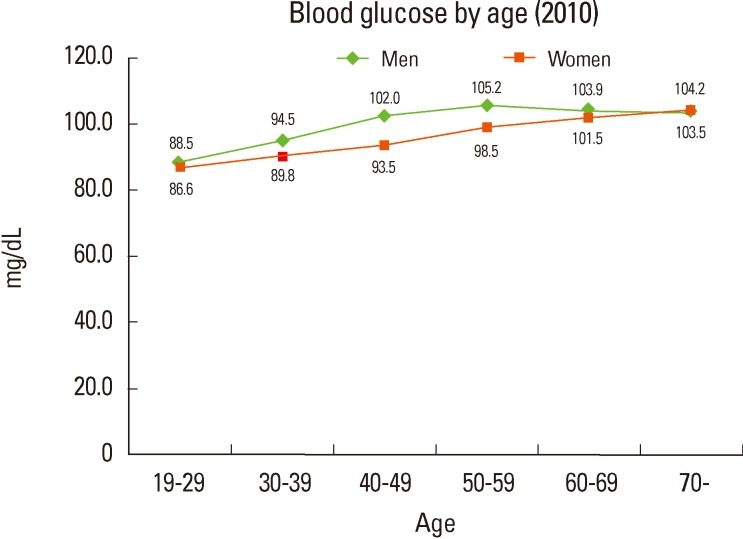
The aim of the Part I of Stroke Statistics in Korea is to summarize nationally representative data of the epidemiology and risk factors of stroke in a single document. Every year, approximately 105,000 people experience a new or recurrent stroke and more than 26,000 die of stroke, which indicates that every 5 minutes stroke attacks someone and every 20 minutes stroke kills someone in Korea. Stroke accounts for roughly 1 of every 10 deaths. The estimated stroke prevalence is about 795,000 in people aged ≥30 years. The nationwide total cost for stroke care was 3,737 billion Korean won (US$3.3 billion) in 2005. Fortunately, the annual stroke mortality rate decreased substantially by 28.3% during the first decade of the 21th century (53.2/100,000 in 2010). Among OECD countries, Korea had the lowest in-hospital 30-day case-fatality rate for ischemic stroke and ranked third lowest for hemorrhagic stroke in 2009. The proportion of ischemic stroke has steadily increased and accounted for 76% of all strokes in 2009. According to hospital registry studies, the 90-day mortality rate was 3-7% for ischemic stroke and 17% for intracerebral hemorrhage. For risk factors, among Korean adults ≥30 years of age, one in 3-4 has hypertension, one in 10 diabetes, and one in 7 hypercholesterolemia. One in 3 Korean adults ≥19 years of age is obese. Over the last 10 years, the prevalence of hypertension slightly decreased, but the prevalence of diabetes, hypercholesterolemia, and obesity increased. Smoking prevalence in men has decreased, but is still as high as 48%. This report could be a valuable resource for establishing health care policy and guiding future research directions.

Keywords: Epidemiology; Risk factor; Statistics; Stroke.


Conflict of interest statement

The authors have no financial conflicts of interest.

Figures

Figure 1
Figure 1
Age-specific stroke incidence. Source: Korean Center for Disease Control. Construction of National Surveillance System for Cardiovascular & Cerebrovascular Diseases 2006.
Figure 2
Figure 2
Sex- and age-specific stroke incidence. Source: Korean Center for Disease Control. Construction of National Surveillance System for Cardiovascular & Cerebrovascular Diseases 2006.
Figure 3
Figure 3
Any stroke, proportion of each age group. Source: Korean Center for Disease Control. Construction of National Surveillance System for Cardiovascular & Cerebrovascular Diseases 2006.
Figure 4
Figure 4
Ischemic stroke, proportion of each age group. Source: Korean Center for Disease Control. Construction of National Surveillance System for Cardiovascular & Cerebrovascular Diseases 2006.
Figure 5
Figure 5
Unclassified stroke, proportion of each age group. Source: Korean Center for Disease Control. Construction of National Surveillance System for Cardiovascular & Cerebrovascular Diseases 2006.
Figure 6
Figure 6
Hemorrhagic stroke, proportion of each age group. Source: Korean Center for Disease Control. Construction of National Surveillance System for Cardiovascular & Cerebrovascular Diseases 2006.
Figure 7
Figure 7
Age- and sex-standardized stroke incidence in population with 35-74 years. Source: Korean Center for Disease Control. Development of Strategy and Action Plans for Major Chronic Diseases Prevention and Control 2004.
Figure 8
Figure 8
Admission for primary diagnostic code. Source: Korean Health Insurance Review & Assessment Service. Report of Assessment for Quality of Acute Stroke Care in Korea 2005-2010.
Figure 9
Figure 9
Trend of relative proportion of admission for ischemic and hemorrhagic stroke. Source: Korean Health Insurance Review & Assessment Service. Report of Assessment for Quality of Acute Stroke Care in Korea 2005-2010.
Figure 10
Figure 10
Stroke prevalence by age. Source: KNHANES 2005.
Figure 11
Figure 11
Stroke prevalence by age and sex. Source: Korean Center for Disease Control. Construction of National Surveillance System for Cardiovascular & Cerebrovascular Diseases 2006.
Figure 12
Figure 12
Stroke prevalence by year. Source: KNHANES 2010.
Figure 13
Figure 13
Stroke prevalence by income. Source: KNHANES 2010.
Figure 14
Figure 14
Stroke prevalence by income, men. Source: KNHANES 2010.
Figure 15
Figure 15
Stroke prevalence by income, women. Source: KNHANES 2010.
Figure 16
Figure 16
Trend of crude stroke mortality rate. Source: Korean Statistical Information Service (KOSIS). Annual Report on the Cause of Death Statistics, Korean Center for Disease Control. Health Behavior and Chronic Disease Statistics 2005.
Figure 17
Figure 17
Trend of actual number of stroke deaths. Source: Korean Statistical Information Service (KOSIS). Annual Report on the Cause of Death Statistics, Korean Center for Disease Control. Health Behavior and Chronic Disease Statistics 2005.
Figure 18
Figure 18
Proportion of stroke death among all deaths by year. Source: Korean Statistical Information Service (KOSIS). Annual Report on the Cause of Death Statistics, Korean Center for Disease Control. Health Behavior and Chronic Disease Statistics 2005.
Figure 19
Figure 19
Age-specific stroke mortality rate (2010). Source: Korean Statistical Information Service (KOSIS). Annual Report on the Cause of Death Statistics.
Figure 20
Figure 20
Geographic age-standardized stroke mortality rate (2010). Source: Korean Statistical Information Service (KOSIS). Annual Report on the Cause of Death Statistics.
Figure 21
Figure 21
30-day case-fatality rate. Source: Korean Center for Disease Control. Construction of National Surveillance System for Cardiovascular & Cerebrovascular Diseases 2006.
Figure 22
Figure 22
30-day case-fatality rate of stroke by age. Source: Korean Center for Disease Control. Construction of National Surveillance System for Cardiovascular & Cerebrovascular Diseases 2006.
Figure 23
Figure 23
30-day case-fatality rate of ischemic stroke by age. Source: Korean Center for Disease Control. Construction of National Surveillance System for Cardiovascular & Cerebrovascular Diseases 2006.
Figure 24
Figure 24
30-day case-fatality rate of hemorrhagic stroke by age. Source: Korean Center for Disease Control. Construction of National Surveillance System for Cardiovascular & Cerebrovascular Diseases 2006.
Figure 25
Figure 25
In-hospital case-fatality rate within 30 days after admission of ischemic stroke. Source: OECD (2011), Health at a Glance 2011: OECD Indicators, OECD Publishing. (http://dx.doi.org/10.1787/health_glance-2011-en).
Figure 26
Figure 26
In-hospital case-fatality rate within 30 days after admission of hemorrhagic stroke. Source: OECD (2011), Health at a Glance 2011: OECD Indicators, OECD Publishing. (http://dx.doi.org/10.1787/health_glance-2011-en).
Figure 27
Figure 27
Crude in-hospital mortality rates for acute stroke admission. Source: Korean Health Insurance Review & Assessment Service. Report of Assessment for Quality of Acute Stroke Care in Korea 2010.
Figure 28
Figure 28
Total cost for admission and out-patient clinic paid by Korean Health Insurance Agency. Source: Korean Health Insurance Review & Assessment Service. Report of Assessment for Quality of Acute Stroke Care in Korea 2005-2010.
Figure 29
Figure 29
Average admission cost for stroke care. Source: Korean Health Insurance Review & Assessment Service. Report of Assessment for Quality of Acute Stroke Care in Korea 2005-2010.
Figure 30
Figure 30
Trends of age-standardized prevalence of HT. Source: KNHANES 2010.
Figure 31
Figure 31
HT prevalence by age (2010). Source: KNHANES 2010.
Figure 32
Figure 32
Blood pressure by age (2010). Source: KNHANES 2010.
Figure 33
Figure 33
Trends of awareness, treatment, and control of HT. Source: KNHANES 2010.
Figure 34
Figure 34
Awareness, treatment, control of HT by age and sex (2008-2010). Source: KNHANES 2010.
Figure 35
Figure 35
Trends of age-standardized prevalence of smoking. Source: KNHANES 2010.
Figure 36
Figure 36
Smoking prevalence by age (2010). Source: KNHANES 2010.
Figure 37
Figure 37
Trends of age-standardized prevalence of DM. Source: KNHANES 2010.
Figure 38
Figure 38
DM prevalence by age (2010). Source: KNHANES 2010.
Figure 39
Figure 39
Blood glucose by age (2010). Source: KNHANES 2010.
Figure 40
Figure 40
Trends of awareness, treatment, and control of DM. Source: KNHANES 2010.
Figure 41
Figure 41
Awareness, treatment, control of DM by age and sex (2008-2010) Source: KNHANES 2010.
Figure 42
Figure 42
Trends of age-standardized prevalence of dyslipidemia. Source: KNHANES 2010.
Figure 43
Figure 43
Hypercholesterolemia prevalence by age and sex (2010). Source: KNHANES 2010.
Figure 44
Figure 44
Low HDL-cholesterol prevalence by age and sex (2010).Source: KNHANES 2010.
Figure 45
Figure 45
Hypertriglyceridemia prevalence by age and sex (2010). Source: KNHANES 2010.
Figure 46
Figure 46
Source: Total cholesterol by age and sex (2010). KNHANES 2010.
Figure 47
Figure 47
HDL-cholesterol and triglyceride by age and sex (2010). Source: KNHANES 2010.
Figure 48
Figure 48
Trends of awareness, treatment, and control of hypercholesterolemia. Source: KNHANES 2010.
Figure 49
Figure 49
Awareness, treatment, control of hypercholesterolemia by age and sex. Source: KNHANES 2010.
Figure 50
Figure 50
Trends of age-standardized prevalence of obesity (BMI≥25). Source: KNHANES 2010.
Figure 51
Figure 51
Obesity (BMI≥25) prevalence by age and sex (2010). Source: KNHANES 2010.
Figure 52
Figure 52
BMI by age and sex (2010). Source: KNHANES 2010.
Figure 53
Figure 53
Trends of age-standardized recommended physical activity. Source: KNHANES 2010.
Figure 54
Figure 54
Recommended physical activity by age and sex (2010). Source: KNHANES 2010.
Figure 55
Figure 55
PAR for ischemic stroke by sex. Source: Park et al. with permission of the publisher.

References

    1. Organization for Economic Cooperation and Development. OECD Economic Surveys: Korea 2010. OECD Web site. [Accessed April 2011]. http://www.oecd.org/dataoecd/14/34/45432048.pdf.
    1. Asplund K, Eriksson M, Persson O. Country comparisons of human stroke research since 2001. Stroke. 2012;43:830–837. - PubMed
    1. Korean Center for Disease Control. Construction of national surveillance system for cardiovascular & cerebrovascular diseases. 2006.
    1. Jung KH, Lee SH, Kim BJ, Yu KH, Hong KS, Lee BC, et al. Secular trends in ischemic stroke characteristics in a rapidly developed country: results from the Korean Stroke Registry Study (secular trends in Korean stroke) Circ Cardiovasc Qual Outcomes. 2012;5:327–334. - PubMed
    1. Korean Statistical Information Service (KOSIS) Population projections and summary indicator for Korea (Population items) [Accessed July 18, 2012]. http://kosis.kr/eng/database/database_001000.jsp?listid=A&subtitle=Popul....

LinkOut - more resources