Review
. 2013 May;15(2):99-108.
doi: 10.5853/jos.2013.15.2.99. Epub 2013 May 31.

Multimodality monitoring in the neurointensive care unit: a special perspective for patients with stroke

Affiliations
Review

Multimodality monitoring in the neurointensive care unit: a special perspective for patients with stroke

Sang-Bae Ko. J Stroke. 2013 May.

Abstract

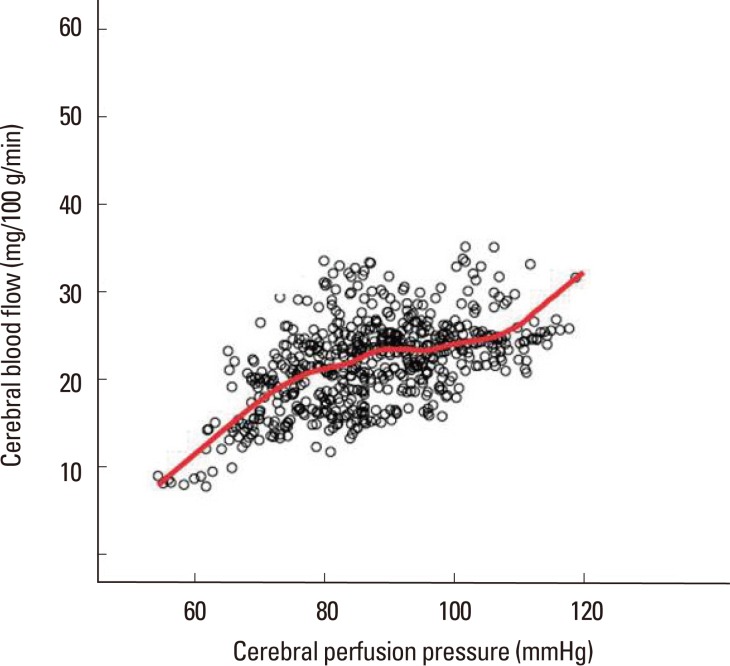
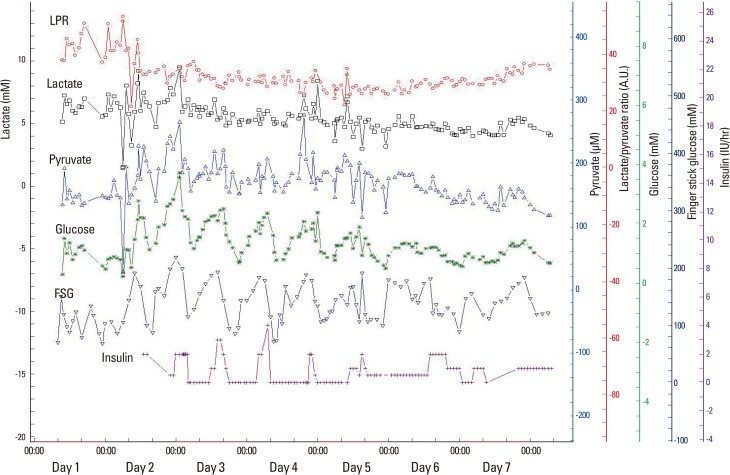
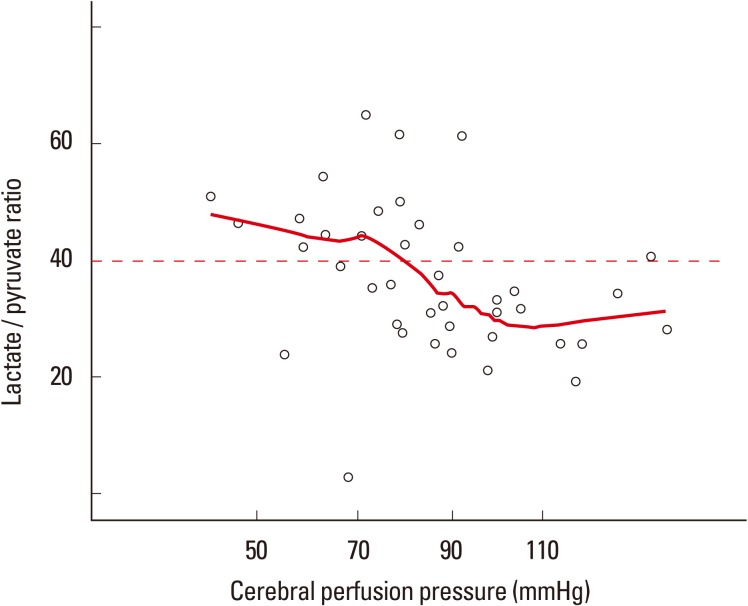
Multimodality monitoring (MMM) is a recently developed method that aids in understanding real-time brain physiology. Early detection of physiological disturbances is possible with the help of MMM, which allows identification of underlying causes of deterioration and minimization of secondary brain injury (SBI). MMM is especially helpful in comatose patients with severe brain injury because neurological examinations are not sensitive enough to detect SBI. The variables frequently examined in MMM are hemodynamic parameters such as intracranial pressure, cerebral perfusion pressure, and mean arterial pressure; brainspecific oxygen tension; markers for brain metabolism including glucose, lactate, and pyruvate levels in brain tissue; and cerebral blood flow. Continuous electroencephalography can be performed, if needed. The majority of SBIs stem from brain tissue hypoxia, brain ischemia, and seizures, which lead to a disturbance in brain oxygen levels, cerebral blood flow, and electrical discharges, all of which are easily detected by MMM. In this review, we discuss the clinical importance of physiological variables as well as the practical applicability of MMM in patients with stroke.

Keywords: Coma; Critical care; Physiologic monitoring; Stroke.


Conflict of interest statement

The authors have no financial conflicts of interest.

Figures

Figure 1
Figure 1
A representative figure showing the location of multimodality monitoring probes. Using a double or triple lumen cranial bolt system, multiple probes were fixed to the skull (A). Because the majority of the monitoring probes were radio-opaque, probe location was easily identified in scout images of pre-contrast brain computed tomography in the anteroposterior (B) and lateral views (C).
Figure 2
Figure 2
Relationship between intracranial pressure and intracranial volume. As intracranial volume increases, a compensatory capacity limits abrupt surges of intracranial pressure; as brain compliance decreases, a small increase in intracranial volume results in a dramatic increase in the intracranial pressure. The fatigue point is usually located around 20 mmHg in the general population (dashed line).
Figure 3
Figure 3
Relationship among the cerebral hemodynamic parameters. In cases with intact cerebral autoregulation, constant cerebral blood flow is maintained within autoregulating ranges of blood pressure. As the blood pressure drops, cerebral blood vessels need to dilate in order to maintain constant blood flow, which translates into surges in the intracranial pressure (A). In cases where autoregulation is disrupted, the capacity of the blood vessel is passively dependent on the perfusion pressure. Therefore, the correlation between intracranial pressure and blood pressure is linear (B). (This figure was modified from Crit Care Clin 2007;23:507-538 and Neurocrit Care 2004;1:289).
Figure 4
Figure 4
Identifying optimal cerebral perfusion pressure. In patients with a loss of autoregulation, the relationship between intracranial pressure and mean arterial pressure appears to be linear. When the pressure reactivity index was plotted at a specific cerebral perfusion pressure, there was no nadir in the plot, suggesting no better spot for autoregulation (A). In patients with intact autoregulation, the mean pressure reactivity index values at specific cerebral perfusion pressure ranges were lower than those at other cerebral perfusion pressures, suggesting that the nadir existed in terms of the pressure reactivity-cerebral perfusion pressure plot and that the optimal cerebral perfusion pressure range existed (B).
Figure 5
Figure 5
Correlation between cerebral blood flow and cerebral perfusion pressure. The scatter plot illustrates that a patient with intact autoregulation has CPP range between 70-100 mmHg. The red line represents locally weighted scatterplot smoothing regression line.
Figure 6
Figure 6
Results of microdialysis. Brain glucose and peripheral fingerstick glucose levels show adequate correlation, suggesting that the brain glucose level is passively dependent on peripheral glucose levels. Although intermittent continuous insulin infusion maintains peripheral glucose levels within an acceptable range (between 100-200 mg/dL), brain glucose levels frequently drop below a critical level (0.7 mM) with intensive glucose control. LPR, Lactate/pyruvate ratio; FSG, fingerstick glucose; A.U.,arbitrary unit.
Figure 7
Figure 7
Relationship between microdialysis results and cerebral perfusion pressure. As cerebral perfusion pressure drops, there is a modest surge in the brain lactate/pyruvate ratio, suggesting the brain glucose metabolism is cerebral perfusion pressure dependent. The red line represents locally weighted scatterplot smoothing regression line.

References

    1. Kramer AH, Zygun DA. Do neurocritical care units save lives? Measuring the impact of specialized ICUs. Neurocrit Care. 2011;14:329–333. - PubMed
    1. Wright WL. Multimodal monitoring in the ICU: when could it be useful? J Neurol Sci. 2007;261:10–15. - PubMed
    1. Sahuquillo J. Does multimodality monitoring make a difference in neurocritical care? Eur J Anaesthesiol Suppl. 2008;42:83–86. - PubMed
    1. Hemphill JC, Andrews P, De Georgia M. Multimodal monitoring and neurocritical care bioinformatics. Nat Rev Neurol. 2011;7:451–460. - PubMed
    1. Le Roux P. Physiological monitoring of the severe traumatic brain injury patient in the intensive care unit. Curr Neurol Neurosci Rep. 2013;13:331. - PubMed

LinkOut - more resources