. 2013:4:2924.
doi: 10.1038/ncomms3924.

Early dynamic fate changes in haemogenic endothelium characterized at the single-cell level

Affiliations

Early dynamic fate changes in haemogenic endothelium characterized at the single-cell level

Gemma Swiers et al. Nat Commun. 2013.

Abstract

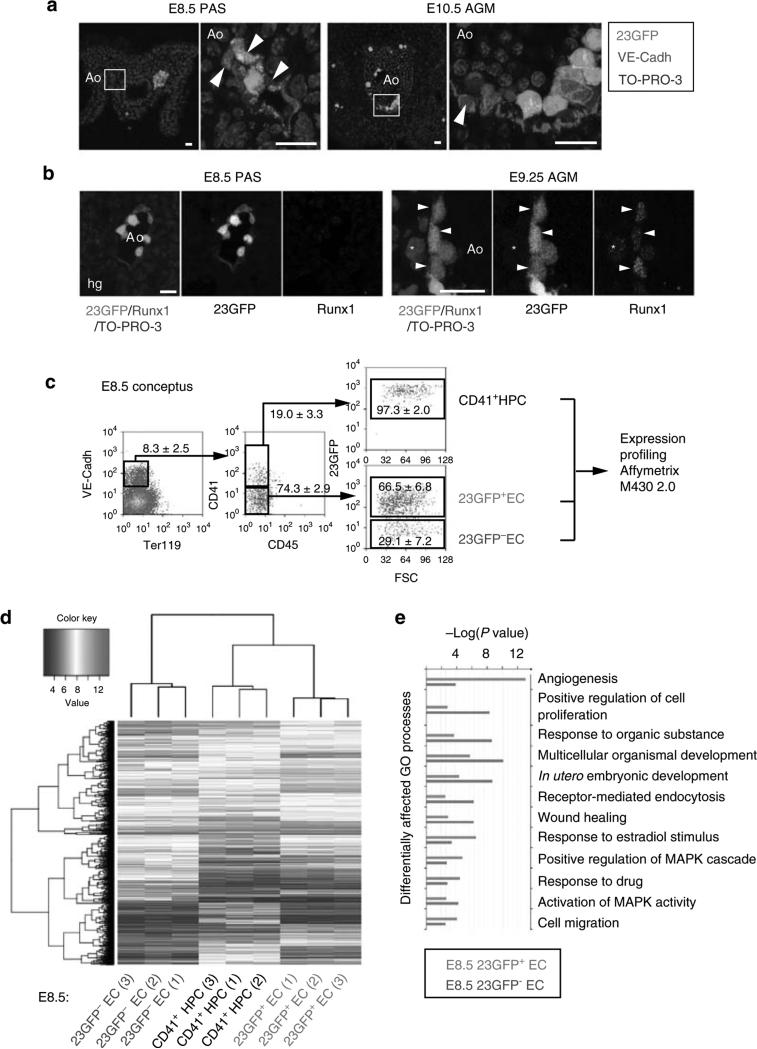
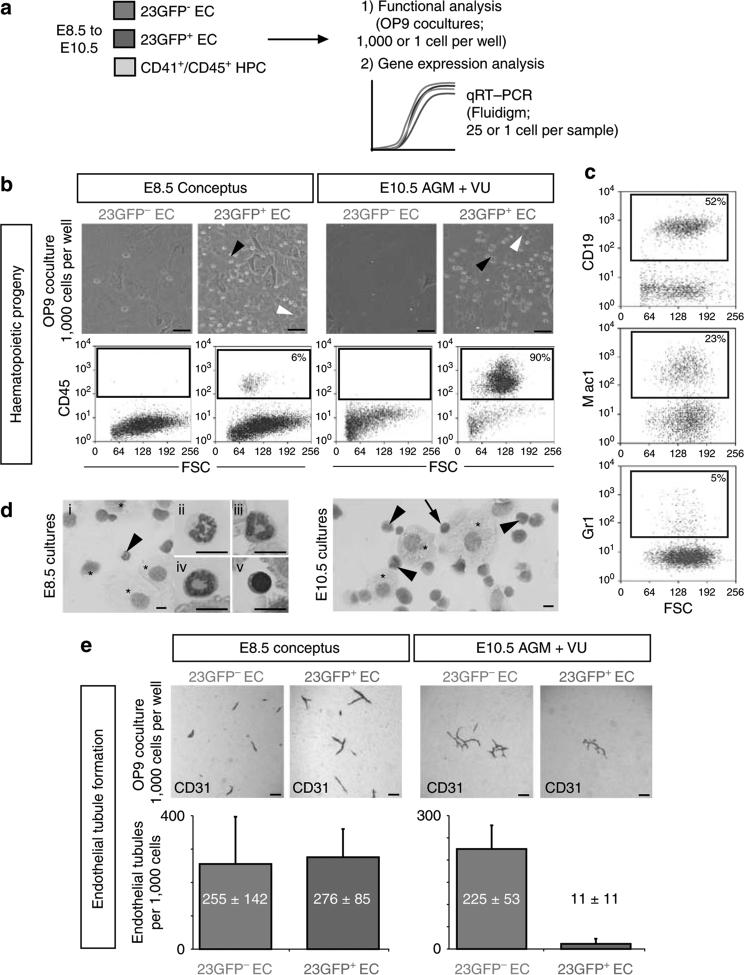
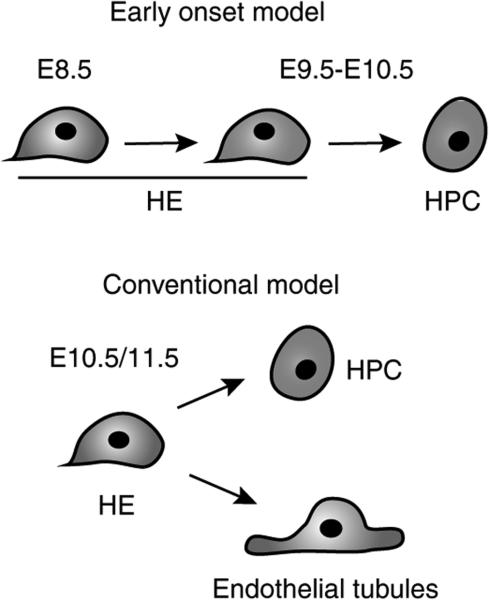
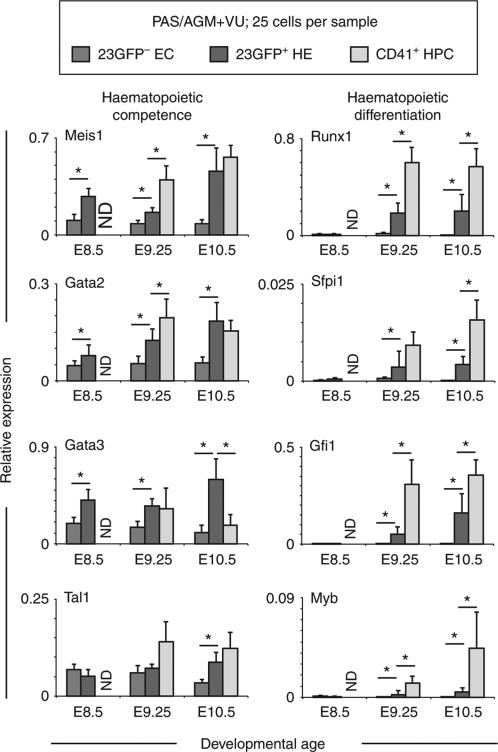
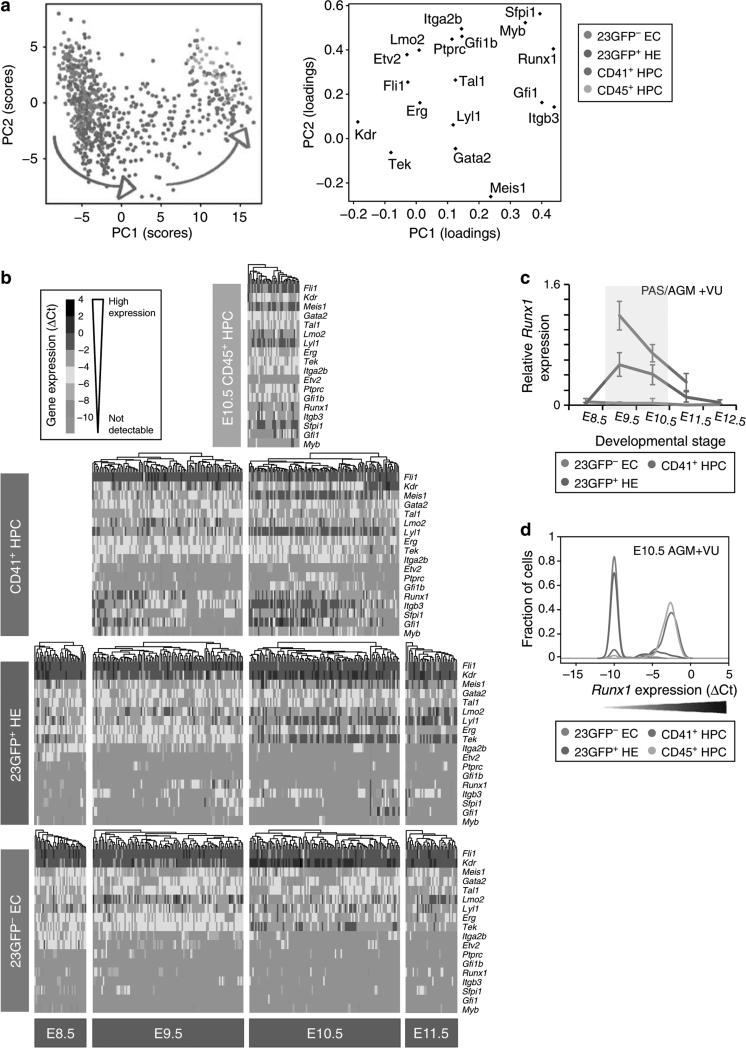
Haematopoietic stem cells (HSCs) are the founding cells of the adult haematopoietic system, born during ontogeny from a specialized subset of endothelium, the haemogenic endothelium (HE) via an endothelial-to-haematopoietic transition (EHT). Although recently imaged in real time, the underlying mechanism of EHT is still poorly understood. We have generated a Runx1 +23 enhancer-reporter transgenic mouse (23GFP) for the prospective isolation of HE throughout embryonic development. Here we perform functional analysis of over 1,800 and transcriptional analysis of 268 single 23GFP(+) HE cells to explore the onset of EHT at the single-cell level. We show that initiation of the haematopoietic programme occurs in cells still embedded in the endothelial layer, and is accompanied by a previously unrecognized early loss of endothelial potential before HSCs emerge. Our data therefore provide important insights on the timeline of early haematopoietic commitment.


Figures

Figure 1
Figure 1. The Runx1 + 23 haematopoietic-specific enhancer marks a distinct subset of endothelium in mouse haemogenic sites
(a) VE-Cadh immunostaining (red) and 23GFP transgene expression (green) in 10 μm cryosections through the posterior region of E8.5 (7–10 sp) and E10.5 (31–34 sp) 23GFP transgenic embryos. Nuclear stain (TO-PRO-3) in blue. Higher magnification images of the boxed areas show co-expression of VE-Cadh and 23GFP. Arrowhead: example of 23GFP expression in VE-Cadh+ endothelial cells. Scale bar, 20 μm. (b) Merged and single channel images of Runx1 immunohistochemistry on 23GFP expressing sections of E8.5 (10 sp) and E9.25 (23 sp). Arrowhead: 23GFP and Runx1 co-expression, asterisk: Runx1 but no 23GFP expression. Ao, dorsal aorta; Hg, hind gut; Vit, vitelline artery; scale bar, 20 μm. (c) Flow cytometric analysis further corroborates 23GFP expression in E8.5 (4–12 sp) VE-Cadh+ Ter119 CD45 CD41 endothelial cells. Representative dot plots and mean percentages±s.d. are from three independent analyses of pooled tissues. Sort gates are indicated. (d) Hierarchical clustering and heatmap of whole-genome gene expression data (Affymetrix) from 23GFP+ and 23GFP VE-Cadh+ Ter119 CD45 CD41 EC and 23GFP+VE-Cadh+ Ter119 CD45 CD41+ HPC. Numbers in parentheses indicate the biological sample. There are 516 unique annotated probe IDs differentially expressed between 23GFP+ and 23GFP ECs (see Supplementary Data 1 for the full list). The top differentially affected GO processes overrepresented in this list are shown in (e).
Figure 2
Figure 2. Haemogenic endothelium is restricted to the 23GFP+ EC population
(a) Experimental approach for data shown in Figs 2–5. (b) Generation of haematopoietic progeny by 23GFP+ or 23GFP VE-Cadh+Ter119 CD45 CD41 ECs from E8.5 (5–12 sp) concepti or E10.5 (29–35 sp) AGM VU on OP9 stroma. Black arrowhead: round semi-adherent haematopoietic cells; white arrowhead: adherent cobblestone-like cells (scale bar, 50 μm). Flow cytometric analysis confirmed the presence of CD45+ haematopoietic cells. Data are representative of at least three independent cocultures. (c) Representative flow cytometric analysis of haemogenic cultures demonstrates both B-lymphoid (CD19) and myeloid (Mac1 or Gr1) cell generation. (d) May-Grünwald Giemsa stained cytospins of haemogenic cultures reveal myeloid (arrowhead, and ii–iv) and blast-like (arrow and v) haematopoietic cells. Asterisks point out OP9 stromal cells. Scale bar, 10 μm. (e) 23GFP+ or 23GFP VE-Cadh+ Ter119 CD45 CD41 cells were isolated from E8.5 (5–12 sp) conceptus or E10.5 (29–35 sp) AGM + VU, and cultured on OP9 stroma to support endothelial tubule formation. Tubules were visualized by CD31 staining after 4 days of culture. Representative images and quantification (mean±s.d.) of endothelial tubules generated in OP9 cocultures by 23GFP+ or 23GFP VE-Cadh+ Ter119 CD45 CD41 cells isolated from E8.5 (5–12 sp) conceptus or E10.5 (29–35 sp) AGM VU (n = 3). Only very limited endothelial tubule formation was observed in the 23GFP+ EC population at E10.5, shown is one of 11 tubules. Scale bar, 200 μm.
Figure 3
Figure 3. Early onset model of EHT
In the conventional model of EHT (right side), haemogenic endothelium is considered as an endothelial cell capable of generating endothelial tubules and giving rise to haematopoietic progeny. This model is not supported by the functional data. In contrast, the data suggest an alternative model of EHT, with 23GFP+ haemogenic endothelium undergoing an early onset of haematopoietic differentiation, and loss of endothelial potential.
Figure 4
Figure 4
Fluidigm qRT–PCR analysis of 23GFP+ (green) and 23GFP (blue) VE-Cadh+Ter119 CD45 CD41 ECs and/or VE-Cadh+ Ter119 CD45 CD41+ HPCs (grey) from E8.5 (5–9 sp), 9.25 (18-22 sp), and 10.5 (32–36 sp) PAS/AGM + VU. Data are normalized to the mean of the reference genes Hprt1 and BAct and are the mean±s.d. of a total of 4–7 pools of 25 cells from two independent experiments. ND, not done. *P<0.05 (Student's t-test).
Figure 5
Figure 5. Single-cell expression analysis reveals the transitory nature of 23GFP+ HE
(a) Principal component projections of all 803 cells in the first and second components. Data represent all single cells, from all time points, analysed together. Individual cells were coloured retrospectively based on the phenotype they were sorted on. Arrows indicate the direction of maturation of 23GFP+ HE cells (green) and CD41+ HPC (red). (b) Heat maps showing the expression of the 18 endothelial- and haematopoietic-related genes in single cells for all cell types analysed. The data are ΔCt to the mean of Atp5a1 and Ubc reference genes and colour coded as ΔCt steps. Columns represent individual cells, displayed after hierarchical clustering so that similar expression profiles are closer together, and rows represent the individual genes ordered based on the hierarchical clustering of all data. (c) Narrow window of Runx1 expression in 23GFP+ HE. Data are normalized to the mean of the reference genes Hprt1 and Atp5a1 and are the mean±s.d. of a total of 4 to 6 pools of 25 cells from two independent experiments except E12.5 (one experiment with three pools of cells). E8.5 (6–13sp), E9.5 (19–26sp) and E10.5(32-38sp). (d) Kernel density plots of the single-cell data showing increasing Runx1 levels in EC, HE and HPC at E10.5.

References

    1. Dieterlen-Lievre F. Hematopoiesis: progenitors and their genetic program. Curr. Biol. 1998;8:R727–R730. - PubMed
    1. Jaffredo T, et al. From hemangioblast to hematopoietic stem cell: an endothelial connection? Exp. Hematol. 2005;33:1029–1040. - PubMed
    1. Medvinsky A, Rybtsov S, Taoudi S. Embryonic origin of the adult hematopoietic system: advances and questions. Development. 2011;138:1017–1031. - PubMed
    1. Antas VI, Al-Drees MA, Prudence AJ, Sugiyama D, Fraser ST. Hemogenic endothelium: a vessel for blood production. Int. J. Biochem. Cell Biol. 2012;45:692–695. - PubMed
    1. Eilken HM, Nishikawa S, Schroeder T. Continuous single-cell imaging of blood generation from haemogenic endothelium. Nature. 2009;457:896–900. - PubMed

Publication types

Substances

Associated data