. 2013 Dec 10:2:e01229.
doi: 10.7554/eLife.01229.

Fitness benefits in fluoroquinolone-resistant Salmonella Typhi in the absence of antimicrobial pressure

Affiliations

Fitness benefits in fluoroquinolone-resistant Salmonella Typhi in the absence of antimicrobial pressure

Stephen Baker et al. Elife. .

Abstract

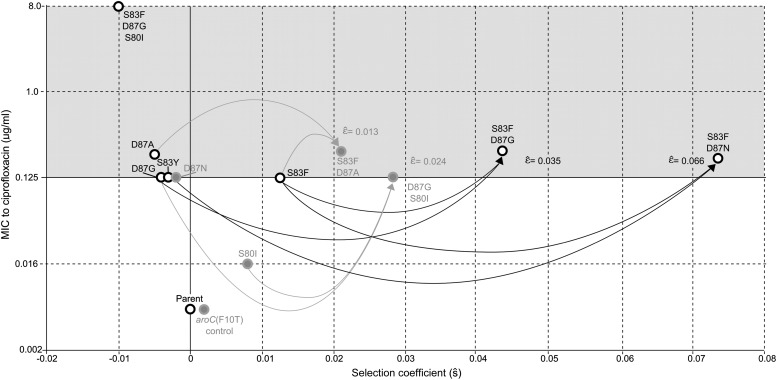
Fluoroquinolones (FQ) are the recommended antimicrobial treatment for typhoid, a severe systemic infection caused by the bacterium Salmonella enterica serovar Typhi. FQ-resistance mutations in S. Typhi have become common, hindering treatment and control efforts. Using in vitro competition experiments, we assayed the fitness of eleven isogenic S. Typhi strains with resistance mutations in the FQ target genes, gyrA and parC. In the absence of antimicrobial pressure, 6 out of 11 mutants carried a selective advantage over the antimicrobial-sensitive parent strain, indicating that FQ resistance in S. Typhi is not typically associated with fitness costs. Double-mutants exhibited higher than expected fitness as a result of synergistic epistasis, signifying that epistasis may be a critical factor in the evolution and molecular epidemiology of S. Typhi. Our findings have important implications for the management of drug-resistant S. Typhi, suggesting that FQ-resistant strains would be naturally maintained even if fluoroquinolone use were reduced. DOI: http://dx.doi.org/10.7554/eLife.01229.001.

Keywords: Salmonella; epistasis; fitness cost; fluoroquinolone; typhoid.


Conflict of interest statement

JF: Jeremy Farrar is Director of the Wellcome Trust, one of the three founding funders of eLife.

The other authors declare that no competing interests exist.

Figures

Figure 1.
Figure 1.. Comparing two methods for calculation of allele frequencies.
(A) Pyrosequencing-measured allele frequencies (y-axis) of a range of S83F/parent strain dilutions plotted against enumeration-measured frequencies (x-axis) (n = 198). A linear regression between the two variables (solid black line) explains 90% of the variation in the relationship between these two measurements. (B) The same 198 data points (y-axis) are shown plotted against the original bacterial dilution ratio (x-axis). The broken line is the diagonal highlighting where predicted frequency and measured frequency would be identical. 18 measurement replicates were performed for each predicted frequency of S83F from 0.0 to 1.0. DOI: http://dx.doi.org/10.7554/eLife.01229.004
Figure 2.
Figure 2.. Likelihood profiles for the selection coefficients from 12 competition experiments.
Data generated by competing 12 S. Typhi mutants (labeled at the top of each panel) against the parent S. Typhi strain over approximately 150 generations. Open circles correspond to likelihood values over the entirety of the experiment (primary y-axis); the filled gray circles correspond to the maximum likelihood estimates (MLE) for the variance parameter σ (secondary y-axis), describing the 24-hourly variance in both process and measurement. The MLE selection coefficient (s^) is shown in the top right of each panel. Vertical dashed lines demark the 95% confidence intervals for the MLE s^. Note the compressed x-axis scale in the bottom-right panel. DOI: http://dx.doi.org/10.7554/eLife.01229.005
Figure 3.
Figure 3.. Fitness coefficients computed from 5 and 15 days of bacterial competition.
Black boxes show fitness coefficients computed across the entire 15-day competition. White boxes show fitness coefficients computed from the first 5 days only. The ΔaroC F10T mutation is that of the control strain. Horizontal lines are 95% confidence intervals. In a situation of compensatory evolution, we would expect to see the white box to the left of the black box. DOI: http://dx.doi.org/10.7554/eLife.01229.006
Figure 4.
Figure 4.. Likelihood profiles for the epistasis coefficient (ε^) from the four double mutant competition experiments.
Open circles correspond to likelihood values; the filled gray circles correspond to the maximum likelihood estimate (MLE) for the variance parameter σ, describing the 24-hourly variance in both process and measurement. The MLE epistasis coefficient ε^ is shown in the top right of each panel. Vertical dashed lines demark the 95% confidence intervals for the MLE ε^. DOI: http://dx.doi.org/10.7554/eLife.01229.007
Figure 5.
Figure 5.. Relationships among MICs, selection coefficients and epistasis parameters of S. Typhi mutants.
Diagram depicts the interactions among MLE selection coefficients (s^) (x-axis), MICs to ciprofloxacin (y-axis), and MLE epistasis coefficients ε^. Black circles denote S. Typhi strains that have been isolated clinically, while gray circles denote S. Typhi strains that have not been isolated clinically. Lines correspond to epistatic interactions of the four double mutants, two of which have been isolated clinically (black lines and ε^ value) and two of which have not (gray lines and ε^ value). The grayed upper half of graph highlights the current MIC breakpoint indicative of resistance and increasing risk of treatment failure (>0.125 μg/ml). DOI: http://dx.doi.org/10.7554/eLife.01229.008
Figure 6.
Figure 6.. Likelihood profiles for the epistasis coefficient (ε^) of three possible epistatic interactions that could have generated the triple-mutant S83F-D87G-S80I.
The interaction types are described on the top of each panel. The left panel shows the epistatic interaction among three single mutations. The middle and right panels show the epistatic interaction between a single mutation and a double mutation (joined by a hyphen). Open circles correspond to likelihood values; the filled gray circles correspond to the maximum likelihood estimate (MLE) for the variance parameter σ, describing the 24-hourly variance in both process and measurement. The MLE epistasis coefficient ε^ is shown in the top right of each panel. Vertical dashed lines demark the 95% confidence intervals for the MLE ε^. DOI: http://dx.doi.org/10.7554/eLife.01229.009

Comment in

References

    1. Andersson DI. 2003. Persistence of antibiotic resistant bacteria. Curr Opin Microbiol 6:452–6. 10.1016/j.mib.2003.09.001 - DOI - PubMed
    1. Andersson DI, Hughes D. 2010. Antibiotic resistance and its cost: is it possible to reverse resistance? Nat Rev Microbiol 8:260–71. 10.1038/nrmicro2319 - DOI - PubMed
    1. Andersson DI, Levin BR. 1999. The biological cost of antibiotic resistance. Curr Opin Microbiol 2:489–93. 10.1016/S1369-5274(99)00005-3 - DOI - PubMed
    1. Anzaldi LL, Skaar EP. 2011. The evolution of a superbug: how Staphylococcus aureus overcomes its unique susceptibility to polyamines. Mol Microbiol 82:1–3. 10.1111/j.1365-2958.2011.07808.x - DOI - PubMed
    1. Balsalobre L, de la Campa AG. 2008. Fitness of Streptococcus pneumoniae fluoroquinolone-resistant strains with topoisomerase IV recombinant genes. Antimicrob Agents Chemother 52:822–30. 10.1128/AAC.00731-07 - DOI - PMC - PubMed

Publication types

MeSH terms