. 2013 Sep 4;2(4):376-92.
doi: 10.1016/j.molmet.2013.08.006. eCollection 2013.

Seven transmembrane G protein-coupled receptor repertoire of gastric ghrelin cells

Affiliations

Seven transmembrane G protein-coupled receptor repertoire of gastric ghrelin cells

Maja S Engelstoft et al. Mol Metab. .

Abstract

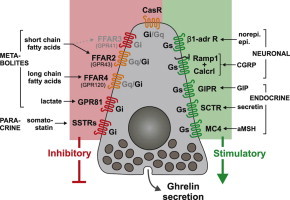
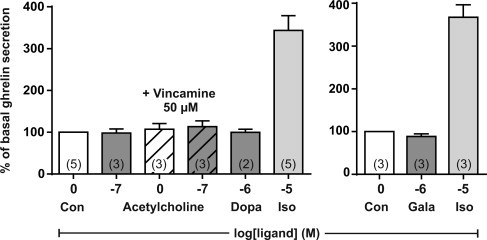
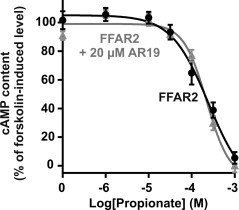
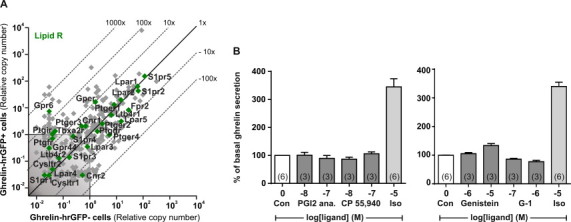
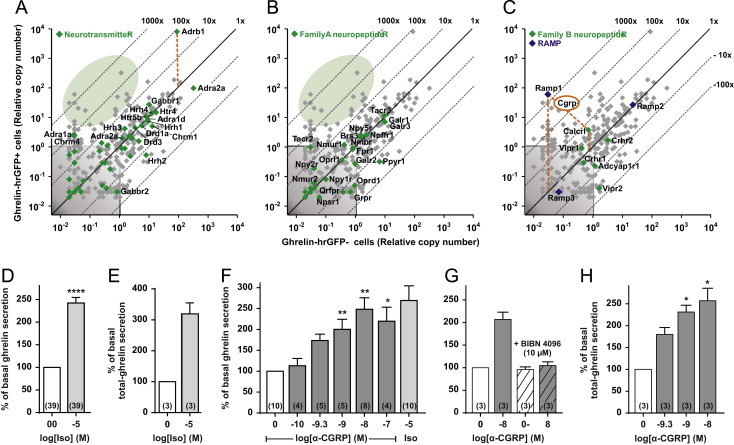
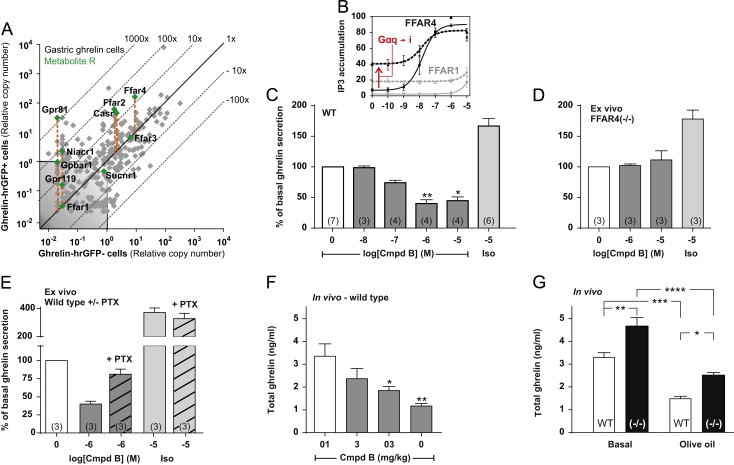
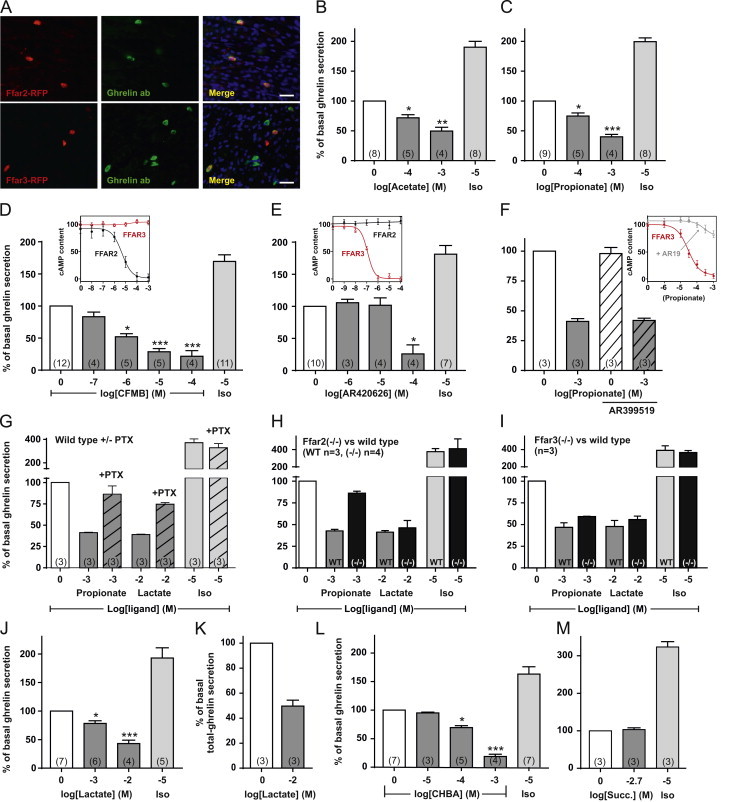
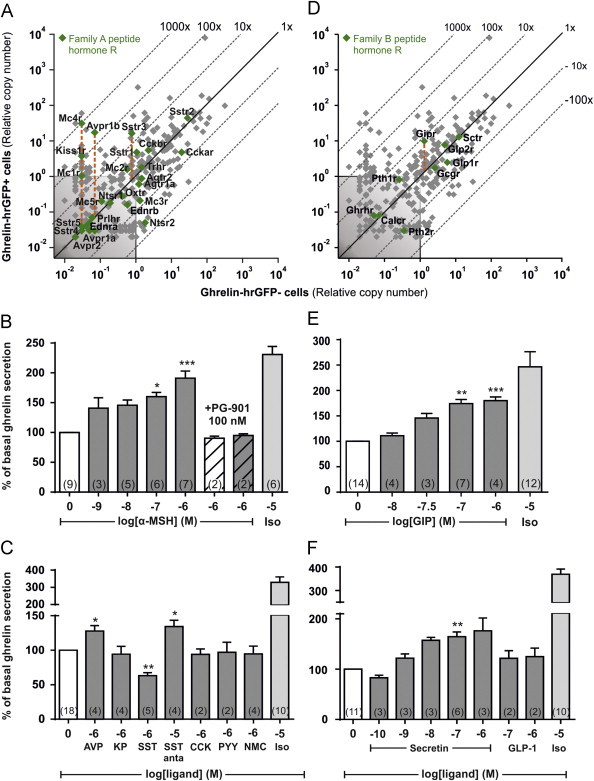
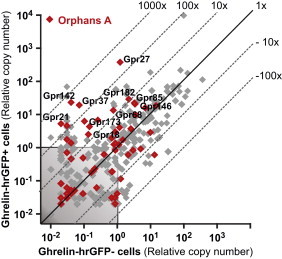
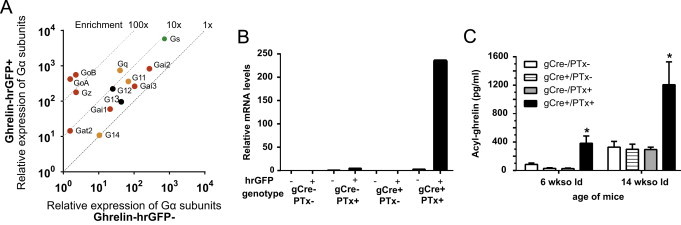
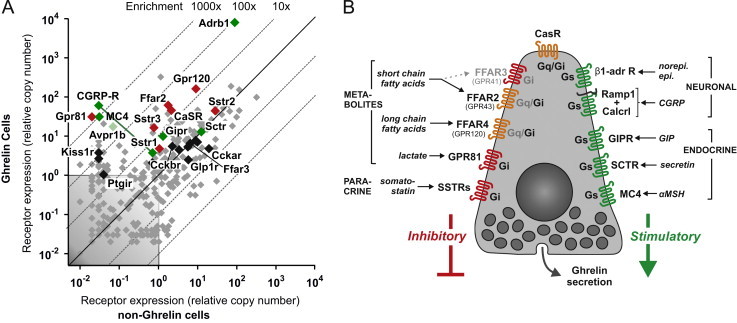
The molecular mechanisms regulating secretion of the orexigenic-glucoregulatory hormone ghrelin remain unclear. Based on qPCR analysis of FACS-purified gastric ghrelin cells, highly expressed and enriched 7TM receptors were comprehensively identified and functionally characterized using in vitro, ex vivo and in vivo methods. Five Gαs-coupled receptors efficiently stimulated ghrelin secretion: as expected the β1-adrenergic, the GIP and the secretin receptors but surprisingly also the composite receptor for the sensory neuropeptide CGRP and the melanocortin 4 receptor. A number of Gαi/o-coupled receptors inhibited ghrelin secretion including somatostatin receptors SSTR1, SSTR2 and SSTR3 and unexpectedly the highly enriched lactate receptor, GPR81. Three other metabolite receptors known to be both Gαi/o- and Gαq/11-coupled all inhibited ghrelin secretion through a pertussis toxin-sensitive Gαi/o pathway: FFAR2 (short chain fatty acid receptor; GPR43), FFAR4 (long chain fatty acid receptor; GPR120) and CasR (calcium sensing receptor). In addition to the common Gα subunits three non-common Gαi/o subunits were highly enriched in ghrelin cells: GαoA, GαoB and Gαz. Inhibition of Gαi/o signaling via ghrelin cell-selective pertussis toxin expression markedly enhanced circulating ghrelin. These 7TM receptors and associated Gα subunits constitute a major part of the molecular machinery directly mediating neuronal and endocrine stimulation versus metabolite and somatostatin inhibition of ghrelin secretion including a series of novel receptor targets not previously identified on the ghrelin cell.

Keywords: 7TM, seven transmembrane segment; BAC, bacterial artificial chromosome; CCK, cholecystokinin; CFMB, (S)-2-(4-chlorophenyl)-3,3-dimethyl-N-(5-phenylthiazol-2-yl)butamide; CGRP, calcitonin gene-related peptide; CHBA, 3-chloro-5-hydroxybenzoic acid; Enteroendocrine; G protein signaling; GIP, glucose-dependent insulinotropic polypeptide; GLP-1, glucagon-like peptide 1; GPCR; Ghrelin; Metabolites; PTx, Bordetella pertussis toxin; PYY, peptide YY; Secretion; hrGFP, humanized Renilla reniformis green fluorescent protein.


Figures

None
Graphical abstract
Figure S1
Figure S1
Ex vivo ghrelin secretion. Acyl-ghrelin release from primary gastric mucosal cells treated with acetylcholine, the M4 allosteric agonist vincamine, acetylcholine and vincamine (gray, hatched), dopamine, galanin or isoproterenol. The data has been normalized to the basal secretion of ghrelin from vehicle-treated cells and shown as means±SEM. Number of repeated experiments is written in brackets in each bar.
Figure S2
Figure S2
Propionate-induced cAMP accumulation. cAMP accumulation assays in HEK293 cells stably transfected with FFAR2 and treated with increasing concentrations of propionate alone (black) or after addition of 20 µM AR19 (gray).
Figure S3
Figure S3
Expression and functional analysis of lipid 7TM receptors in ghrelin cells. (A) qPCR data for 379 7TM receptors examined in FACS-separated hrGFP-positive (Y-axis) and hrGFP-negative (X-axis) gastric mucosal cells from ghrelin-hrGFP mice. Lipid receptors are marked with green. (B) Acyl-ghrelin release from primary gastric mucosal cells treated with a stable prostaglandin I2 analog (PGI2, beraprost), a CB1 agonist (CP 55,940), the GPER agonists genistein and G-1 or isoproterenol. The data has been normalized to the basal secretion of ghrelin from vehicle-treated cells and shown as means±SEM. Number of repeated experiments is written in brackets in each bar.
Figure S4
Figure S4
Ghrelin-immunoreactivity and tdTomato fluorescence. Ghrelin-immunoreactivity (green) and tdTomato fluorescence (red) within gastric mucosal cells. Co-localization (yellow) is visualized in the merged picture (right).
Figure 1
Figure 1
Expression and functional analysis of 7TM receptors for neurotransmitters and neuropeptides in gastric ghrelin cells. (A–C) qPCR expression data for 379 7TM receptors (gray plus green dots) and three RAMPs (blue dots, C) examined in FACS-separated hrGFP-positive (Y-axis) and hrGFP-negative (X-axis) gastric mucosal cells. (A) Receptors for neurotransmitters, (B) family A neuropeptide receptors, and (C) family B neuropeptide receptors are highlighted with green dots and the receptor gene name indicated for all neuropeptide receptors but only for the enriched and/or highly expressed small molecule neurotransmitter receptors for clarity. The 45°-angled lines refer to the enrichment within ghrelin cells. The gray shaded area is considered as noise level. The orange dashed lines highlight particularly enriched receptors. The expression data for all the receptors and RAMPs are listed in Table S3. The green shaded areas highlight the lack of enriched neurotransmitter (A) and neuropeptide (B) receptors, respectively (i.e. only gray and no green dots in the shaded green areas). (D and E) Acyl-ghrelin/total ghrelin release from primary gastric mucosal cells treated with isoproterenol, (F and H) increasing concentrations of α-CGRP or isoproterenol, (G) or with BIBN 4096 alone (hatched) and before 10 nM of α-CGRP (gray, hatched). The data is normalized to basal secretion of ghrelin from vehicle-treated cells and shown as means±SEM. Number of repeated experiments is indicated in brackets in each bar.
Figure 2
Figure 2
Expression of 7TM receptors for metabolites in gastric ghrelin cells and functional analysis of FFAR4 in ghrelin secretion in vitro, ex vivo and in vivo. (A) qPCR data for 379 7TM receptors examined in FACS-separated hrGFP-positive (Y-axis) and hrGFP-negative (X-axis) gastric mucosal cells. Receptors for nutrients and dietary metabolites are highlighted with green dots. (B) Inositol triphosphate accumulation in COS7 cells transiently transfected with either FFAR4 (black, solid), FFAR1 (gray, solid), FFAR4 together with Gα∆6qi4myr (black, dotted) or FFAR1 together with Gα∆6qi4myr (gray, dotted) and treated with increasing concentrations of the FFAR4 specific agonist compound B normalized to the maximum compound B-induced FFAR4 activation. (C) Acyl-ghrelin release from primary gastric mucosal cells from wild type or (D) FFAR4 deficient mice treated with increasing concentrations of compound B or 10 µM isoproterenol normalized to the basal secretion of ghrelin from vehicle-treated cells and shown as means±SEM. Number of repeated experiments is indicated in brackets in each bar. (E) Acyl-ghrelin release from primary gastric mucosal cells treated with 1 µM of compound B or 10 µM of isoproterenol alone, or after addition of pertussis toxin (PTx, hatched) normalized to the basal secretion of ghrelin from vehicle-treated cells with and without PTx treatment, respectively (the PTx treatment did not affect ghrelin secretion from vehicle-treated cells (−PTx: 648±86 pg/ml, +PTx: 607±66 pg/ml)), and shown as means±SEM. Number of repeated experiments is indicated in brackets in each bar. (F) Total-ghrelin concentrations in plasma from mice orally dosed with increasing concentrations of compound B after an overnight fast. (G) Total-ghrelin concentrations in plasma from wild type mice (white) or FFAR4 deficient mice (black) after an overnight fast (basal) and two hours after an oral triglyceride load (120 min).
Figure 3
Figure 3
Functional analysis of FFAR2, FFAR3 and GPR81 in ghrelin secretion ex vivo. (A) Immunohistochemistry with antibodies against mRFP (red) and ghrelin (green) on gastric tissue from mice expressing mRFP from either the FFAR2 promoter (top) or the FFAR3 promoter (bottom) (see text for details). The scale bars in the merged pictures correspond to 25 µm. (B) Acyl-ghrelin release from primary gastric mucosal cells treated with various concentrations of acetate, (C) propionate, (D) CFMB, (E) AR420626, (F) propionate alone and after addition of 20 µM AR19 (hatched), (J) lactate, (L) CHBA, (M) succinate or 10 µM isoproterenol normalized to the basal secretion of ghrelin from vehicle-treated cells and shown as means±SEM. Number of repeated experiments is written in brackets in each bar. (D, E, and F inserts) cAMP accumulation in HEK293 cells stably transfected with either FFAR2 (black) or FFAR3 (red) and treated with increasing concentrations of CMFB, AR420626, or propionate alone or after addition of 20 µM AR19 (gray). FFAR2-transfected cells treated with propionate and AR19 are shown in Figure S4. (H) Acyl-ghrelin release from primary gastric mucosal from wild type mice (gray), FFAR2 deficient mice (black), or (I) FFAR3 deficient mice (black) treated with 1 mM propionate, 10 mM lactate or 10 µM isoproterenol normalized to the basal secretion of ghrelin from vehicle-treated cells from wild type or knockout mice, respectively, and shown as means±SEM. (G) Acyl-ghrelin release from primary gastric mucosal cells treated with 1 mM propionate, 10 mM lactate or 10 µM isoproterenol alone or after addition of PTx (hatched) normalized to the basal secretion of ghrelin from vehicle-treated cells with and without PTx treatment, respectively (PTx did not affect basal ghrelin secretion – see legend of Figure 2), and shown as means±SEM. Number of repeated experiments is written in brackets in each bar. (K) Total-ghrelin release from primary gastric mucosal cells treated with 10 mM lactate and normalized to the basal secretion of total-ghrelin from vehicle-treated cells.
Figure 4
Figure 4
Functional analysis of CaSR in ghrelin secretion ex vivo. (A) Acyl-ghrelin release from primary gastric mucosal cells treated with various concentrations of R-568, (B) CaCl2, 10 µM isoproterenol, or (C) R-568 alone, 4 mM CaCl2 alone or R-568 together with 4 mM CaCl2 (gray, hatched). The data has been normalized to the basal secretion of ghrelin from vehicle-treated cells and shown as means±SEM. Number of repeated experiments is written in brackets in each bar.
Figure 5
Figure 5
Expression and functional analysis of 7TM receptors for peptide hormones in gastric ghrelin cells. (A and D) qPCR data for 379 7TM receptors examined in FACS-separated hrGFP-positive (Y-axis) and hrGFP-negative (X-axis) gastric mucosal cells. Family A receptors for peptide hormones and (D) family B receptors for peptide hormones have been marked with green. (B) Acyl-ghrelin release from primary gastric mucosal cells treated with increasing concentrations of α-MSH, 100 nM PG-901 alone (hatched) or before 1 µM α-MSH, (C) 1 µM vasopressin (AVP), kisspeptin (KP), somatostatin (Sst), 10 µM of the somatostatin antagonist BIM-23627, 1 µM CCK8, PYY3-36, neuromedin C (NMC) (significance tested with Mann–Whitney), (E) increasing concentrations of GIP, (F) secretin, GLP-1 or 10 µM isoproterenol. The data has been normalized to the basal secretion of ghrelin from vehicle-treated cells and shown as means±SEM. Number of repeated experiments is written in brackets in each bar.
Figure 6
Figure 6
Expression of orphan family A 7TM receptors in ghrelin cells. qPCR data for 379 7TM receptors examined in FACS-separated hrGFP-positive (Y-axis) and hrGFP-negative (X-axis) gastric mucosal cells. Orphan receptors from family A are marked with red. Receptors labeled with names are stably expressed and more than fivefold enriched in ghrelin cells.
Figure 7
Figure 7
Expression of Gα subunits and pertussis toxin in ghrelin cells. (A) Relative mRNA expression of 13 Gα subunits examined in FACS-separated hrGFP-positive (Y-axis) and hrGFP-negative (X-axis) gastric mucosal cells. Cyclophilin was used as a reference gene. Gα subunits with a mean CT value above 35 in either of the cell pools have been left out, but can be seen in Table S4. (B) Relative mRNA expression of the PTx catalytic S1 subunit within ghrelin cells (hrGFP+) and non-ghrelin cells (hrGFP−) in the four different genotypes (gCre−/PTx−, gCre+/PTx−, gCre−/PTx+, and gCre+/PTx+). (C) Levels of plasma acyl-ghrelin in 6-wk-old and 14-wk-old ad lib-fed male in the four different genotypes (gCre−/PTx−, gCre+/PTx−, gCre−/PTx+, and gCre+/PTx+). The data is shown as means±SEM.
Figure 8
Figure 8
Overview of 7TM receptors involved in the control of ghrelin secretion directly at the ghrelin cell level. (A) Overview of expression of 7TM receptors involved in control of hormone secretion in FACS-separated ghrelin-hrGFP positive cells (Y-axis) versus expression in ghelin-hrGFP negative cells (X-axis) isolated from gastric mucosa (see Figure 1 and text for details). Receptors stimulating ghrelin secretion are marked in green, receptors inhibiting ghrelin release are marked in red, receptors functionally tested without effect on ghrelin secretion are marked in black and receptors not tested functionally are marked in gray. (B) Schematic overview of the 7TM receptors judged to be either stimulating (in green to the right) or inhibiting (red or orange to the left and top) ghrelin secretion directly on the ghrelin cell. The main signaling pathway (Gαs or Gαi) employed by each of the receptors in the ghrelin cell is indicated inside the receptor in black. No Gαq-coupled receptor effectively stimulating ghrelin secretion was identified but some receptors are known to be able to signal through Gαq and stimulate secretion in other cell systems (indicated in orange). Main endogenous ligands are indicated for each receptor.

References

    1. Kojima M., Hosoda H., Date Y., Nakazato M., Matsuo H., Kangawa K. Ghrelin is a growth-hormone-releasing acylated peptide from stomach. Nature. 1999;402(6762):656–660. - PubMed
    1. Kumar J., Chuang J.C., Na E.S., Kuperman A., Gillman A.G., Mukherjee S. Differential effects of chronic social stress and fluoxetine on meal patterns in mice. Appetite. 2013;64:81–88. - PMC - PubMed
    1. Verhulst P.J., Depoortere I. Ghrelin's second life: from appetite stimulator to glucose regulator. World Journal of Gastroenterology. 2012;18(25):3183–3195. - PMC - PubMed
    1. Kirchner H., Heppner K.M., Tschop M.H. The role of ghrelin in the control of energy balance. Handbook of Experimental Pharmacology. 2012;209:161–184. - PubMed
    1. Tschop M., Smiley D.L., Heiman M.L. Ghrelin induces adiposity in rodents. Nature. 2000;407(6806):908–913. - PubMed