. 2014 Mar 1;458(2):365-74.
doi: 10.1042/BJ20131405.

The inhibition of functional expression of calcium channels by prion protein demonstrates competition with α2δ for GPI-anchoring pathways

Affiliations

The inhibition of functional expression of calcium channels by prion protein demonstrates competition with α2δ for GPI-anchoring pathways

Anita Alvarez-Laviada et al. Biochem J. .

Abstract

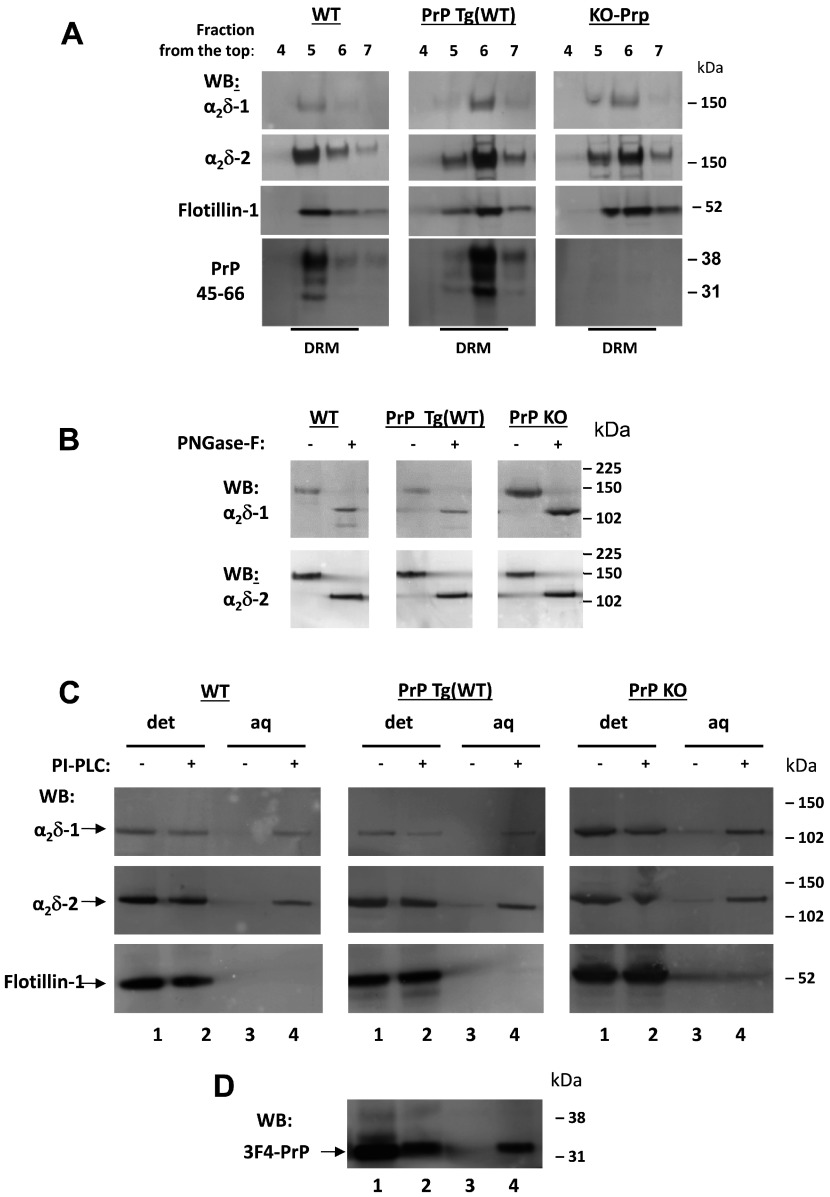
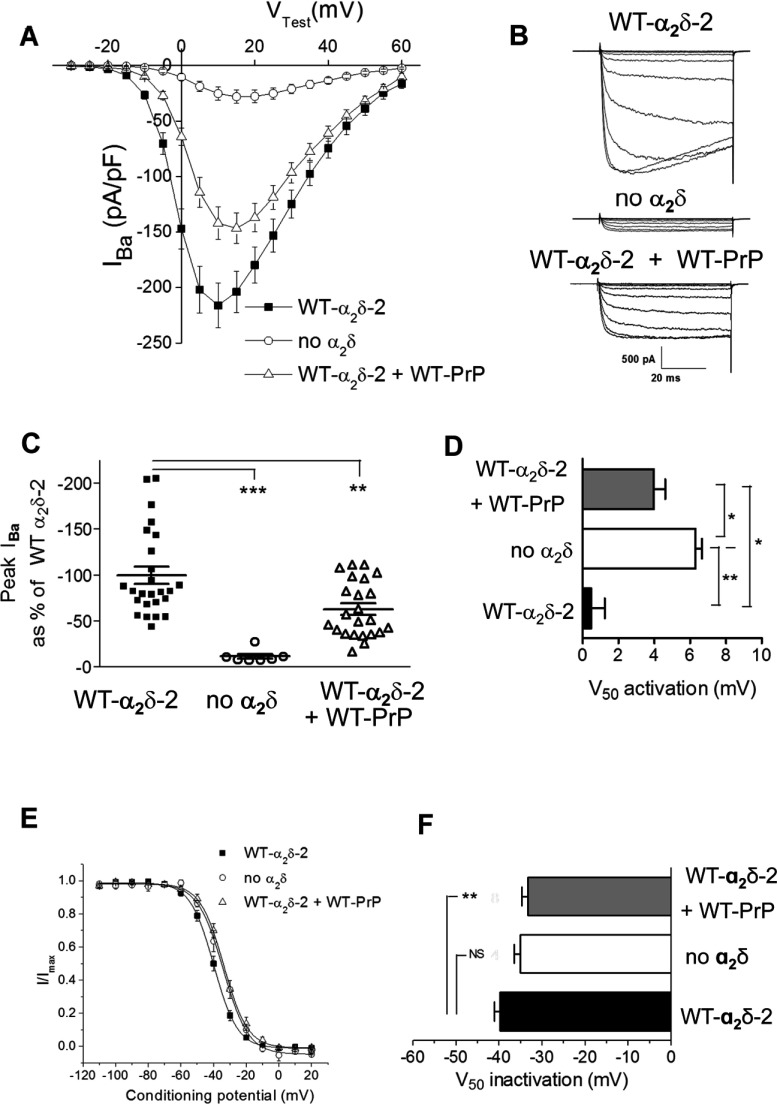
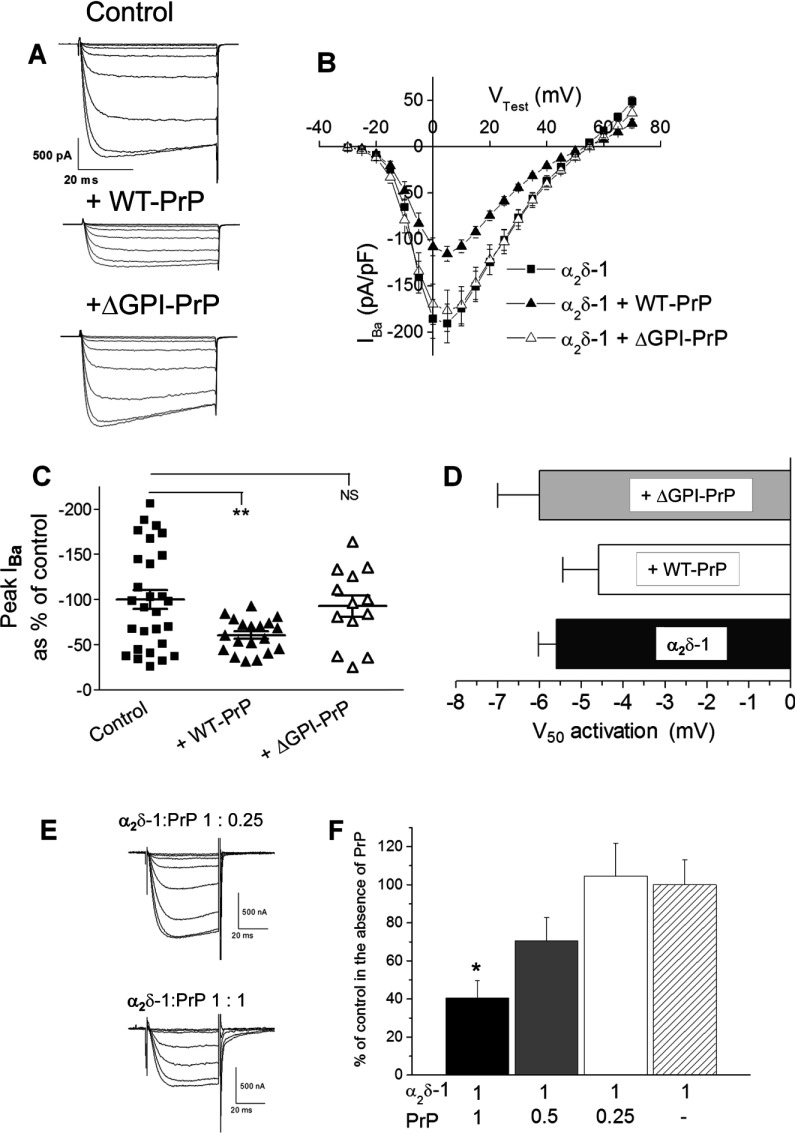
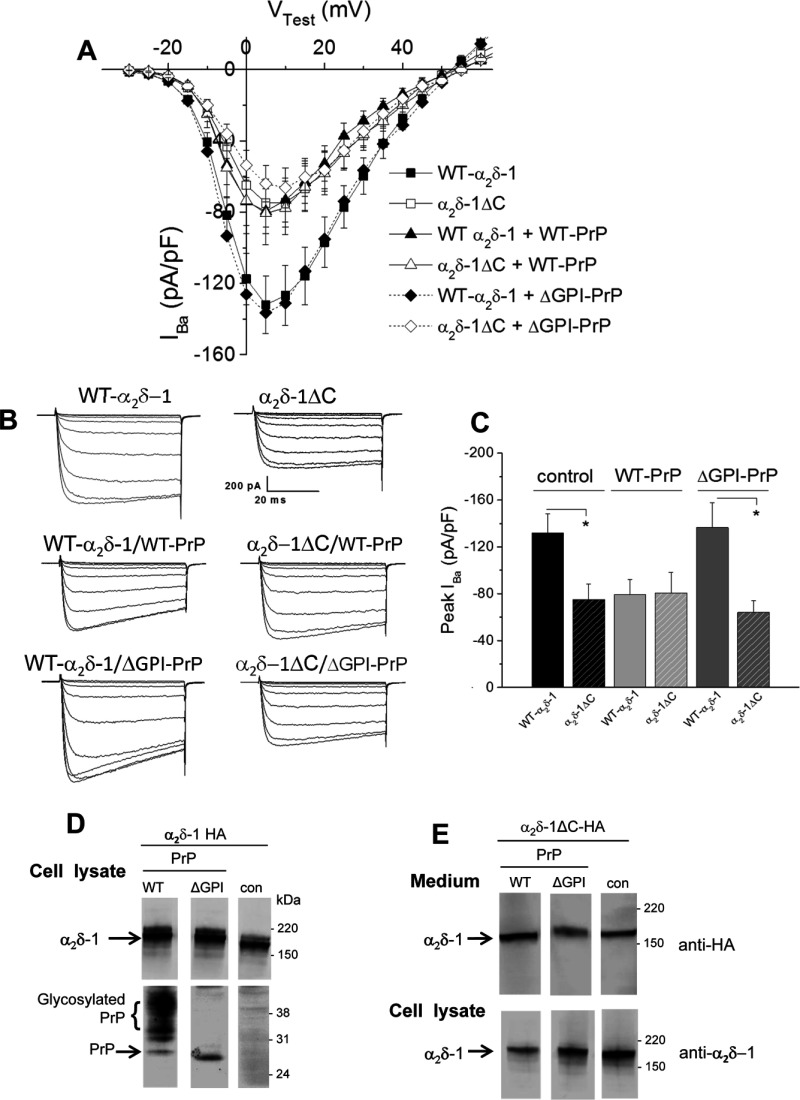
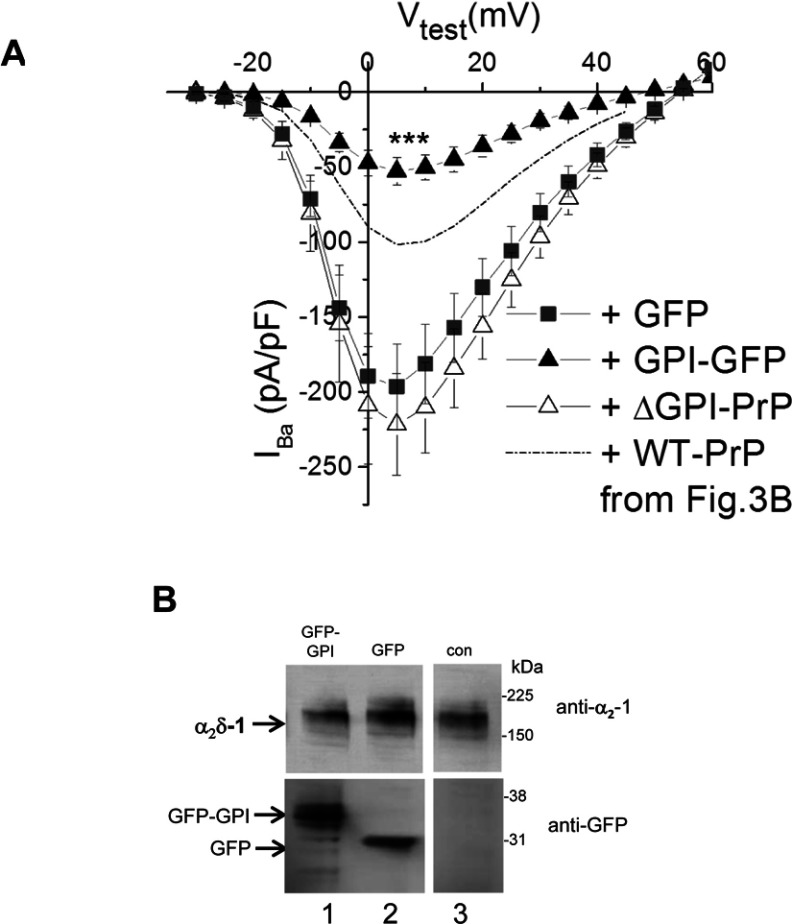
It has been shown recently that PrP (prion protein) and the calcium channel auxiliary α2δ subunits interact in neurons and expression systems [Senatore, Colleoni, Verderio, Restelli, Morini, Condliffe, Bertani, Mantovani, Canovi, Micotti, Forloni, Dolphin, Matteoli, Gobbi and Chiesa (2012) Neuron 74, 300-313]. In the present study we examined whether there was an effect of PrP on calcium currents. We have shown that when PrP is co-expressed with calcium channels formed from CaV2.1/β and α2δ-1 or α2δ-2, there is a consistent decrease in calcium current density. This reduction was absent when a PrP construct was used lacking its GPI (glycosylphosphatidylinositol) anchor. We have reported previously that α2δ subunits are able to form GPI-anchored proteins [Davies, Kadurin, Alvarez-Laviada, Douglas, Nieto-Rostro, Bauer, Pratt and Dolphin (2010) Proc. Natl. Acad. Sci. U.S.A. 107, 1654-1659] and show further evidence in the present paper. We have characterized recently a C-terminally truncated α2δ-1 construct, α2δ-1ΔC, and found that, despite loss of its membrane anchor, it still shows a partial ability to increase calcium currents [Kadurin, Alvarez-Laviada, Ng, Walker-Gray, D'Arco, Fadel, Pratt and Dolphin (2012) J. Biol. Chem. 1287, 33554-33566]. We now find that PrP does not inhibit CaV2.1/β currents formed with α2δ-1ΔC, rather than α2δ-1. It is possible that PrP and α2δ-1 compete for GPI-anchor intermediates or trafficking pathways, or that interaction between PrP and α2δ-1 requires association in cholesterol-rich membrane microdomains. Our additional finding that CaV2.1/β1b/α2δ-1 currents were inhibited by GPI-GFP, but not cytosolic GFP, indicates that competition for limited GPI-anchor intermediates or trafficking pathways may be involved in PrP suppression of α2δ subunit function.


Figures

Figure 1
Figure 1. PI-PLC treatment and phase separation of α2δ-1, α2δ-2 and PrP in mouse cerebella
(A) DRM fractions from WT (left-hand panel), PrP Tg(WT) (middle panel) and PrP KO (right-hand panel) mouse cerebella were prepared as described in the Materials and methods section. Aliquots were resolved on 3–8% Tris/acetate (to resolve α2δs) or 4–12% Bis-Tris gels (to resolve PrP in the same samples), and analysed by Western blotting (WB) with relevant antibodies as indicated. The full profile is not shown, but only the fractions of the sucrose gradient corresponding to DRMs identified by the presence of flotillin-1 (fractions 4–7 harvested from the top). The anti-α2δ-1 and anti-α2δ-2 antibodies recognize the α2-1 and α2-2 moieties. (B) Aliquots of concentrated DRM fractions from WT (left-hand panel), PrP Tg(WT) (middle panel) and PrP KO (right-hand panel) cerebella were treated with PNGase F and analysed by Western blotting with the indicated antibodies. (C) DRM fractions analysed in (A) were subjected to PI-PLC treatment and Triton X-114 phase separation (see the Materials and methods section), followed by PNGase F deglycosylation. The proteins remaining in the aqueous (aq) and detergent (det) phase were then resolved on 4–12% Bis-Tris gels and analysed with the indicated antibodies. Lanes 1 and 2 in each panel are from detergent phase fractions, whereas lanes 3 and 4 are from the respective aqueous phase, treated or not with PI-PLC as indicated. (D) The PrP Tg(WT) fractions from (C, middle panel) were also blotted for PrP using the 3F4 antibody. Molecular mass is shown on the right-hand side of the gels in kDa.
Figure 2
Figure 2. Effect of PrP on CaV2.1/β4/α2δ-2 calcium channel currents
(A) Current–voltage (IV) relationships for IBa recorded from tsA-201 cells expressing CaV2.1/β4/α2δ-2 (■; n=25), CaV2.1/β4 alone (○; n=7) and CaV2.1/β4/α2δ-2/WT PrP (△; n=23). The ratio of cDNAs used for transfection for CaV2.1/β4/α2δ-2/WT-PrP was 3:2:2:1, with empty vector used where α2δ or PrP was absent. (B) Examples of families of IBa current traces resulting from step potentials from −100 mV to between −30 and +15 mV in 5 mV increments for CaV2.1/β4/α2δ-2 (top panel), CaV2.1/β4 alone (middle panel) and CaV2.1/β4/α2δ-2/WT PrP (bottom panel). (C) Individual peak IBa currents at +10 mV, expressed as the mean±S.E.M. percentage of the control condition with WT α2δ-2 and CaV2.1/β4/α2δ-2 (■; n=25), CaV2.1/β4 alone (○; n=7) and CaV2.1/β4/α2δ-2/WT PrP (△; n=23). **P<0.01 and ***P<0.001. (D) Voltage-dependence of activation (V50 activation) determined by fitting a modified Boltzmann function to the individual IV relationships shown in (A) for CaV2.1/β4/α2δ-2 (black bar), CaV2.1/β4 alone (white bar) and CaV2.1/β4/α2δ-2/WT PrP (grey bar). *P<0.05 and **P<0.01. (E) Steady-state inactivation curves for IBa recorded from cells expressing CaV2.1/β4/α2δ-2 (■; n=12), CaV2.1/β4 alone (○; n=4) and CaV2.1/β4/α2δ-2/WT PrP (△; n=8). (F) Voltage-dependence of steady-state inactivation (V50 inactivation) determined by fitting a Boltzmann function to the individual steady-state inactivation relationships for the data shown in (E); CaV2.1/β4/α2δ-2 (black bar), CaV2.1/β4 alone (white bar) and CaV2.1/β4/α2δ-2/WT PrP (grey bar). **P<0.01; NS, not significant. All statistical differences were determined by one-way ANOVA and Dunnett's multiple comparison test.
Figure 3
Figure 3. Effect of PrP constructs on CaV2.1/β1b/α2δ-1 calcium channel currents
(A) Examples of families of IBa current traces resulting from step potentials from −90 mV to between −30 and +10 mV in 5 mV steps for CaV2.1/β1b/α2δ-1 alone (top panel) with WT PrP (middle panel) or with ΔGPI–PrP (bottom panel). The ratio of cDNAs used for the transfection of CaV2.1/β1b/α2δ-1/PrP was 3:2:2:1, with empty vector used where α2δ or PrP was absent. (B) IV relationships for IBa recorded from tsA-201 cells expressing CaV2.1/β1b/α2δ-1 alone (■; n=28) with WT PrP (▲; n=19) or with ΔGPI–PrP (△; n=13). (C) Individual mean±S.E.M. peak IBa currents at +5 mV for CaV2.1/β1b/α2δ-1 alone (■; n=28) with WT PrP (▲; n=19) or ΔGPI–PrP (△; n=13). **P<0.01. (D) V50 activation for CaV2.1/β1b/α2δ-1 alone (black bar) with WT PrP (white bar) or with ΔGPI–PrP (grey bar). All statistical differences were determined by one-way ANOVA and Dunnett's multiple comparison test. (E and F) CaV2.2/β1b/α2δ-1 was expressed in Xenopus oocytes either alone or together with PrP at the ratios shown. (E) Representative current traces elicited by steps to test potentials between −25 and +10 mV in 5 mV steps from a holding potential of −100 mV for CaV2.2/β1b/α2δ-1/PrP (1:0.25; upper panel) or CaV2.2/β1b/α2δ-1/PrP (1:1; lower panel). The residual voltage clamp transients have been truncated. (F) Peak currents measured at +10 mV for three α2δ-1/PrP ratios plotted as the mean±S.E.M. percentage of the mean control IBa recorded in the absence of PrP in the same experiment. α2δ-1/PrP 1:1 (black bar; n=6), α2δ-1/PrP ratio 1:0.5 (grey bar; n=18), α2δ-1/PrP ratio 1:0.25 (white bar; n=20) and mean normalized control for α2δ-1 in the absence of PrP (hatched bar; n=21). *P=0.016 between the individual conditions and their respective control condition performed in the same experiment as determined by Student's t test.
Figure 4
Figure 4. Comparison of the effect of PrP constructs on calcium channel currents containing α2δ-1 or anchorless α2δ-1
(A) I--V relationships for IBa recorded from tsA-201 cells expressing CaV2.1/β1b/α2δ-1 alone (■; n=16) with WT PrP (▲; n=10) or ΔGPI–PrP (◆; n=14) or cells expressing CaV2.1/β1b/α2δ-1ΔC alone (□; n=11) with WT PrP (∆; n=13) or ΔGPI–PrP (◇; n=15). The ratio of cDNAs was the same as in Figure 3(A). (B) Examples of families of IBa current traces resulting from step potentials from −90 mV to between −30 and +10 mV in 5 mV steps for CaV2.1/β1b/α2δ-1 alone (top left-hand panel) or α2δ-1ΔC alone (top right-hand panel) with WT PrP (middle panel) or ΔGPI–PrP (bottom panels). (C) Peak IBa currents (means±S.E.M.) for the data shown in (A) for CaV2.1/β1b with α2δ-1 (solid bars) or with α2δ-1ΔC (hatched bars) either alone (black bars) or with WT PrP (light grey bars), or ΔGPI-PrP (dark grey bars). *P<0.05 as determined by one-way ANOVA and Bonferroni's post-hoc test. (D) Western blot of α2δ-1 (upper panels; 4–12% Bis-Tris gel) co-expressed (1:1) with WT PrP (left-hand lane), ∆GPI–PrP (middle lane) or empty vector (right-hand lane; con). PrP expression is shown in the lower panel (4–12% Bis-Tris gel). The lower expression of ∆GPI–PrP in the cell lysate is because much of it is secreted [53]. (E) Western blot of α2δ-1∆C in medium (upper panels; 3–8% Tris/acetate gel) and cell lysate (lower panels; 4–12% Bis-Tris gel) co-expressed (1:1) with PrP (left-hand panels), ∆GPI–PrP (middle panel) or empty vector (right-hand panels; con). In both (D) and (E), all three lanes are from the same blots from which irrelevant lanes have been excised and the molecular mass is given on the right-hand side in kDa.
Figure 5
Figure 5. Effect of GPI–GFP on CaV2.1/β1b/α2δ-1 calcium channel currents
(A) IV relationships for IBa recorded from tsA-201 cells expressing CaV2.1/β1b/α2δ-1 with GFP (■; n=9), GPI–GFP (▲; n=9), or GFP and ΔGPI–PrP (△; n=6). The broken line indicates the level of IBa observed for CaV2.1/β1b/α2δ-1 plus WT PrP from Figure 3(B). ***P<0.001 between the peak IBa when GPI–GFP was co-expressed compared with when GFP was co-expressed (Student's t test). (B) Western blot of α2δ-1 (upper panels) co-expressed (1:1) with GFP–GPI (lane 1), GFP (lane 2) or empty vector (lane 3; con). GFP expression is shown in the lower panel. All three lanes are from the same blots from which irrelevant lanes have been excised and the molecular mass is given on the right-hand side in kDa.

References

    1. Davies A., Hendrich J., Van Minh A. T., Wratten J., Douglas L., Dolphin A. C. Functional biology of the α2δ subunits of voltage-gated calcium channels. Trends Pharmacol. Sci. 2007;28:220–228. - PubMed
    1. Walker D., De Waard M. Subunit interaction sites in voltage-dependent Ca2+ channels. Trends Neurosci. 1998;21:148–154. - PubMed
    1. Dolphin A. C. β Subunits of voltage-gated calcium channels. J. Bioeng. Biomemb. 2003;35:599–620. - PubMed
    1. Pragnell M., De Waard M., Mori Y., Tanabe T., Snutch T. P., Campbell K. P. Calcium channel β-subunit binds to a conserved motif in the I–II cytoplasmic linker of the α1-subunit. Nature. 1994;368:67–70. - PubMed
    1. Leroy J., Richards M. S., Butcher A. J., Nieto-Rostro M., Pratt W. S., Davies A., Dolphin A. C. Interaction via a key tryptophan in the I–II linker of N-type calcium channels is required for beta1 but not for palmitoylated β2, implicating an additional binding site in the regulation of channel voltage-dependent properties. J. Neurosci. 2005;25:6984–6996. - PMC - PubMed

Publication types