. 2015 Apr;35(4):1464-77.
doi: 10.1111/liv.12438. Epub 2014 Jan 12.

Cardiomyopathy reverses with recovery of liver injury, cholestasis and cholanemia in mouse model of biliary fibrosis

Affiliations

Cardiomyopathy reverses with recovery of liver injury, cholestasis and cholanemia in mouse model of biliary fibrosis

Moreshwar S Desai et al. Liver Int. 2015 Apr.

Abstract

Background: Triggers and exacerbants of cirrhotic cardiomyopathy (CC) are poorly understood, limiting treatment options in patients with chronic liver diseases. Liver transplantation alone reverses some features of CC, but the physiology behind this effect has never been studied.

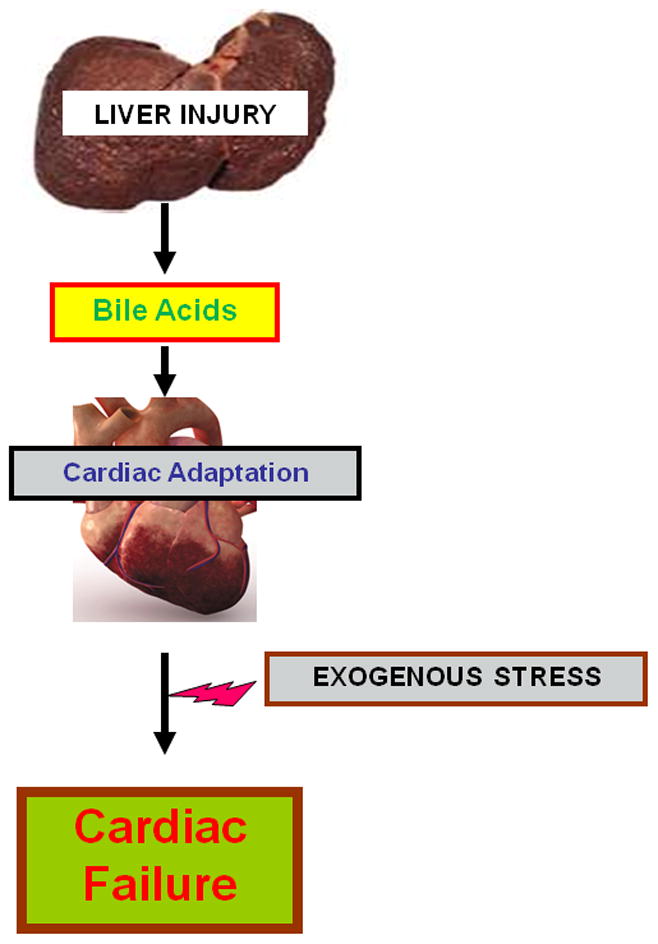
Aims: We aimed to determine whether reversal of liver injury and fibrosis in mouse affects cardiac parameters. The second aim was to determine whether cardiomyopathy can be induced by specifically increasing systemic bile acid (BA) levels.

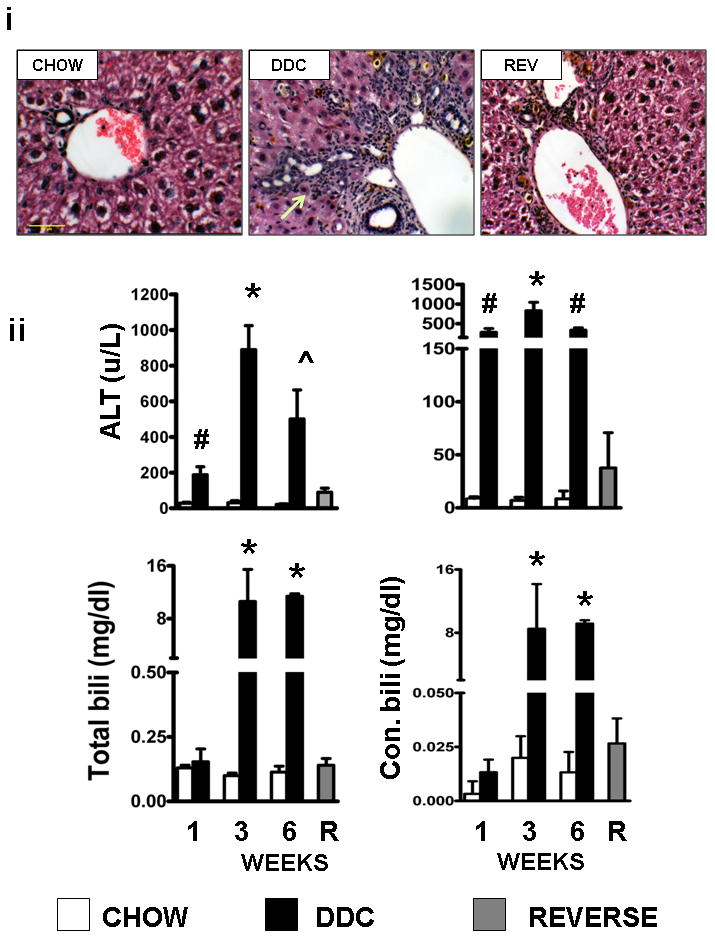
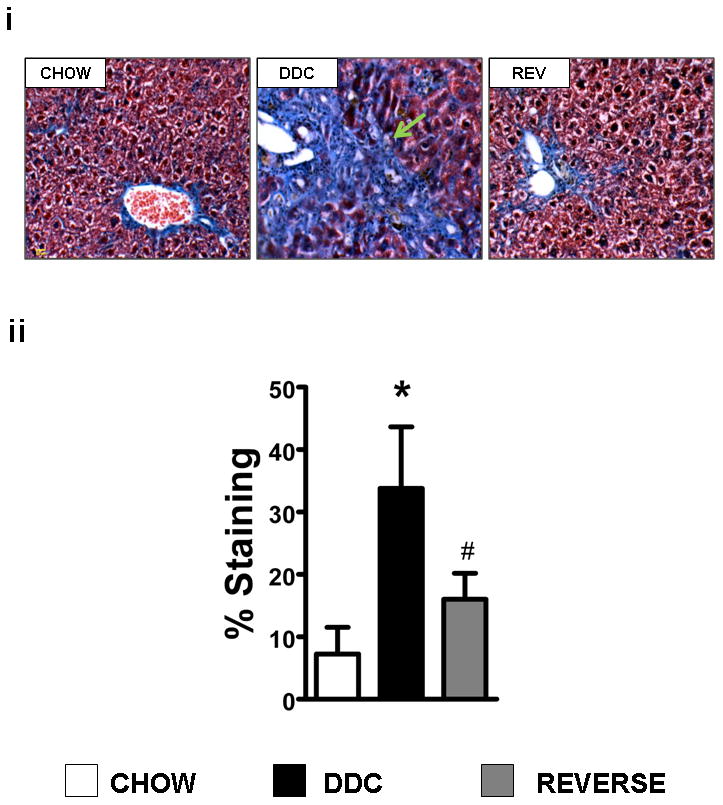
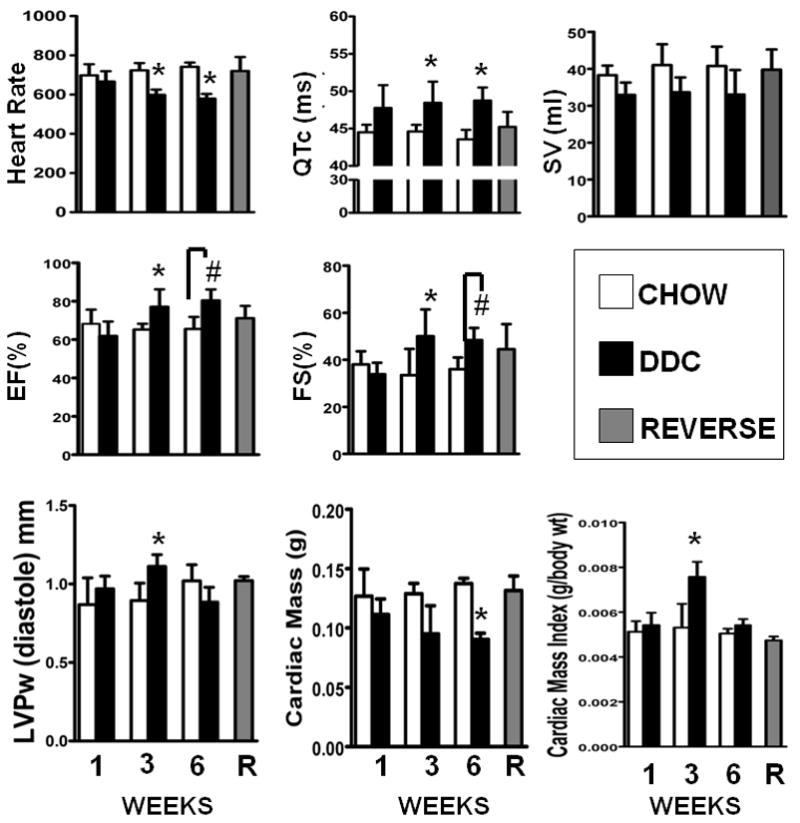
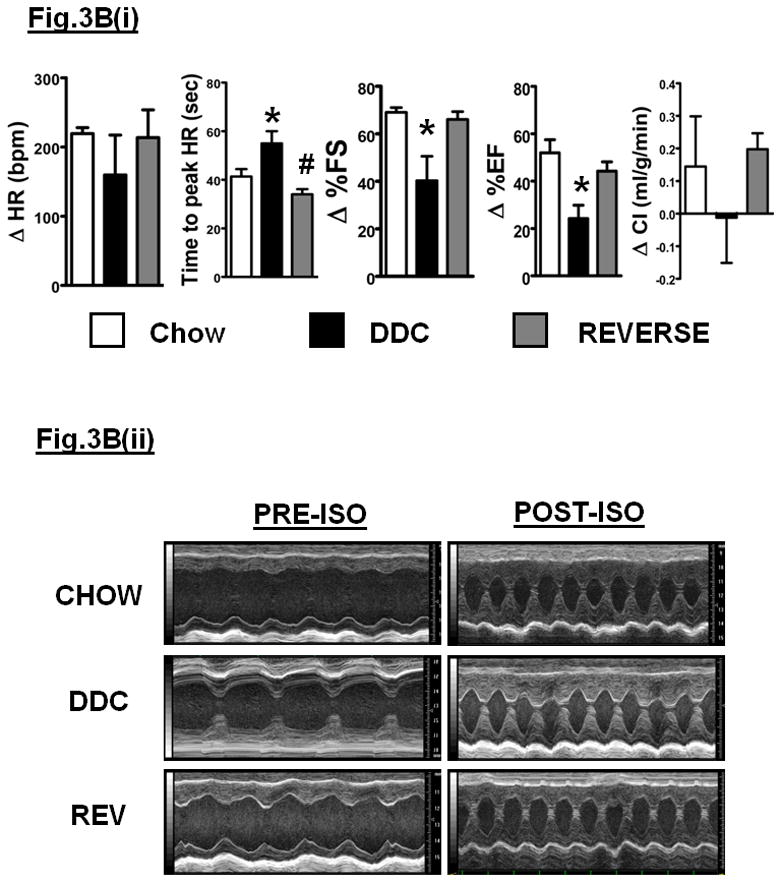
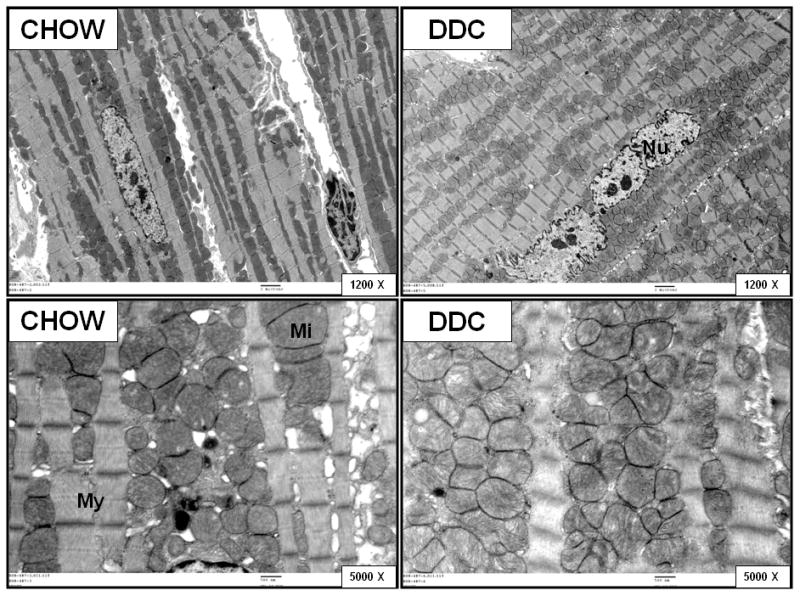
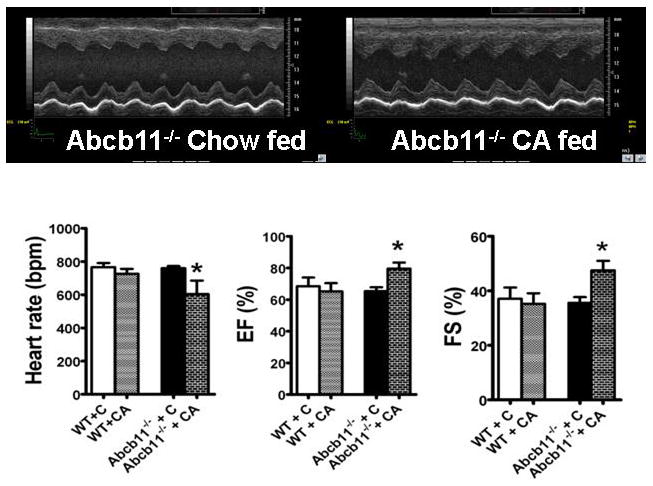
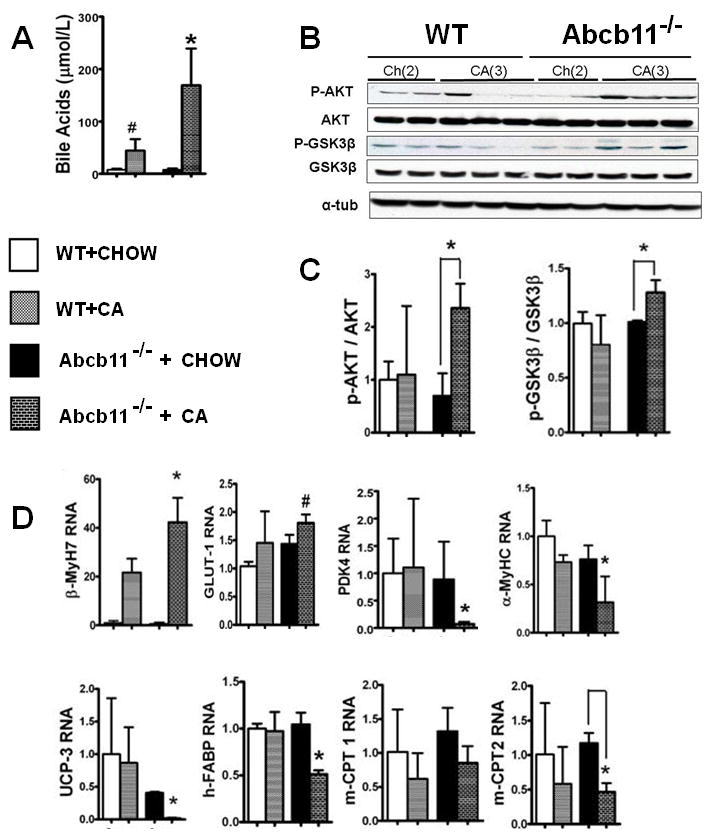
Methods: 6-8 week old male C57BL6J mice were fed either chow (n = 5) or 3,5-diethoxycarbonyl-1,4-dihydroxychollidine (DDC) (n = 10) for 3 weeks. At the end of 3 weeks, half the mice in the DDC fed group were randomized to chow (the reversed [REV] group). Serial ECHOs and electrocardiographic analysis was conducted weekly for 6 weeks followed by liver tissue and serum studies. Hearts were analysed for key components of function and cell signalling. Cardiac physiological and molecular parameters were similarly analysed in Abcb11(-/-) mice (n = 5/grp) fed 0.5% cholic acid supplemented diet for 1 week.

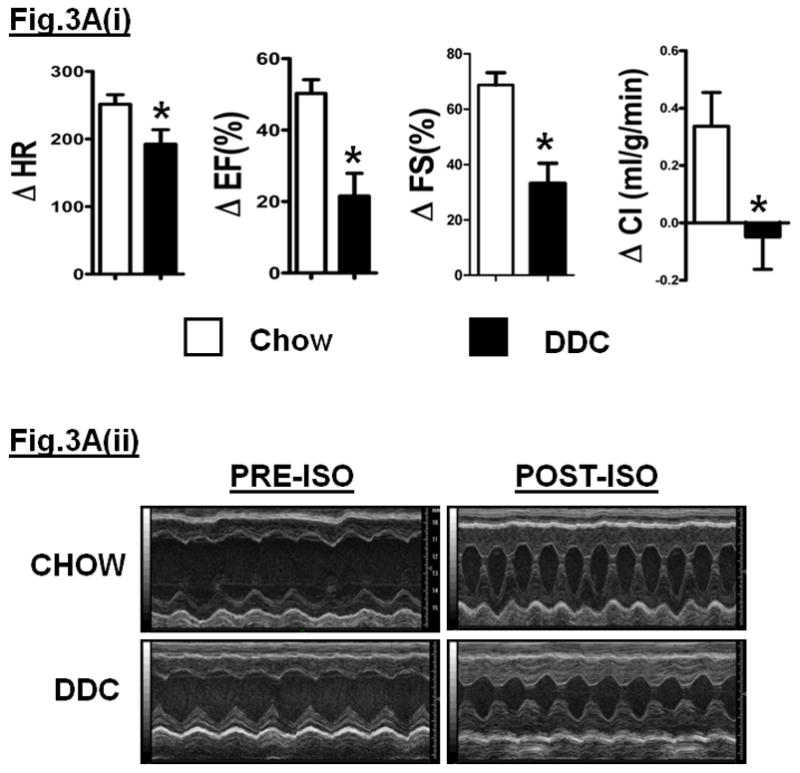
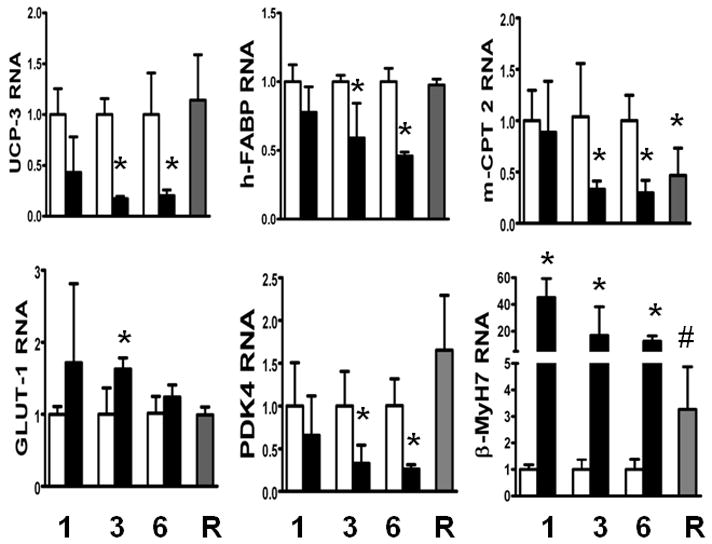
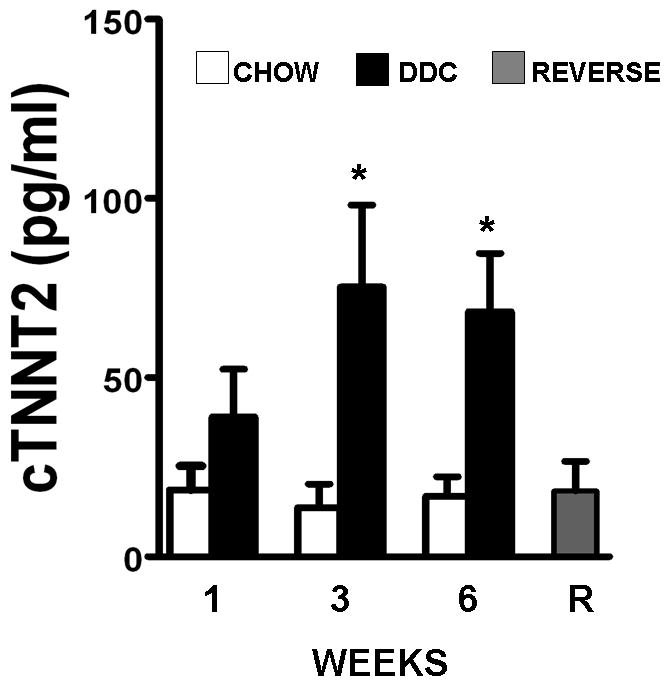
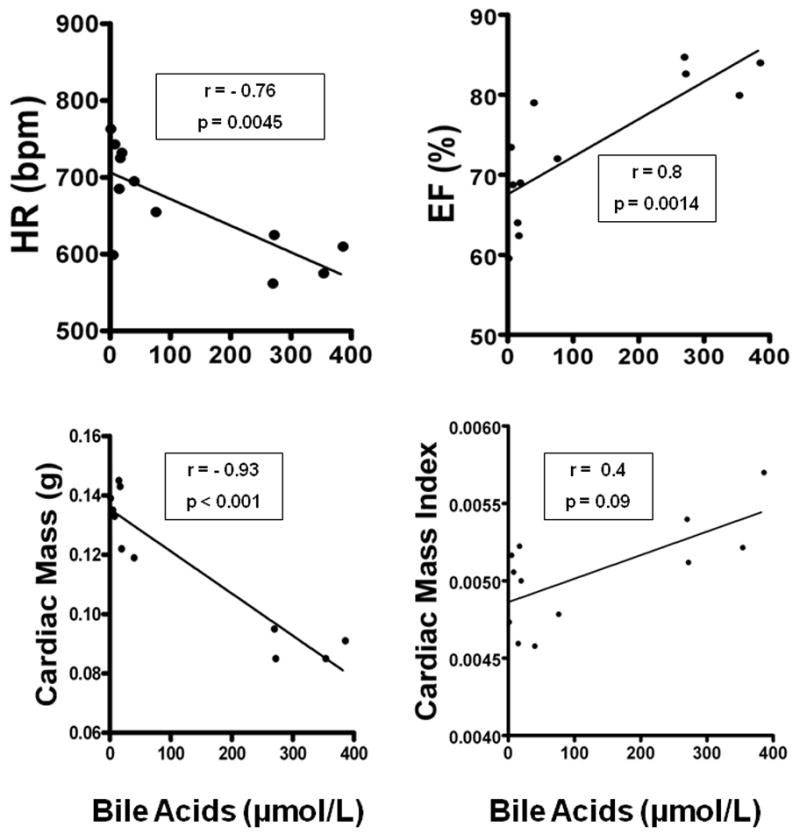
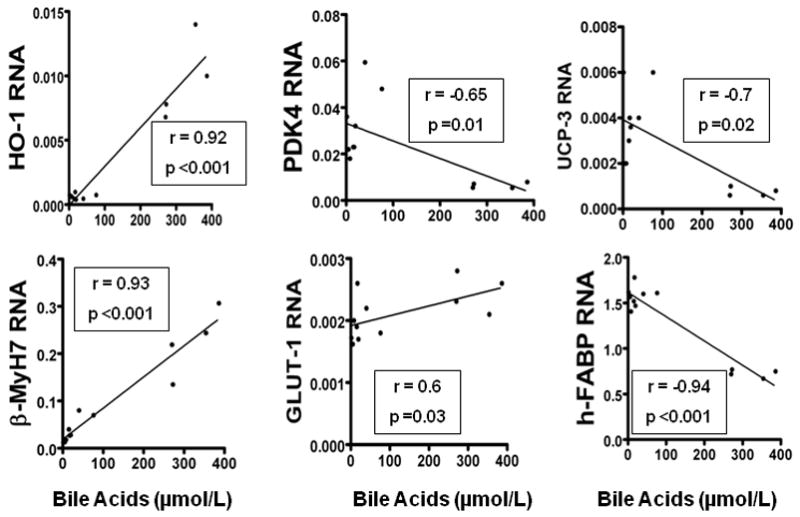
Results: Mice in the REV group showed normalization of biochemical markers of liver injury with resolution of electrocardiographic and ECHO aberrations. Catecholamine resistance seen in DDC group resolved in the REV group. Cardiac recovery was accompanied by normalization of cardiac troponin-T2 as well as resolution of cardiac stress response at RNA level. Cardiovascular physiological and molecular parameters correlated with degree of cholanemia. Cardiomyopathy was reproduced in cholanemic BA fed Abcb11(-/-) mice.

Conclusions: Cardiomyopathy resolves with resolution of liver injury, is associated with cholanaemia, and can be induced by BA feeding.

Keywords: bile acid-myocardial interaction; cardiac adaptation; cholanaemia; hepatic - cardiopathy; liver injury.


Figures

Figure 1
Figure 1
Fig. 1A: Liver injury resolves with reversal of DDC diet: (i) Hematoxyline-Eosin stained representative liver sections of diet-reversed mice (REV) shows recovery but not complete resolution of biliary hyperplasia when compared to livers of mice fed either chow or DDC for 6 weeks. Note severe biliary hyperplasia in 6 week DDC fed mice (arrow). Mag: 40×; scale bar=50μ. (ii) denotes bar graphs of ALT, total and conjugated bilirubin and serum bile acid levels in the mice fed 1 week, 3 weeks and 6 weeks of chow, DDC diet and the reversal group. Note normalization of liver injury, degree of cholestasis and cholanemia in the diet-reversed group (R) (n=5 per group; Results: Mean±SD; Stats: ANOVA with Neuman–Keuhls post –hoc). Fig. 1B: Partial resolution of biliary fibrosis with reversal of DDC diet: (i) Mason-Trichrome stained representative liver sections of diet-reversed mice (REV) shows recovery but not complete resolution of biliary fibrosis when compared to livers of mice fed DDC for 6 weeks. Note severe biliary hyperplasia and fibrosis in 6 week DDC fed mice (arrow). Magnification used 20×; scale bar=50μ. (ii) Bar graphs showing quantitative analysis of fibrosis using Image J (NIH). Results reported as percent area stained blue by collagen. (n=3 mice/group; 4 randomly selected images in 20× magnification; Results: Mean±SD; Stats: ANOVA with Neuman–Keuhls; * p<0.001; # p<0.05)
Figure 1
Figure 1
Fig. 1A: Liver injury resolves with reversal of DDC diet: (i) Hematoxyline-Eosin stained representative liver sections of diet-reversed mice (REV) shows recovery but not complete resolution of biliary hyperplasia when compared to livers of mice fed either chow or DDC for 6 weeks. Note severe biliary hyperplasia in 6 week DDC fed mice (arrow). Mag: 40×; scale bar=50μ. (ii) denotes bar graphs of ALT, total and conjugated bilirubin and serum bile acid levels in the mice fed 1 week, 3 weeks and 6 weeks of chow, DDC diet and the reversal group. Note normalization of liver injury, degree of cholestasis and cholanemia in the diet-reversed group (R) (n=5 per group; Results: Mean±SD; Stats: ANOVA with Neuman–Keuhls post –hoc). Fig. 1B: Partial resolution of biliary fibrosis with reversal of DDC diet: (i) Mason-Trichrome stained representative liver sections of diet-reversed mice (REV) shows recovery but not complete resolution of biliary fibrosis when compared to livers of mice fed DDC for 6 weeks. Note severe biliary hyperplasia and fibrosis in 6 week DDC fed mice (arrow). Magnification used 20×; scale bar=50μ. (ii) Bar graphs showing quantitative analysis of fibrosis using Image J (NIH). Results reported as percent area stained blue by collagen. (n=3 mice/group; 4 randomly selected images in 20× magnification; Results: Mean±SD; Stats: ANOVA with Neuman–Keuhls; * p<0.001; # p<0.05)
Fig. 2
Fig. 2. Normalization of key ECHO parameters on resolution of liver injury
Bar graphs denote key cardiac physiologic parameters, heart rate (HR), corrected QT interval (QTc) as analyzed by rhythm strips, shortening fractions (%FS), ejection fractions (%EF), Left ventricular posterior wall thickness at end diastole (LVPw), cardiac mass, cardiac mass index and stroke volume as assessed by sedated mouse 2DEchoes. Note normalization of the physiologic indices in reversed (REV) group. (* p<0.05; Results: Mean±SD; n=6).
Figure 3
Figure 3
Fig. 3 (A): Catecholamine insensitivity in mice with biliary fibrosis. Mice with biliary fibrosis induced by 3 weeks of DDC feeding show inappropriate cardiac response to isoprenaline challenge when compared to normal chow fed counterparts. (i) Note attenuated changes (Δ) in key ECHO parameters of heart rate (HR), Ejection fraction (EF), shortening fraction (FS) and cardiac output indexed to weight (CI). (ii) shows representative ECHO pictures in M-mode showing attenuated contractility in DDC fed mice post isoprenaline challenge. (n=5 per group; Results: Mean±SD;* p<0.05). Fig. 3 (B): Catecholamine insensitivity resolves with resolution of liver injury: (i) shows bar graphs of heart rate, ejection and shortening fraction and cardiac index in mice in the reversal group as compared to chow and 6 week DDC fed group. Note normalization of response to isoprenaline after reversal of liver injury. (ii) shows representative M-mode ECHOs showing improved isoprenalien response in reversal group.(n=5 per group; Results: Mean±SD;* p<0.05; # p<0.05 compared to chow).
Figure 3
Figure 3
Fig. 3 (A): Catecholamine insensitivity in mice with biliary fibrosis. Mice with biliary fibrosis induced by 3 weeks of DDC feeding show inappropriate cardiac response to isoprenaline challenge when compared to normal chow fed counterparts. (i) Note attenuated changes (Δ) in key ECHO parameters of heart rate (HR), Ejection fraction (EF), shortening fraction (FS) and cardiac output indexed to weight (CI). (ii) shows representative ECHO pictures in M-mode showing attenuated contractility in DDC fed mice post isoprenaline challenge. (n=5 per group; Results: Mean±SD;* p<0.05). Fig. 3 (B): Catecholamine insensitivity resolves with resolution of liver injury: (i) shows bar graphs of heart rate, ejection and shortening fraction and cardiac index in mice in the reversal group as compared to chow and 6 week DDC fed group. Note normalization of response to isoprenaline after reversal of liver injury. (ii) shows representative M-mode ECHOs showing improved isoprenalien response in reversal group.(n=5 per group; Results: Mean±SD;* p<0.05; # p<0.05 compared to chow).
Figure 4
Figure 4
Fig. 4A: Heart re-models to adult metabolic gene program after reversal of liver injury: Bar graph shows QPCR results of key “fetal” genes expressed by heart in stress. Note RNA levels UCP3, h-FABP (key genes regulating fatty acid oxidation); GLUT-1 (glucose uptake) and PDK4 (glucose oxidation) return to chow fed (non-stressed) levels. βMYH7 RNA expression falls significantly after diet reversal compared to the DDC fed mice. This suggests that fetal profile of the stressed DDC fed hearts reverses to non-stressed adult profile after liver injury is reversed. RNA levels are standardized to GAPDH and denoted as fold change compared to chow fed hearts within each group.(*p<0.05 vs. all groups; #p<0.05 vs. all groups; Results: mean±SD; n=5 in each group). Fig. 4B: Bar graph showing serum circulating levels of cTNNT2, as analyzed by ELISA. Note 4 fold increase in cTNNT2 in 3 and 6 week DDC fed animals as compared to chow. cTNNT2 levels normalized to chow levels in the Reversal (R) group. n=4–5/group; Results: Mean±SD; Stats: ANOVA with Neuman-Keuhls post–hoc; *p<0.05) Fig. 4C: Representative Transmission Electron Microscopic pictures (EM) of muscles isolated form the left ventricles of 3 weeks of chow or DDC feeding (n=3 in each group). There was no evidence of myocyte destruction/loss/apoptosis in the DDC fed mice. Here myocytes (My), nucleus (Nu) and mitochondria (Mi) do not show any damage or injury.
Figure 4
Figure 4
Fig. 4A: Heart re-models to adult metabolic gene program after reversal of liver injury: Bar graph shows QPCR results of key “fetal” genes expressed by heart in stress. Note RNA levels UCP3, h-FABP (key genes regulating fatty acid oxidation); GLUT-1 (glucose uptake) and PDK4 (glucose oxidation) return to chow fed (non-stressed) levels. βMYH7 RNA expression falls significantly after diet reversal compared to the DDC fed mice. This suggests that fetal profile of the stressed DDC fed hearts reverses to non-stressed adult profile after liver injury is reversed. RNA levels are standardized to GAPDH and denoted as fold change compared to chow fed hearts within each group.(*p<0.05 vs. all groups; #p<0.05 vs. all groups; Results: mean±SD; n=5 in each group). Fig. 4B: Bar graph showing serum circulating levels of cTNNT2, as analyzed by ELISA. Note 4 fold increase in cTNNT2 in 3 and 6 week DDC fed animals as compared to chow. cTNNT2 levels normalized to chow levels in the Reversal (R) group. n=4–5/group; Results: Mean±SD; Stats: ANOVA with Neuman-Keuhls post–hoc; *p<0.05) Fig. 4C: Representative Transmission Electron Microscopic pictures (EM) of muscles isolated form the left ventricles of 3 weeks of chow or DDC feeding (n=3 in each group). There was no evidence of myocyte destruction/loss/apoptosis in the DDC fed mice. Here myocytes (My), nucleus (Nu) and mitochondria (Mi) do not show any damage or injury.
Figure 5
Figure 5
Fig. 5A: Circulating serum bile acid levels are associated with cardiac physiologic alterations: Regression analysis of key cardiac physiologic parameters (heart rate (HR), ejection fraction (EF), un-indexed and indexed cardiac mass and serum bile acid levels at the end of 6 weeks in chow/DDC/Reversal group, show a negative association between HR, and cardiac mass (unindexed) and a positive association between bile acid levels and LV ejection fraction. (Stats: Pearson correlation, n=15). Fig. 5B: Circulating serum bile acid levels are associated with gene alterations in the heart: Regression analysis of key cardiac RNA levels suggest a positive association between bile acids levels and HO-1, GLUT-1 and βMYH7 RNA and a negative association between UCP-3, h-FABP and PDK4 and bile acid levels at the end of 6 weeks in groups fed either chow, DDC or reversal of diet. (Stats: Pearson correlation, n=15).
Figure 5
Figure 5
Fig. 5A: Circulating serum bile acid levels are associated with cardiac physiologic alterations: Regression analysis of key cardiac physiologic parameters (heart rate (HR), ejection fraction (EF), un-indexed and indexed cardiac mass and serum bile acid levels at the end of 6 weeks in chow/DDC/Reversal group, show a negative association between HR, and cardiac mass (unindexed) and a positive association between bile acid levels and LV ejection fraction. (Stats: Pearson correlation, n=15). Fig. 5B: Circulating serum bile acid levels are associated with gene alterations in the heart: Regression analysis of key cardiac RNA levels suggest a positive association between bile acids levels and HO-1, GLUT-1 and βMYH7 RNA and a negative association between UCP-3, h-FABP and PDK4 and bile acid levels at the end of 6 weeks in groups fed either chow, DDC or reversal of diet. (Stats: Pearson correlation, n=15).
Figure 6
Figure 6
Fig. 6A: Cholanemic CA fed Abcb11−/− mice show altered cardiac physiology. Top panel shows representative M-mode 2DEs depicting increased LV contractility in CA fed cholanemic Abcb11−/− mice. Bar graph below shows CA fed cholanemic Abcb11−/− mice demonstrate lower heart rate, increased ejection (EF) and shortening fraction (FS). (*p<0.05; n=4/grp; ANOVA, Neuman–Keuhls, Results:Mean±SD). Fig. 6 (B): Bile acid fed cholanemic Abcb11−/− mice show altered myocardial signaling. (A) Denotes serum bile acid levels in WT and Abcb11−/− mice. (B) shows representative western blots for AKT, Ser473-phospho-AKT, GSK3β, Ser9-phospho-GSK3β, with α-tubulin. (C) shows analysis of the respective bands normalized to α-tubulin depicting fold change in phosphorylation of AKT and GSK3β. (D) QRTPCR results for β-MyH7, α-MyHC, GLUT-1, PDK4, UCP-3, h-FABP, m-CPT-1 and 2. Values are normalized to GAPDH and denote fold change compared to chow fed WT mice. Results: Mean±SD, ANOVA, n=4/group; *p<0.05; # p<0.05 vs. chow fed).
Figure 6
Figure 6
Fig. 6A: Cholanemic CA fed Abcb11−/− mice show altered cardiac physiology. Top panel shows representative M-mode 2DEs depicting increased LV contractility in CA fed cholanemic Abcb11−/− mice. Bar graph below shows CA fed cholanemic Abcb11−/− mice demonstrate lower heart rate, increased ejection (EF) and shortening fraction (FS). (*p<0.05; n=4/grp; ANOVA, Neuman–Keuhls, Results:Mean±SD). Fig. 6 (B): Bile acid fed cholanemic Abcb11−/− mice show altered myocardial signaling. (A) Denotes serum bile acid levels in WT and Abcb11−/− mice. (B) shows representative western blots for AKT, Ser473-phospho-AKT, GSK3β, Ser9-phospho-GSK3β, with α-tubulin. (C) shows analysis of the respective bands normalized to α-tubulin depicting fold change in phosphorylation of AKT and GSK3β. (D) QRTPCR results for β-MyH7, α-MyHC, GLUT-1, PDK4, UCP-3, h-FABP, m-CPT-1 and 2. Values are normalized to GAPDH and denote fold change compared to chow fed WT mice. Results: Mean±SD, ANOVA, n=4/group; *p<0.05; # p<0.05 vs. chow fed).
Fig. 7
Fig. 7. Postulated mechanism for cirrhotic cardiomyopathy
Heart adapts to bile acid induced stress. The adaptive response is overwhelmed when combined with exogenous stressors such as isoprenaline (catecholamine) resulting in cardiac failure.

Similar articles

Cited by

References

    1. Alqahtani SA, Fouad TR, Lee SS. Cirrhotic cardiomyopathy. Semin Liver Dis. 2008 Feb;28(1):59–69. - PubMed
    1. Moller S, Hove JD, Dixen U, Bendtsen F. New insights into cirrhotic cardiomyopathy. Int J Cardiol. 2012 Oct 4; - PubMed
    1. Wong F. Cirrhotic cardiomyopathy. Hepatol Int. 2009 Mar;3(1):294–304. - PMC - PubMed
    1. Zardi EM, Abbate A, Zardi DM, Dobrina A, Margiotta D, Van Tassel BW, et al. Cirrhotic cardiomyopathy. J Am Coll Cardiol. 2010 Aug 10;56(7):539–549. - PubMed
    1. Arikan C, Kilic M, Tumgor G, Levent E, Yuksekkaya HA, Yagci RV, et al. Impact of liver transplantation on rate-corrected QT interval and myocardial function in children with chronic liver disease*. Pediatr Transplant. 2009 May;13(3):300–306. - PubMed

Publication types

MeSH terms

Substances