

Analysis of organ-enriched microRNAs in plasma as an approach to development of Universal Screening Test: feasibility study
- PMID: 24330742
- PMCID: PMC3867418
- DOI: 10.1186/1479-5876-11-304
Analysis of organ-enriched microRNAs in plasma as an approach to development of Universal Screening Test: feasibility study
Abstract
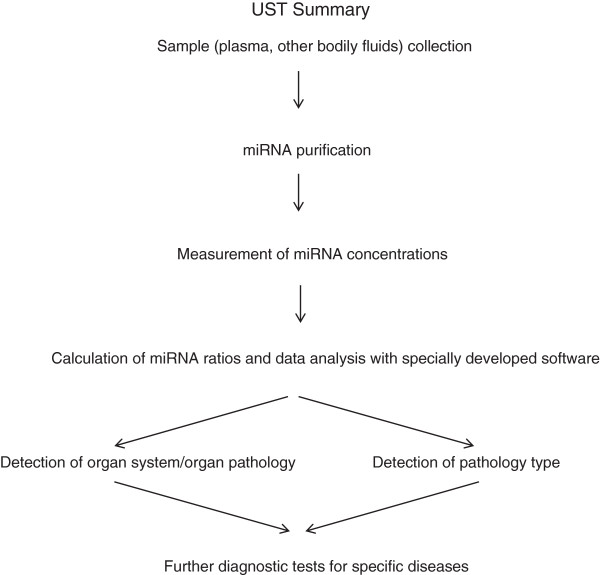
Background: Early disease detection with a minimally invasive screening test will significantly increase effectiveness and decrease the cost of treatment. Here we propose a framework of a novel approach - Universal Screening Test (UST) for the detection of pathological processes in a particular organ system, organ, or tissue by RT-qPCR analysis of circulating cell-free miRNAs in plasma. As the first step towards assessing the feasibility of this concept, the present study was designed to analyze whether the same microRNAs (miRNAs) can detect various diseases of a particular organ system.
Methods: RNA was extracted from plasma using Trizol treatment and silica binding. Levels of miRNAs were measured by single target RT-qPCR. The following innovations have been tested and proven effective: (i) the use of organ system/organ/tissue-enriched miRNAs; (ii) the use of miRNAs associated with broad disease categories, such as cancer and inflammation, in combination with the organ-enriched miRNAs; and (iii) the use of "miRNA pairs" for selecting miRNA combinations with the highest sensitivity and specificity.
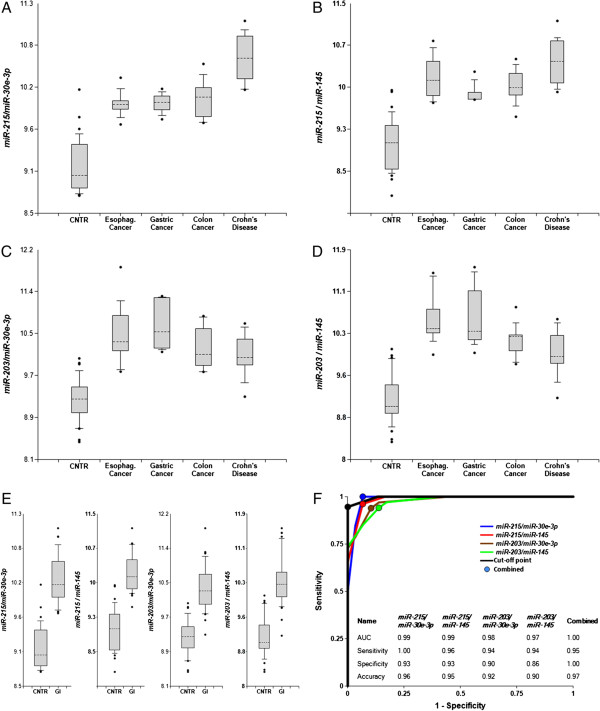
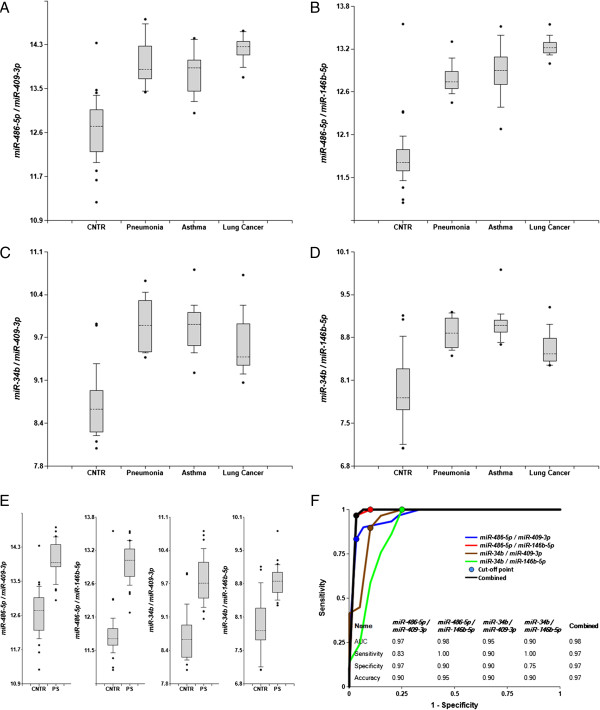
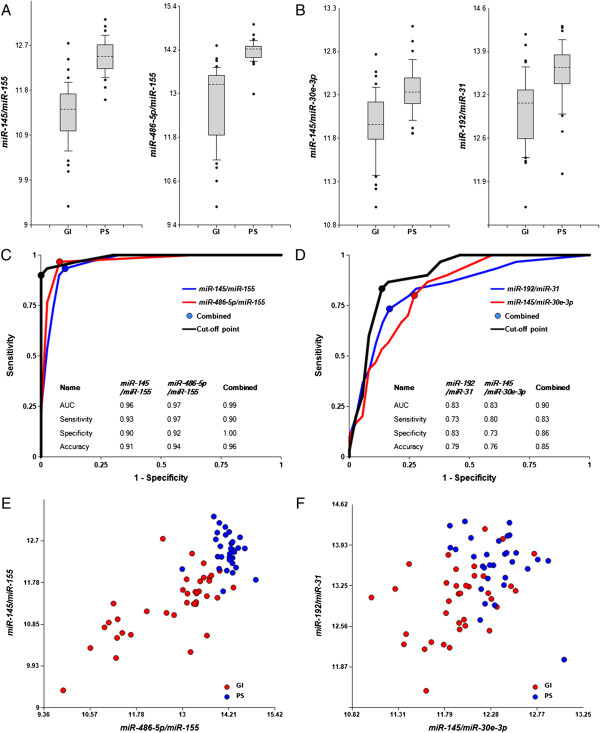
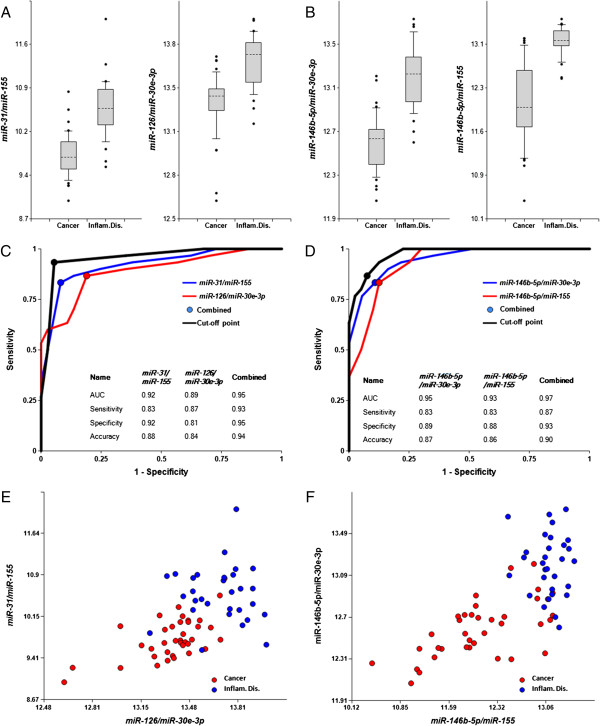
Results: Here we report biomarker miRNA pairs effectively differentiating (i) patients with pulmonary system diseases (asthma, pneumonia and non-small cell lung cancer) and gastrointestinal (GI) system diseases (Crohn's disease, stages I/II esophageal, gastric and colon cancers) from controls, each with 95% accuracy; (ii) patients with a pathology of the pulmonary system from patients with a pathology of the GI system with 94% accuracy; and (iii) cancer patients (stages I/II esophageal, gastric, colon cancers, or non-small cell lung cancer) from patients with inflammatory diseases (asthma, pneumonia, or Crohn's disease) with 93%-95% accuracy.
Conclusions: The results obtained in the present study, along with the data reported by us and others previously, are encouraging and lay the ground for further investigation of the described approach for UST development.
Figures
Similar articles
-
Universal screening test based on analysis of circulating organ-enriched microRNAs: a novel approach to diagnostic screening.Expert Rev Mol Diagn. 2015 Mar;15(3):329-38. doi: 10.1586/14737159.2014.973858. Epub 2014 Oct 30. Expert Rev Mol Diagn. 2015. PMID: 25354444 Review.
-
MicroRNA detection in prostate tumors by quantitative real-time PCR (qPCR).J Vis Exp. 2012 May 16;(63):e3874. doi: 10.3791/3874. J Vis Exp. 2012. PMID: 22643910 Free PMC article.
-
Plasma microRNAs as potential new biomarkers for early detection of early gastric cancer.World J Gastroenterol. 2019 Apr 7;25(13):1580-1591. doi: 10.3748/wjg.v25.i13.1580. World J Gastroenterol. 2019. PMID: 30983818 Free PMC article.
-
Single-step RT-qPCR for detection of extracellular vesicle microRNAs in vivo: a time- and cost-effective method.Am J Physiol Lung Cell Mol Physiol. 2020 Apr 1;318(4):L742-L749. doi: 10.1152/ajplung.00430.2019. Epub 2020 Feb 19. Am J Physiol Lung Cell Mol Physiol. 2020. PMID: 32073880 Free PMC article.
-
Profiling cell-free and circulating miRNA: a clinical diagnostic tool for different cancers.Tumour Biol. 2016 May;37(5):5705-14. doi: 10.1007/s13277-016-4907-3. Epub 2016 Jan 29. Tumour Biol. 2016. PMID: 26831657 Review.
Cited by
-
Free Extracellular miRNA Functionally Targets Cells by Transfecting Exosomes from Their Companion Cells.PLoS One. 2015 Apr 29;10(4):e0122991. doi: 10.1371/journal.pone.0122991. eCollection 2015. PLoS One. 2015. PMID: 25923429 Free PMC article.
-
The expression and clinical significance of microRNAs in colorectal cancer detecting.Tumour Biol. 2015 Apr;36(4):2675-84. doi: 10.1007/s13277-014-2890-0. Epub 2014 Dec 6. Tumour Biol. 2015. PMID: 25480414
-
Predictive power of circulating miRNAs in detecting colorectal cancer.Tumour Biol. 2015 Apr;36(4):2559-67. doi: 10.1007/s13277-014-2872-2. Epub 2014 Dec 20. Tumour Biol. 2015. PMID: 25527153
-
MicroRNAs as Candidate Biomarkers for Alzheimer's Disease.Noncoding RNA. 2021 Feb 1;7(1):8. doi: 10.3390/ncrna7010008. Noncoding RNA. 2021. PMID: 33535543 Free PMC article. Review.
-
miR-203 as a novel biomarker for the diagnosis and prognosis of colorectal cancer: a systematic review and meta-analysis.Onco Targets Ther. 2017 Jul 21;10:3685-3696. doi: 10.2147/OTT.S134252. eCollection 2017. Onco Targets Ther. 2017. PMID: 28769572 Free PMC article.
References
-
- Snyder EM, Olin J, David FS. Maximizing the value of diagnostics in Alzheimer's disease drug development. Nat Rev Drug Discov. 2012;11:183–184. - PubMed
-
- Caldas C. Cancer sequencing unravels clonal evolution. Nat Biotechnol. 2012;30:408–410. - PubMed
-
- Kim VN. Small RNAs: classification, biogenesis, and function. Mol Cells. 2005;19:1–15. - PubMed
-
- Weiland M, Gao XH, Zhou L, Mi QS. Small RNAs have a large impact: circulating microRNAs as biomarkers for human diseases. RNA Biol. 2012;9:850–859. - PubMed
MeSH terms
Substances
LinkOut - more resources
Full Text Sources
Other Literature Sources
Research Materials
