. 2013 Dec 11;14(6):631-40.
doi: 10.1016/j.chom.2013.11.005.

Nasal microenvironments and interspecific interactions influence nasal microbiota complexity and S. aureus carriage

Affiliations

Nasal microenvironments and interspecific interactions influence nasal microbiota complexity and S. aureus carriage

Miling Yan et al. Cell Host Microbe. .

Abstract

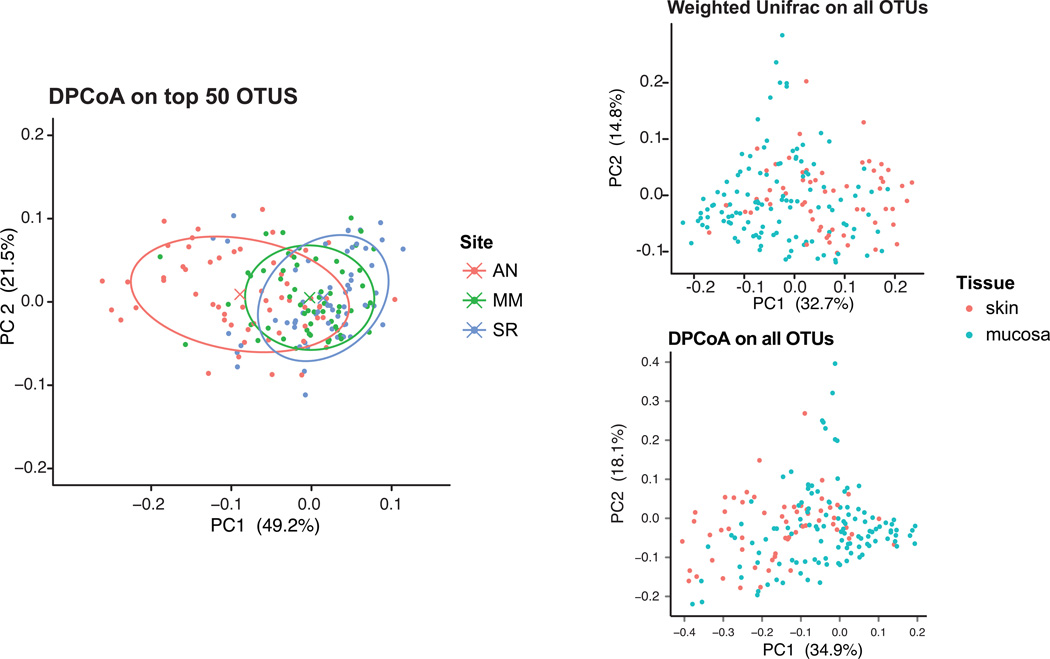
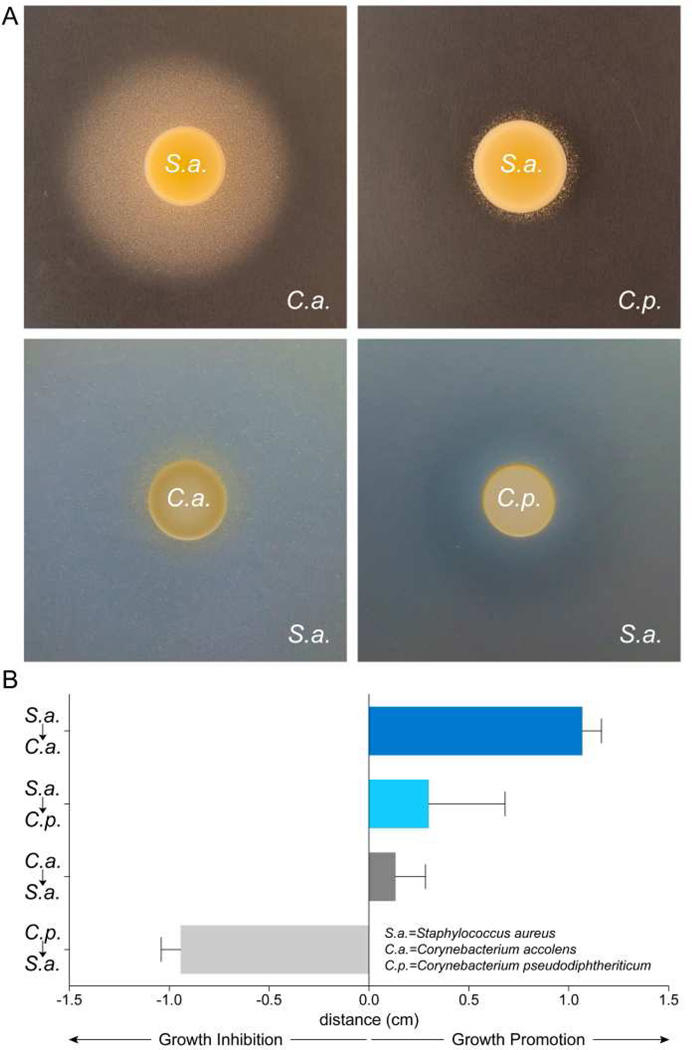
The indigenous microbiota of the nasal cavity plays important roles in human health and disease. Patterns of spatial variation in microbiota composition may help explain Staphylococcus aureus colonization and reveal interspecies and species-host interactions. To assess the biogeography of the nasal microbiota, we sampled healthy subjects, representing both S. aureus carriers and noncarriers at three nasal sites (anterior naris, middle meatus, and sphenoethmoidal recess). Phylogenetic compositional and sparse linear discriminant analyses revealed communities that differed according to site epithelium type and S. aureus culture-based carriage status. Corynebacterium accolens and C. pseudodiphtheriticum were identified as the most important microbial community determinants of S. aureus carriage, and competitive interactions were only evident at sites with ciliated pseudostratified columnar epithelium. In vitro cocultivation experiments provided supporting evidence of interactions among these species. These results highlight spatial variation in nasal microbial communities and differences in community composition between S. aureus carriers and noncarriers.


Figures

Figure 1
Figure 1
Taxonomic composition of nasal communities at three sites in persistent and non-persistent S. aureus carriers. The average relative abundances of the 14 most abundant bacterial genera, as well as S. aureus, are displayed. “Staphylococcus, other” refers to all staphylococci, other than S. aureus. The six Staphylococcus aureus persistent carriers are on the left and the 6 non-persistent carriers are on the right. The locations of the three sampling sites, AN, MM, and SR, in the human nasal cavity are indicated in the schematic at lower right. See also Figure S1, and Table S1.
Figure 2
Figure 2
Alpha-diversity measurements for communities from the anterior naris (AN), middle meatus (MM) and sphenoethmoidal recess (SR). Several alpha diversity metrics were employed (richness, phylogenetic diversity, Shannon index and equitability). The bottom and top of each box are the first and third quartiles, respectively, and the band inside the box is the median. The whiskers represent one standard deviation above and below the mean of the data. Statistical testing was based on the Wilcoxon rank-sum test (* = P < 0.05, **= P < 0.01, *** = P < 0.001, **** = P < 0.0001). See also Figure S2.
Figure 3
Figure 3
Principal coordinate analysis of samples based on tissue type. Two different phylogenetically based beta-diversity metrics, Rao dissimilarity and weighted UniFrac, were employed. On the left, DPCoA, which is based on Rao Dissimilarity, was performed on the top 50 most abundant OTUs. Ellipses centered on the categorical averages revealed an almost complete overlap of the mucosal tissue (middle meatus and sphenoethmoidal recess) samples. On the right, DPCoA and Unifrac PCoA were based on all OTUs. See also Table S2.
Figure 4
Figure 4
DPCoA (A) and (B) weighted UniFrac PCoA of samples based on the carriage status of the individual. DPCoA (A) and UniFrac-based PCoA (B) were performed with all sequence data (A), and DPCoA was performed after removal of all S. aureus sequences from analysis (C). (D) DPCoA in which samples are colored according to relative abundance of S. aureus sequences in that sample. Host carriage status was determined based on conventional clinical culturing of anterior naris swabs as described in Experimental Procedures. See also Figure S3.
Figure 5
Figure 5
Predicted S. aureus carriage status of Human Microbiome Project anterior naris samples. (A) PCoA plots based on Bray Curtis distances. Carriage status is associated with the first principal coordinate (PC1, 12.5%). (B) PCoA of weighted UniFrac distance. The predicted carriage status of the HMP samples appears to separate samples on PC2 (28.2%). Predictions were based upon a random forests classifier built from genus level abundances with data from this study, using a 10fold cross-validation. The resulting classifier had an estimated error of 6.885% +/− 6.9%, as compared with 49.0% from baseline error (random guessing).
Figure 6
Figure 6
The relative abundances of the top two predictors for S. aureus carriage status based upon a sparse linear discriminant model trained on 90% of the data and tested on the remaining 10%. OTU 93808 corresponds with Corynebacterium pseudodiphtheriticum and OTU 62369 corresponds with Corynebacterium accolens. Species-level identifications were based on the SILVA-108 database curated species taxonomic assignments. See also Table S6.
Figure 7
Figure 7
Interactions of Corynebacterium accolens (C.a.) and Corynebacterium pseudodiphtheriticum (C.p.) with Staphylococcus aureus (S.a.) on agar plates. (A) Cells of one bacterial species were added to BHI agar containing 0.5% Tween 80, and cells of another species were spotted at the center of the Petri dish on top of the agar surface. Growth inhibition or growth promotion of the bacterial species in the agar around the colony at the center of the dish is apparent. (B) Growth inhibition and growth promotion were quantified by measuring the distance (cm) between the edge of the colony and the periphery of the inhibition- or growth promotion zone. For example, a S. aureus colony enhanced the growth of C. accolens in the surrounding agar (upper left photo in (A) and top bar in (B)), whereas a C. pseudodiphtheriticum colony inhibited the growth of S. aureus in the surrounding agar (lower right photo in (A) and bottom bar in (B)). Averaged results from at least six experiments per interacting strain pair are shown. Data are represented as mean +/− 1 standard deviation.

References

    1. Caporaso JG, Kuczynski J, Stombaugh J, Bittinger K, Bushman FD, Costello EK, Fierer N, Pena AG, Goodrich JK, Gordon JI, et al. QIIME allows analysis of high-throughput community sequencing data. Nat Methods. 2010;7:335–336. - PMC - PubMed
    1. Casado B, Pannell LK, Iadarola P, Baraniuk JN. Identification of human nasal mucous proteins using proteomics. Proteomics. 2005;5:2949–2959. - PubMed
    1. Clemmensen L, Hastie T, Witten D, Ersboll B. Sparse Discriminant Analysis. Technometrics. 2011;53:406–413.
    1. Cohen NA. Sinonasal mucociliary clearance in health and disease. Annals of Otology, Rhinology & Laryngology Supplement. 2006;196:20–26. - PubMed
    1. Costello EK, Lauber CL, Hamady M, Fierer N, Gordon JI, Knight R. Bacterial community variation in human body habitats across space and time. Science. 2009;326:1694–1697. - PMC - PubMed

Publication types

MeSH terms