. 2013 Dec 11;14(6):696-706.
doi: 10.1016/j.chom.2013.11.007.

Genome-wide mapping of DNA methylation in the human malaria parasite Plasmodium falciparum

Affiliations

Genome-wide mapping of DNA methylation in the human malaria parasite Plasmodium falciparum

Nadia Ponts et al. Cell Host Microbe. .

Abstract

Cytosine DNA methylation is an epigenetic mark in most eukaryotic cells that regulates numerous processes, including gene expression and stress responses. We performed a genome-wide analysis of DNA methylation in the human malaria parasite Plasmodium falciparum. We mapped the positions of methylated cytosines and identified a single functional DNA methyltransferase (Plasmodium falciparum DNA methyltransferase; PfDNMT) that may mediate these genomic modifications. These analyses revealed that the malaria genome is asymmetrically methylated and shares common features with undifferentiated plant and mammalian cells. Notably, core promoters are hypomethylated, and transcript levels correlate with intraexonic methylation. Additionally, there are sharp methylation transitions at nucleosome and exon-intron boundaries. These data suggest that DNA methylation could regulate virulence gene expression and transcription elongation. Furthermore, the broad range of action of DNA methylation and the uniqueness of PfDNMT suggest that the methylation pathway is a potential target for antimalarial strategies.


Figures

Figure 1
Figure 1. Biochemical evidences of the presence of DNA methylations
(A and B) LC-MS/MS detection of me5C. (A) Selected-ion chromatograms for monitoring the m/z 242→126 transition (corresponding to the loss of a 2-deoxyribose) obtained from LC-MS/MS with the injection of: (a) 2.16 nmol of total nucleosides from the enzymatic digestion mixture of Plasmodium gDNA; (b) standard me5C (5-mdC). The integrated peak areas mentioned above the 5-mdC peak show the presence of 5-mdC in the sample. (B) Tandem mass spectra (MS/MS) for monitoring the fragmentation of the [M+H]+ ion (m/z 242) of 5-mdC averaged from the 5-mdC peak in Figure 1A, i.e., the 12.70 and 12.27 min peaks in panels (a) and (b). See also Figure S1. (C and D) DNMT activity in nuclear protein extracts. (C) Measurement of relative fluorescence units (RFU; mean ± SD) after 10 min of incubation for reactions performed with 1 µg of purified bacterial DNMT (Control DNMT), 10 µg of full Plasmodium nuclear protein extract, or buffer only (blank). (D) DNMT activity of 10 µg of full Plasmodium nuclear protein extract in the presence of hydralazine (dashed lines) 100 nM (full triangles), 200 nM (full circles), 500 nM (full diamonds), RG108 100 nM (dotted line, empty triangles), or without inhibitor (plain line, full squares). DNMT activity was expressed in RFU/h/mg after background subtraction. Our results demonstrate the presence of DNMT activity in the nucleus of P. falciparum, consistent with the presence of me5C. See also Figure S1
Figure 2
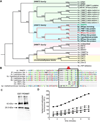
Figure 2. Identification of a functional C5-DNA methyltransferase
(A and B) In silico identification of candidate DNMTs. The genome of A. thaliana (At), H. sapiens (Hs), S. pombe (Sp), N. crassa (Nc), T. gondii (Tg), Cryptosporidium spp. parvum (Cp) and hominis (Ch), and Plasmodium spp. falciparum (Pf), vivax (Pv), yoelii (Py), berghei (Pb), and chabaudi (Pc) were investigated (See Table S1 for accession numbers). (A) Phylogenetic tree of the identified DNMT. Bootstrap values are indicated on the branches. PF3D7_0727300 was identified as a putative PfDNMT2. (B) Multiple alignments of the DNMT2 family of proteins. The conserved DNMT motif IV is highlighted with a black frame. The red arrow shows the presence of the catalytic prolyl-cysteinyl (PC) dipeptide in all Plasmodium and its absence in Cryptosporidium and S. pombe. (C and D) Validation of PF3D7_0727300 as a functional DNMT. (C) Two constructions were prepared: the cloned complete domain included the PC motif whereas the cloned truncated domain did not contain the catalytic PC motif. (D) The DNMT domain of PF3D7_0727300 was GST-tagged, expressed, and purified. The presence of a 42 kDa, representing the protein domain combined to the GST tag, was resolved by SDS-PAGE and revealed by anti-GST western blot. The tag only is also visible at 29.9 kDa. (E) The purified domain was tested for a DNMT activity by fluorimetric ELISA-like assay in the presence of the inhibitors hydralazine (dashed lines) 100 nM (full triangles), 200 nM (full diamonds), 500 nM (black ×), RG108 100 nM (dotted line, full circles), or without inhibitor (plain line, full squares). The truncated domain (missing the PC motif) was also tested for DNMT activity (plain line, empty squares). Activities were measured every minute for 10 min and expressed in RFU/h/mg of protein. The DNMT domain of PF3D7_0727300 containing a PC motif can effectively methylate cytosines. See also Figure S2 and Table S1.
Figure 3
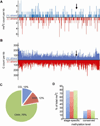
Figure 3. Methylation status of P. falciparum’s genome during the intraerythrocytic cycle
(A) Density profile of me5C content in chromosome 1. The total number of me5C found in 1kb-long non-overlapping windows was counted for each strand. Blue = positive strand; red = negative strand. The arrow shows the position of the centromere. See also Figure S3B. (B) CG-content of chromosome 1. The total number of cytosines was counted on each strand using 1kb-long non-overlapping windows. (C) Methylation context distribution of me5C. The number of me5C present in all possible contexts, i.e., CG, CHG and CHH, was counted. (D) Distribution of me5C according to their level of methylation, for each context. Stage specific = frequency at locus not exceeding 0.33; Conserved = frequency at locus above 0.33. Blue = CG context; red = CHG context; green = CHH context. See also Figure S3 and Table S2.
Figure 4
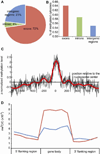
Figure 4. Genomic distribution of methylcytosines
(A) Repartition of me5C within different compartments of the genome. (B) Proportion of methylated cytosines within each compartment of the genome. (C) Methylation status of nucleosomal DNA. For each position in the region spanning 1600bp around the center of nucleosomes (Ponts et al., 2010), me5C/C are averaged and z-normalized (black curve; red curve = Fourier transform of the profile). All replicates are considered. The hypomethylated region spans ~40–80bp around the central position, which is the length of the DNA fragment tightly bound to the histone surface (Brower-Toland et al., 2002). See also Figure S4E. (D) Strand specificity of intragenic me5C (all biological replicates). All genes are considered. Flanking regions and gene bodies are divided into five bins. For each bin, me5C/C are normalized by the size of the bin and averaged among all genes. Red = template strand; blue = non-template strand. See also Figure S4F.
Figure 5
Figure 5. Methylation status of exon/intron boundaries
Methylation status in regions spanning 150bp around 5’ and 3’ splicing junctions. All exon/intron 5’ and 3’ junctions are considered. All me5C/C ratios measured for each position around each exon/intron junction are averaged and z-normalized position-wise (red = template strand; blue = non-template strand). See also Figure S5.
Figure 6
Figure 6. DNA methylation and gene expression
(A) Methylation levels of first exon and mRNA abundance. Highly expressed (95th percentile) and weakly expressed (5th percentile) genes were retrieved and ranked according to their average mRNA abundances across the erythrocytic cycle (Le Roch et al., 2003). First exons were binned into five bins. For each bin, me5C/C are normalized by the size of the bin and z-scored. The representation uses a color scale from black (low methylation) to white (high methylation). See also Figure S6. (B) Average methylation levels of each bin among all genes (red = template strand; blue = non-template strand). (C) Average methylation levels of each bin among selected genes (red = template strand; blue = non-template strand; plain lines = highly expressed; dashed lines = weakly expressed). For each position, values are z-normalized. See also Figure S6.
Figure 7
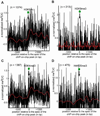
Figure 7. DNA methylation and histone modifications
(A) Methylation status of regions containing H3K9Ac. For each position in the region spanning 1600bp centered on the apex of the chIP-on-chip peak for H3K9Ac (Lopez-Rubio et al., 2009), me5C/C are averaged and z-normalized (black curve; red curve = Fourier transform). The green dot is a scaled representation of a nucleosome. (B) Methylation status of regions containing H3K9me3. (C) Methylation status of regions containing H3K4me3. (D) Methylation status of regions containing H4K20me3. For each modification, similar profiles were obtained considering three biological replicates independently (data not shown). See also Figure S7.

Similar articles

Cited by

References

    1. Bateman A, Coin L, Durbin R, Finn RD, Hollich V, Griffiths-Jones S, Khanna A, Marshall M, Moxon S, Sonnhammer ELL, et al. The Pfam protein families database. Nucleic Acids Res. 2004;32:D138–D141. - PMC - PubMed
    1. Bowyer PW, Simon GM, Cravatt BF, Bogyo M. Global profiling of proteolysis during rupture of Plasmodium falciparum from the host erythrocyte. Mol. Cell Proteomics. 2011;10:M110.001636. - PMC - PubMed
    1. Boyko A, Kovalchuk I. Epigenetic control of plant stress response. Environ Mol Mutagen. 2008;49:61–72. - PubMed
    1. Brueckner B, Garcia Boy R, Siedlecki P, Musch T, Kliem HC, Zielenkiewicz P, Suhai S, Wiessler M, Lyko F. Epigenetic reactivation of tumor suppressor genes by a novel small-molecule inhibitor of human DNA methyltransferases. Cancer Res. 2005;65:6305–6311. - PubMed
    1. Cedar H, Bergman Y. Linking DNA methylation and histone modification: patterns and paradigms. Nat. Rev. Genet. 2009;10:295–304. - PubMed

Publication types

Associated data