. 2013 Dec 9;24(6):710-24.
doi: 10.1016/j.ccr.2013.11.002.

Targeting oxidative stress in embryonal rhabdomyosarcoma

Affiliations

Targeting oxidative stress in embryonal rhabdomyosarcoma

Xiang Chen et al. Cancer Cell. .

Abstract

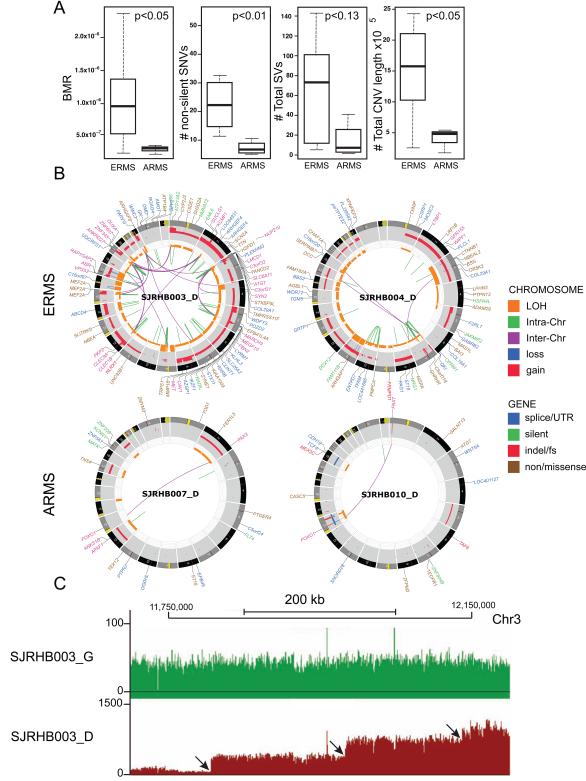
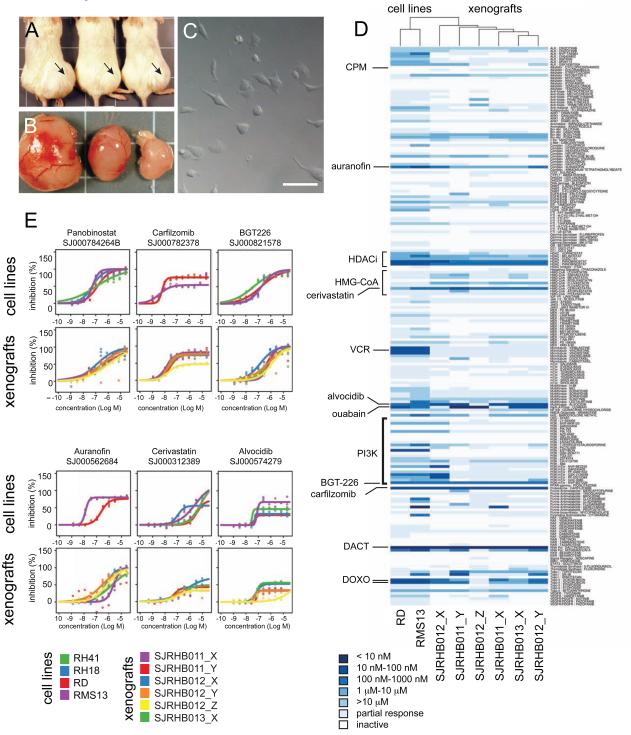
Rhabdomyosarcoma is a soft-tissue sarcoma with molecular and cellular features of developing skeletal muscle. Rhabdomyosarcoma has two major histologic subtypes, embryonal and alveolar, each with distinct clinical, molecular, and genetic features. Genomic analysis shows that embryonal tumors have more structural and copy number variations than alveolar tumors. Mutations in the RAS/NF1 pathway are significantly associated with intermediate- and high-risk embryonal rhabdomyosarcomas (ERMS). In contrast, alveolar rhabdomyosarcomas (ARMS) have fewer genetic lesions overall and no known recurrently mutated cancer consensus genes. To identify therapeutics for ERMS, we developed and characterized orthotopic xenografts of tumors that were sequenced in our study. High-throughput screening of primary cultures derived from those xenografts identified oxidative stress as a pathway of therapeutic relevance for ERMS.


Figures

Figure 1
Figure 1. The genomic landscape of embryonal rhabdomyosarcoma is distinct from that of alveolar rhabdomyosarcoma. (A)
Boxplots of validated BMR, number of non-silent SNVs, total SVs and number of total CNVs in the ERMS and ARMS tumors in the discovery cohort. (B) Representative CIRCOS plots of validated mutations and chromosomal lesions in two ERMS and two ARMS tumors in the discovery cohort. Loss of heterozygosity (orange), gain (red), and losses (blue) are shown. Intrachromosomal translocations (green lines) and interchromosomal translocations (purple lines) are indicated. Sequence mutations in Refseq genes included silent single nucleotide variants (SNVs, green), nonsense and missense SNVs (brown), splice-site and UTR mutations (dark blue), and insertion/deletion mutations (red). (C) Representative plot of sequence reads on chromosome 3 for the matched germline (green) and tumor (red) sample. Distinct regions of copy number change are indicated by arrows. For clarity, some of the gene names have been removed from the CIRCOS plots. In SJRHB003 and SJRHB004, the labels for gene disrupting SVs have been removed. See also Tables S1,2 and Figure S1.
Figure 2
Figure 2. Recurrent embryonal rhabdomyosarcomas acquire new mutations. (A, B)
Hematoxylin and Eosin (H&E) staining (A) and myogenin immunohistochemistry (IHC) (B) of a section of the diagnostic tumor from patient SJRHB011. (C) CIRCOS plots of validated sequence mutations and chromosomal lesion in the diagnostic tumor and the recurrent specimen. (D,E) H&E staining (D) and myogenin IHC (E) of a section of the diagnostic tumor from patient SJRHB012. CIRCOS plot of validated sequence mutations and chromosomal lesion in the diagnostic tumor and the recurrent specimen. Tumor from two different sites were collected at recurrence for this patient. CIRCOS plots are presented as in Figure 1B. In SJRHB011_D, the labels for gene disrupting SVs have been removed. In SJRHB012_R,S the labels for gene disrupting SVs, non-coding mutations and silent mutations have been removed. See also Fig. S2.
Figure 3
Figure 3. Embryonal rhabdomyosarcomas clonally evolve following treatment. (A)
Heatmap of the 841 SNVs (MAF represented by the red intensity) used in the analysis of clonal evolution for SJRHB011. The 4 distinct clusters (A-D) are labeled with different colors on the right side of the heatmap. (B) Model of clonal evolution of SJRHB011. Clusters of SNVs are displayed as dots in colors corresponding to those shown in (A). (C) Heatmap of 1,049 SNVs (MAF represented by the red color intensity) used in the evolutionary analysis of SJRHB012. The 6 distinct clusters (A-F) are labeled with different colors on the right of the heatmap. (D) Clusters of SNVs are displayed as dots in colors corresponding to those shown in (A).
Figure 4
Figure 4. Orthotopic xenografts retain molecular and cellular features of the patient’s tumor. (A)
Representative H&E and myogenin immunohistochemistry from a primary tumor (SJRHB012_D) and the corresponding xenograft (SJRHB012_X). (B) Transmission electron micrographs of SJRHB012_X showing features of rhabdomyosarcoma including myofibers and glycogen. Nuclei (n) are indicated. (C) Circos plot of exonic SNVs for the SJRHB012_D/SJRHB012_X pair. Gene names in black contain SNVs found in the primary and xenograft samples and those shown in blue are unique to the xenograft. (D) SNP 6.0 analysis of copy number changes (left) and LOH (right) for the matched primary and xenograft samples with red showing gain and blue showing loss for copy number and blue showing LOH for the lower panel. (E) Correlation analysis of the RNA-seq data for a representative primary tumor and xenograft pair with a coefficient of 0.752 for this pair (red line). (F) Heatmap of DNA methylation analysis for the matched diagnostic and xenograft pairs. See also Fig. S3.
Figure 5
Figure 5. Embryonal rhabdomyosarcomas have WNT mutations. (A)
Activating mutations in the β-catenin gene in SJRHB004 and SJRHB005 in the discovery cohort. (B) Immunohistochemistry of β-catenin for SJRHB004, SJRHB005 and an alveolar rhabdomyosarcoma, SJRHB008. See also Fig. S4 and Tables S3-S6.
Figure 6
Figure 6. The RAS and p53 pathways are recurrently mutated in embryonal rhabdomyosarcomas. (A)
Summary of mutations in cancer consensus genes and recurrent mutations in non-cancer consensus genes in the discovery (bold) and validation cohorts. Tumor samples are organized by histological subtype and stage. (B) Distribution of oncogenic mutations in NRAS, KRAS and HRAS. (C,D) Distribution of missense mutations in FGFR4 (C) and TP53 (D). See also Fig. S5 and Tables S7,S8.
Figure 7
Figure 7. Embryonal rhabdomyosarcoma xenografts are sensitive to drugs that target oxidative stress. (A)
Pictures of orthotopic xenograft of SJRHB012_X in the muscle of NSG immunocompromised mice. (B) Tumors isolated from the corresponding mice shown in (a). (C) Differential interference contrast micrograph of primary SJRHB012_X cells in a 384 well dish for drug screening. (D) Heatmap and unsupervised clustering of drug sensitivity for two rhabdomyosarcoma cell lines (RD and RMS13) and the 6 xenografts characterized in this study. (E) Dose response curves of cell lines and xenografts to some of the compounds investigated. Abbreviations: CPM, cyclophosphamide; HDACi, histone deacetylase inhibitors; VCR, (E) vincristine; DACT, actinomycin-D; DOXO, doxorubicin. Scale bar in c, 10 μm. See also Fig. S6 and Tables S9, S10.

Comment in

  • RAS and ROS in rhabdomyosarcoma.
    Zhang M, Linardic CM, Kirsch DG. Zhang M, et al. Cancer Cell. 2013 Dec 9;24(6):689-91. doi: 10.1016/j.ccr.2013.11.015. Cancer Cell. 2013. PMID: 24332036 Free PMC article.

References

    1. Comprehensive genomic characterization of squamous cell lung cancers. Nature. 2012;489:519–525. - PMC - PubMed
    1. Barr FG. Chromosomal translocations involving paired box transcription factors in human cancer. The international journal of biochemistry & cell biology. 1997;29:1449–1461. - PubMed
    1. Block K, Gorin Y. Aiding and abetting roles of NOX oxidases in cellular transformation. Nature reviews Cancer. 2012;12:627–637. - PMC - PubMed
    1. Bouitbir J, Charles AL, Echaniz-Laguna A, Kindo M, Daussin F, Auwerx J, Piquard F, Geny B, Zoll J. Opposite effects of statins on mitochondria of cardiac and skeletal muscles: a 'mitohormesis' mechanism involving reactive oxygen species and PGC-1. European heart journal. 2012;33:1397–1407. - PMC - PubMed
    1. Butler LM, Zhou X, Xu WS, Scher HI, Rifkind RA, Marks PA, Richon VM. The histone deacetylase inhibitor SAHA arrests cancer cell growth, up-regulates thioredoxin-binding protein-2, and down-regulates thioredoxin. Proceedings of the National Academy of Sciences of the United States of America.2002. pp. 11700–11705. - PMC - PubMed

Publication types