. 2013 Dec 9;24(6):777-90.
doi: 10.1016/j.ccr.2013.11.003.

Discovery and characterization of super-enhancer-associated dependencies in diffuse large B cell lymphoma

Affiliations

Discovery and characterization of super-enhancer-associated dependencies in diffuse large B cell lymphoma

Bjoern Chapuy et al. Cancer Cell. .

Erratum in

  • Cancer Cell. 2014 Apr 14;25(4):545-6

Abstract

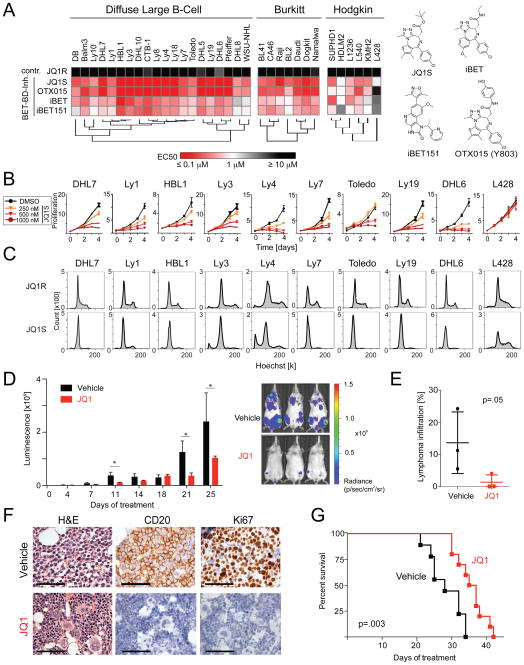
Diffuse large B cell lymphoma (DLBCL) is a biologically heterogeneous and clinically aggressive disease. Here, we explore the role of bromodomain and extra-terminal domain (BET) proteins in DLBCL, using integrative chemical genetics and functional epigenomics. We observe highly asymmetric loading of bromodomain 4 (BRD4) at enhancers, with approximately 33% of all BRD4 localizing to enhancers at 1.6% of occupied genes. These super-enhancers prove particularly sensitive to bromodomain inhibition, explaining the selective effect of BET inhibitors on oncogenic and lineage-specific transcriptional circuits. Functional study of genes marked by super-enhancers identifies DLBCLs dependent on OCA-B and suggests a strategy for discovering unrecognized cancer dependencies. Translational studies performed on a comprehensive panel of DLBCLs establish a therapeutic rationale for evaluating BET inhibitors in this disease.


Figures

Figure 1
Figure 1. In vitro analyses of BET Bromodomain inhibition in various B-cell lymphomas
(A) Hierarchical clustering of mean EC50s of the four BET inhibitors (72 hr treatment) in the indicated panel of B-cell lymphoma cell lines. EC50 values in a colorimetric scale: very sensitive (≤1 μM) in red; sensitive (=1 μM) in white; to resistant (≥10 μM) in black. Corresponding structures are shown. (B) Proliferation of the indicated DLBCL and HL cell lines treated with vehicle or 250–1000 nM JQ1 for 1–4 days. (C) Cell cycle analysis following 72 hr treatment with JQ1 (500 nM) or inactive enantiomer JQ1R (500 nM). Error bars represent the SD of triplicates. (D) Bioluminescence of JQ1 (30 mg/kg IP BID) or vehicle-treated NSG mice xenotransplanted with luciferized mCherry+ Ly1 cells. Asterisks indicate p <.05 using a one-sided t-test. Error bars represent SEM. (E) Lymphoma infiltration of bone marrow in a representative set of animals was assessed by flow cytometric analysis of mCherry+ cells and visualized as scatter plots (median, line; whiskers, SEM). The p values were obtained with a one-sided Mann-Whitney U test. (F) Immunohistochemical analysis of lymphoma (Ly1) BM infiltration in JQ1- and vehicle-treated mice: H&E; anti-human CD20, and anti-Ki67 immunostaining. Scale bar represents 100 μm. (G) Kaplan-Meier plot of the remainder of the Ly1 cohort (n = 21) treated with either vehicle or JQ1 30 mg/kg bid. The p value was obtained by Log-rank test. See also Figure S1 and Table S1.
Figure 2
Figure 2. Transcriptional response to BET inhibition in representative DLBCL cell lines
(A) Hyperenrichment analysis of differentially expressed genes in all five lines (FDR<.01, FC>1.3) following 24 hr of treatment with 500 nM JQ1 or vehicle was performed using a pathway compendium (MSigDB, C2.CP). Results at each timepoint were ranked by FDR and visualized as a color-coded matrix. Up-regulated motifs in red, down-regulated motifs in blue. Intensity of color correlates with FDR significance levels. Highlighted pathways include: Toll-like receptor MYD88, blue; BCR signaling, green; and Cell cycle/E2F, cyan. (B) Mean transcript abundance of TLR10 (left) and MYD88 (right) in all five lines. Error bars represent SEM. (C) Heatmap of TLR pathway components in vehicle- or JQ1-treated DLBCLs (all five lines, 24 hr). (D) The most differentially expressed genes (FDR<.01, FC>1.3) were analyzed for common transcription factor binding sites in the regulatory region using the MSigDB.C3 compendium. Results at each timepoint were ranked using a color-coded matrix as in (A). Genes with MYC binding sites in green and E2F binding sites in cyan. (E) GSEA of multiple functionally defined MYC and E2F transcription factor target gene sets at was performed. Results are reported over time in a color-coded matrix with color intensity reflecting significance level. (F) GSEA plots of functionally defined MYC and E2F target gene sets in vehicle- vs. JQ1-treated cells at 24 hr. (G) Protein abundance of MYC and E2F in the indicated DLBCL lines treated with vehicle or JQ1S or JQ1R (500 nM) (24 hr). See also Figure S2 and Table S2.
Figure 3
Figure 3. Co-localization and function of BRD4 and E2F1 at active promoters
(A) Heatmap of ChIP-Seq reads for RNA Pol II (transcriptionally active; black), H3K4me3 (green), BRD4 (red), and E2F1 (blue) rank ordered from high to low RNA Pol II occupancy centered on a ± 5 kb window around the transcriptional start site (TSS) of all transcriptionally active promoters. Color density reflects enrichment; white indicates no enrichment. (B) Metagenes created from normalized genome-wide average of reads for designated factors centered on a ± 2 kb window around the TSS. (C) GSEA plots of a ChIP-Seq defined E2F1 target gene set in the five DLBCL cell lines treated with vehicle vs. JQ1 for 24 and 48 hr. (D) Assessment of proliferation in Ly1 cell line following genetic depletion of E2F1 with two independent hairpins and a control hairpin (ev). Error bars represent SD, and asterisks show p<.01 by a two-sided Student’s t-test. (E) Immunoblot of E2F1 of cells in (D) to demonstrate knockdown efficiency. See also Figure S3 and Table S3.
Figure 4
Figure 4. Asymmetric BRD4 loading at enhancer elements of actively transcribed genes
(A) Heatmap of ChIP-Seq binding for H3K27ac (blue), BRD4 (red), and BCL6 (orange) rank ordered from high to low H3K27 occupancy centered on a ± 5 kb window around enhancers. Color density reflects enrichment, white indicating no enrichment. (B) Metagenes created from normalized genome-wide average of reads for designated factors centered on a ± 4 kb window around the enhancers. (C) Venn diagram of BRD4-binding and H3K27ac occupancy. 79.1% of H3K27ac regions contain BRD4 and 92.2% of all chromatin-bound BRD4 occurs within H3K27ac regions. (D) Pie chart of BRD4 binding to regions of the genome. BRD4 colocalization with H3K27ac without H3K4me3 defined as enhancer-bound (red); BRD4 colocalization with H3K4me3 reported as promoter-bound (grey); remaining genomic regions in “other” (black). (E) BRD4 loading/binding across enhancers of 18330 genes. 1.6% (285/18330) of enhancers contain 32% of all enhancer-bound BRD4, with super-loading defined as surpassing the inflection point. Top BRD4-superloaded enhancers are indicated. (F) Mean transcript abundance of the genes associated with the 285 most and least BRD4-loaded enhancers (left and right panel, respectively) in five DLBCL cell lines treated with vehicle or JQ1 (2–24 hr). Asterisks indicate a p<.0001 obtained using a two-sided Mann-Whitney U test. See also Table S4 and Figure S4.
Figure 5
Figure 5. Identification of OCA-B as a DLBCL dependency by super-enhancer analysis
(A) ChIP-Seq binding density for H3K27ac (blue), and BRD4 (red) at the enhancer of POU2AF1 following JQ1 (+) or vehicle (DMSO) (−) treatment. (B) ChIP-Seq reads at the POU2AF1 promoter for RNA Polymerase II (black) and H3K4me3 (green) following JQ1 (+) or vehicle (−) treatment. (C) OCA-B transcript and protein abundance in Ly1 cells treated with vehicle or 500 nM JQ1 or JQ1R (24 hr). Error bars represent SD. (D) OCA-B-target genes (leading edge, OCA-B GSEA) in Ly1 cells treated with vehicle or 500 nM JQ1 are visualized as heatmap. (E) Knockdown efficacy of two independent OCA-B shRNAs was detected by western blot (top panel). Proliferation of OCA-B-depleted cells was measured by alamar blue. The p values for control vs. each OCA-B shRNA were delineated by two-sided Student’s t-test; asterisks show p<.01. Error bars represent SD. (F–G) Knockdown efficiency of two independent shRNAs against BRD4 (F) or BRD2 (G) and the associated changes in OCA-B expression were evaluated by western blot. See also Figure S5 and Table S5.
Figure 6
Figure 6. BET inhibition modulates tissue-specifying TF expression by disrupting super-enhancers
(A) ChIP-Seq binding density for H3K27ac (blue), BRD4 (red), and BCL6 (orange) at the BCL6 enhancer following JQ1 (+) or vehicle (DMSO, −) treatment. (B) ChIP-Seq reads at the BCL6 promoter for RNA Pol II (black) and H3K4me3 (green) following JQ1 (+) or vehicle (−) treatment. (C) BCL6 transcript abundance in Ly1 cells 12 and 24 hr following vehicle or JQ1 treatment (derived from GEP data). Error bars represent SD. (D) BCL6 protein abundance following treatment with vehicle or JQ1 or JQ1R (500 nM) (24 hr). (E) ChIP-Seq density of BRD4 (red) at super-enhancers of the two additional B-cell TFs, PAX5 and IRF8, following treatment with JQ1 (+) or DMSO (−). (F and G) PAX5 and IRF8 transcript (F) and protein abundance (G) in Ly1 cells following JQ1 treatment. Error bars represent SD. See also Table S6, Figure S6 and Supplemental Experimental Procedures.
Figure 7
Figure 7. Comparative super-enhancer analysis of DLBCL cell lines and normal lymphoid tissue
(A–D) Rank order of increasing integrated H3K27ac fold enrichment at enhancer loci in DLBCL cell lines, GCB (A), ABC (B) unclassified (C) and normal tonsil (D). (E) H3K27ac ChIP-Seq fold enrichment at the POU2AF1 locus showing the super-enhancer region. (F) H3K27ac ChIP-Seq reads at IRF4 locus in the 2 GCB and 2 ABC cell lines. (G) GSEA plot of the “UP_IN GCB_VS_PC” signature in five DLBCL cell lines following JQ1 treatment. (H) The leading edge genes of the GSEA in (G) were visualized as heatmap. (I) Similarity matrix from unsupervised hierarchical clustering of each cell line by location of super-enhancers. See also Table S7 and Figure S7.
Figure 8
Figure 8. Super-enhancer analysis of primary DLBCLs
(A and B) Rank order of increased H3K27ac fold enrichment at enhancer loci in primary DLBCLs (GCB#1 and #2 (A); ABC#1 and #2 (B)). (C) Gene tracks showing H3K27ac enrichment at the PAX5 locus in all four primary DLBCLs. (D) Tracks as in (C) comparing the H3K27 enrichment at the IRF4 locus in primary GCB vs. ABC DLBCLs. (E) Unsupervised hierarchical clustering of primary DLBCLs using the genomic location of all super-enhancers in Figure S7I. See also Table S8 and Figure S8.

References

    1. Bartholomeeusen K, Xiang Y, Fujinaga K, Peterlin BM. Bromodomain and Extra-terminal (BET) Bromodomain Inhibition Activate Transcription via Transient Release of Positive Transcription Elongation Factor b (P-TEFb) from 7SK Small Nuclear Ribonucleoprotein. The Journal of Biological Chemistry. 2012;287:36609–36616. - PMC - PubMed
    1. Basso K, Dalla-Favera R. Roles of BCL6 in normal and transformed germinal center B cells. Immunological Reviews. 2012;247:172–183. - PubMed
    1. Bisgrove DA, Mahmoudi T, Henklein P, Verdin E. Conserved P-TEFb-interacting domain of BRD4 inhibits HIV transcription. Proc Natl Acad Sci U S A. 2007;104:13690–13695. - PMC - PubMed
    1. Caro P, Kishan AU, Norberg E, Stanley IA, Chapuy B, Ficarro SB, Polak K, Tondera D, Gounarides J, Yin H, et al. Metabolic signatures uncover distinct targets in molecular subsets of diffuse large B cell lymphoma. Cancer Cell. 2012;22:547–560. - PMC - PubMed
    1. Chen L, Monti S, Juszczynski P, Ouyang J, Chapuy B, Neuberg D, Doench JG, Bogusz AM, Habermann TM, Dogan A, et al. SYK inhibition modulates distinct PI3K/AKT- dependent survival pathways and cholesterol biosynthesis in diffuse large B cell lymphomas. Cancer Cell. 2013;23:826–838. - PMC - PubMed

Publication types

Associated data