. 2014 Jan 6;24(1):40-49.
doi: 10.1016/j.cub.2013.10.077. Epub 2013 Dec 12.

An ecological network of polysaccharide utilization among human intestinal symbionts

Affiliations

An ecological network of polysaccharide utilization among human intestinal symbionts

Seth Rakoff-Nahoum et al. Curr Biol. .

Abstract

Background: The human intestine is colonized with trillions of microorganisms important to health and disease. There has been an intensive effort to catalog the species and genetic content of this microbial ecosystem. However, little is known of the ecological interactions between these microbes, a prerequisite to understanding the dynamics and stability of this host-associated microbial community. Here we perform a systematic investigation of public goods-based syntrophic interactions among the abundant human gut bacteria, the Bacteroidales.

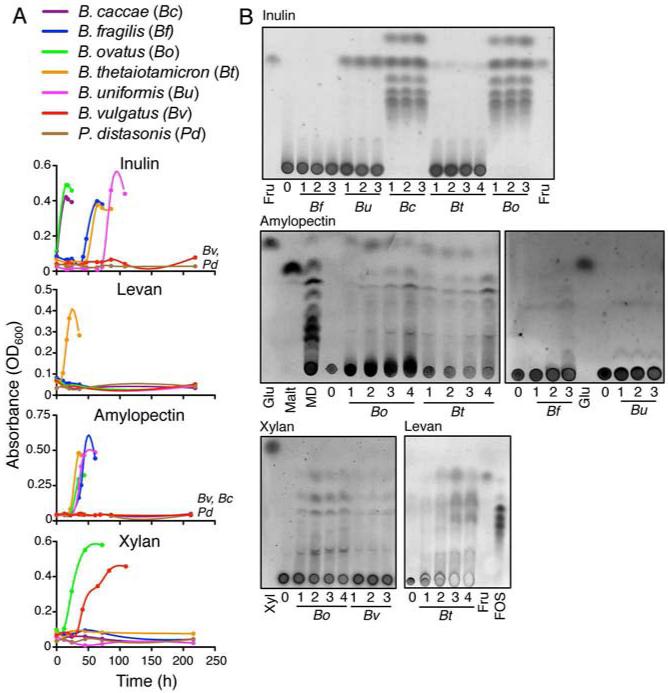
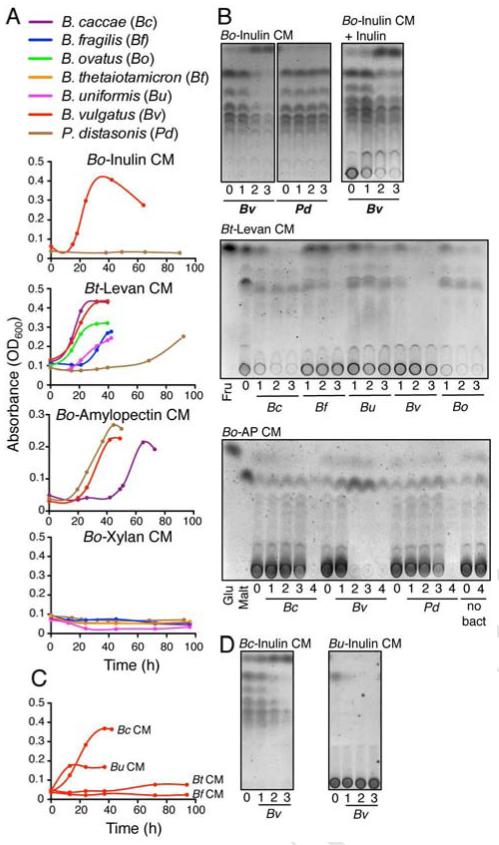
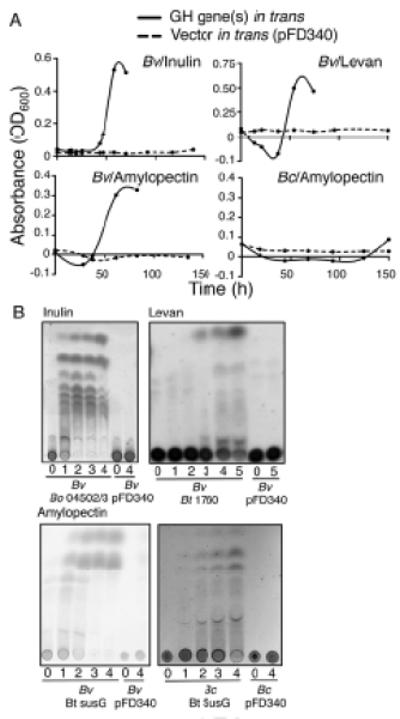
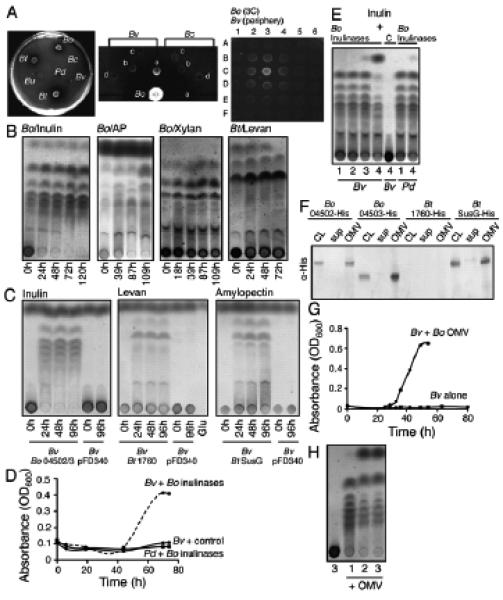
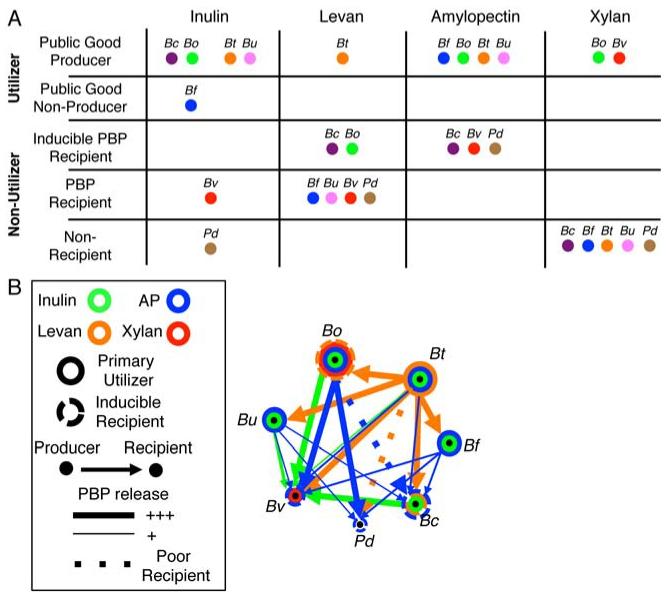
Results: We find evidence for a rich interaction network based on the breakdown and use of polysaccharides. Species that utilize a particular polysaccharide (producers) liberate polysaccharide breakdown products (PBPs) that are consumed by other species unable to grow on the polysaccharide alone (recipients). Cross-species gene addition experiments demonstrate that recipients can grow on a polysaccharide if the producer-derived glycoside hydrolase, responsible for PBP generation, is provided. These producer-derived glycoside hydrolases are public goods transported extracellularly in outer membrane vesicles allowing for the creation of PBP and concomitant recipient growth spatially distant from the producer. Recipients can exploit these ecological interactions and conditionally outgrow producers. Finally, we show that these public goods-based interactions occur among Bacteroidales species coresident within a natural human intestinal community.

Conclusions: This study examines public goods-based syntrophic interactions between bacterial members of the human gut microbial ecosystem. This polysaccharide-based network likely represents foundational relationships creating organized ecological units within the intestinal microbiota, knowledge of which can be applied to impact human health.


Figures

Figure 1
Figure 1. Variation among Bacteroidales members in ability to utilize polysaccharides and to publicly liberate PBP
(A) Growth curves of bacteria in defined media with indicated polysaccharide as carbohydrate source. (B) Thin layer chromatography (TLC) analyses of polysaccharide breakdown products in the CM of primary utilizers through the growth phases (1-early, 2-mid, 3-late log, −4 stationary) in defined media with indicated polysaccharide as carbohydrate source. The intact polysaccharides do not migrate from the bottom of the TLC plate. PBP are continually generated as they are consumed during bacterial growth due to continued breakdown of polysaccharide. Fru = Fructose, FOS = Fructose oligosaccharides (derived from inulin), Glu = Glucose, Malt = Maltose, MD= Maltodextrin. Data are representative of ≥3 independent experiments, one representative experiment is shown.
Figure 2
Figure 2. Specific non-polysaccharide utilizing Bacteroidales members can utilize liberated PBP public goods
(A) Growth curves of non-primary utilizing bacteria in media conditioned by PBP-liberating utilizers. (B) TLC analysis of culture supernatants of recipient bacteria grown in the CM of primary utilizers . As P.distasonis did not grow in Bo-Inulin CM, its time points correspond to the growth points of B. vulgatus in the same CM through the growth phases (1-mid, 2-late log, 3-stationary). (C) Growth curves of B. vulgatus in inulin media conditioned by different species of inulin-utilizing Bacteroidales. (D) TLC analysis of culture supernatants of B. vulgatus grown in B. caccae and B. uniformis inulin CM through the growth phases (1-mid, 2-late log, 3-stationary). Data are representative of ≥3 independent experiments, one representative experiment is shown.
Figure 3
Figure 3. Primary growth and PBP liberation by recipients containing producer- derived GH/PL genes
(A). Growth curves of recipient bacteria with genes encoding the B. ovatus inulin PLs (BACOVA_04502 and 04503), the B. thetaiotaomicron levan GH (BT_1760), the B. thetaiotaomicron amylopectin GH (susG, BT_3698), or vector alone (pFD340) in defined polysaccharide media. The initial decrease in OD600 in amylopectin and levan media correspond to rapid degradation of these optically dense polysaccharides. (B) TLC analyses of PBP released from recipient strains containing GH/PL genes in trans, or vector alone (pFD340) through the growth phases (inulin and amylopectin: 1-early, 2-mid, 3-late log, -4 stationary; levan: 1-lag, 2-early, 3-mid, 4-late log, 5-stationary). As recipient with vector alone did not grow in polysaccharide media, its time points correspond to the growth points of recipient strains containing GH/PL genes in trans. Data are representative of ≥3 independent experiments, one representative experiment is shown.
Figure 4
Figure 4. GH/PLs serve as public goods through secretion in outer membrane vesicles
(A) (left panel) Growth of utilizers on defined amylopectin agarose plates demonstrating amylopectin degraded zones surrounding Bf, Bo, and Bt, demonstrating extracellular release of GH. (middle panel) Growth capabilities of recipient (Bv) and late recipient (Bc) plated at various distances (a, b, c, d) from the producer B. ovatus on a defined amylopectin plate (middle). (left) B. vulgatus is only able to grow in the zone of amylopectin degradation, whereas late recipient, B. caccae does not. (Right panel) Growth of recipient B. vulgatus (spotted on all 36 spots except 3C) is dictated by its spatial proximity to the producer B. ovatus (spotted on 3C) on a defined inulin plate (right panel). (B) TLC analyses of GH/PL activity in culture supernatants of PBP-liberating utilizer strains grown in indicated defined medium with extra polysaccharide added and incubated over time. The polysaccharide at the origin of the TLC is degraded with accumulation of PBP. (C) TLC analysis of extracellular GH/PL activity from recipient strains with GH/PL genes in trans or vector alone. Bacteria were cultured in defined glucose medium without polysaccharide as the GH/PL genes are expressed from a constitutive plasmid-borne promoter. Supernatants were harvested, filter sterilized and diluted 1:1 with medium containing the indicated polysaccharide and incubated at 37°C over time prior to TLC analysis. The glucose at the top of the TLC is from the initial growth medium. Glu = Glucose. (D) Growth of B. vulgatus but not P. distasonis in defined inulin medium with purified BACOVA_04502 and BACOVA_04503 added to the medium. B. vulgatus does not grow with material purified from the vector only control. (E) TLC analysis of the resulting media from the samples shown in panel D, through the growth phases (1-lag, 2-lag, 3-late log, 4-stationary), demonstrating PBP consumption by B. vulgatus. C indicates B. vulgatus grown with material prepared from vector-only control. As this B. vulgatus with vector control material and P.distasonis did not grow in Bo-Inulin CM, its time points correspond to the growth points of B. vulgatus with inulinases through the growth phases (F) Western immunoblot analysis of cell lysates (CL), supernatant (sup) or OMV from wild type transconjugants synthesizing His-tagged GH/PLs. BT_1760 was not tracked in this assay. (G) Growth of B. vulgatus in defined inulin medium with added outer membrane vesicles (OMV) isolated from B. ovatus inulin CM. The OMV were harvested from supernatant of B. ovatus grown to log-phase so that the bacteria were actively growing at the time of harvest. (H) TLC analysis of the resulting media from the samples shown in panel G, through the growth phases (1-early, 2-mid, 3-late log) demonstrating PBP consumption by B. vulgatus during growth in OMV + inulin media. The first lane is B. vulgatus cultured inulin medium without OMV at the same timepoint as B. vulgatus with OMV at timepoint 3. Data are representative of ≥2 independent experiments, one representative experiment is shown.
Figure 5
Figure 5. Ecological classes and network of polysaccharide utilization
(A) Schematic diagram designating Bacteroidales type strains to one of five ecological classes: utilizer/public good producer, utilizer/public good non-producer, inducible PBP public good recipient, PBP public good recipient (non-inducible), and non-recipient. (B) A network of interactions based on PS utilization for Bacteroidales type strains.
Figure 6
Figure 6. Fitness assays of polysaccharide utilizing and non-utilizing strains in co-culture
Growth of type strains in co-culture or monoculture in (A) defined inulin medium or (B) defined amylopectin medium. The B ovatus strain is an arginine auxotrophic mutant allowing for analyses under both growth limiting (low arginine, 1 μg/ml) and non-limiting (high arginine, 16 μg/ml) conditions. Solid lines represent bacterial counts from monoculture experiments, whereas dotted lines represent bacterial counts from co-culture experiments. Monoculture experiments for recipients were performed under low arginine conditions only, as their growth is not affected by arginine; therefore, this growth curve is used for both producer-limited and not limited experiments. The limit of detection (indicated with * for strains that were below detection) for a given experiment is set at 2 logs below the total density of the culture. Data are representative of ≥3 independent experiments, one representative experiment is shown. Comparison of growth rates: Inulin producer non-limited: Bv in monoculture (-0.08 +/- 1.17) vs. Bv in co-culture (4.62 +/− 0.05), p = 0.027. Bo in monoculture (5.58 +/− 0.24) vs Bo in co-culture with Bv (7.24 +/− 2.4), p = 0.30, not significant (ns). Relative frequency producer : recipient (93.9% +/− 2.4 : 6.1% +/− 2.4. Inulin producer limited: Bv in monoculture (−0.08 +/− 1.17) vs. Bv in co-culture (3.9 +/− 1.2 ), p = 0.005. Relative frequency producer : recipient (5.3% +/− 2.1 : 94.7% +/− 2.1). Bo in monoculture (3.14 +/− 0.37) vs. Bo in co- culture with Bv (3.08 +/− 1.1), p = 0.48, ns. Amylopectin producer non-limited: Bv in monoculture (-2.67 +/− 0.73) vs. Bv in co-culture (4.69 +/− 2.54), p = 0.02. Bo in monoculture (6.06 +/− 1.13) vs. Bo in co-culture with Bv (9.34 +/− 0.89), p = 0.02. Relative frequency producer : recipient (96% +/− 1 : 4% +/− 1). Pd in monoculture (−1.95 +/− 1.07) vs. Pd in co-culture (1.42 +/− 1.56), p = 0.05. Bo in monoculture (6.07 +/− 1.13) vs. Bo in co-culture with Pd (9.88 +/− 0.52), p = 0.045. Relative frequency producer : recipient (92% +/− 2.7 : 8% +/− 2.7). Amylopectin producer limited: Bv in monoculture (− 2.7 +/− 1.15) vs. Bv in co-culture (11.2 +/− 4.1), p = 0.02. Bo in monoculture (6.4 +/− 1.77) vs. Bo in co-culture with Bv (6.22 +/− 1.08), p = 0.42, ns . Relative frequency producer : recipient (4.6% +/− 2.7 : 95.4% +/− 2.7). Pd in monoculture (−1.82 +/− 1.23) vs. Pd in co-culture (5.84 +/− 3.35), p = 0.87, ns. Bo in monoculture (6.37 +/− 1.78) vs Bo in co-culture with Pd (4.9 +/− 0.23), p = 0.21. Relative frequency producer : recipient (15.7% +/− 7.5 : 84.4%+/− 7.5). Limits of detection precluded determination of growth rate of Pd in inulin co-culture and Bc in amylopectin co-culture.
Figure 7
Figure 7. Polysaccharide-based ecological relationships of naturally co-resident Bacteroidales
(A) Growth curves of naturally co-resident Bacteroidales strains from human subject CL03 in the four defined polysaccharide media. (B) TLC analysis of PBP release during growth of CL03 strains in defined polysaccharide media. (C) Growth and (D) TLC analysis of PBP consumption by CL03 non-utilizing stains grown in the CM of primary utilizers, through the growth phases (1-early, 2-mid, 3-late log). Producer-derived CM was diluted with fresh polysaccharide containing defined media for recipient growth to assess inducible polysaccharide utilization. Therefore, lane 0 (undiluted producer CM) has less polysaccharide than the subsequent lanes. Data are representative of ≥2 independent experiments, one representative experiment is shown.

Similar articles

Cited by

References

    1. Kau AL, Ahern PP, Griffin NW, Goodman AL, Gordon JI. Human nutrition, the gut microbiome and the immune system. Nature. 2011;474:327–336. - PMC - PubMed
    1. Nicholson JK, Holmes E, Kinross J, Burcelin R, Gibson G, Jia W, Pettersson S. Host-gut microbiota metabolic interactions. Science. 2012;336:1262–1267. - PubMed
    1. Hooper LV, Littman DR, Macpherson AJ. Interactions between the microbiota and the immune system. Science. 2012;336:1268–1273. - PMC - PubMed
    1. Faith JJ, Guruge JL, Charbonneau M, Subramanian S, Seedorf H, Goodman AL, Clemente JC, Knight R, Heath AC, Leibel RL, et al. The long-term stability of the human gut microbiota. Science. 2013;341:1237439. - PMC - PubMed
    1. Eckburg PB, Bik EM, Bernstein CN, Purdom E, Dethlefsen L, Sargent M, Gill SR, Nelson KE, Relman DA. Diversity of the human intestinal microbial flora. Science. 2005;308:1635–1638. - PMC - PubMed

Publication types

Substances