. 2013 Dec 19;155(7):1639-51.
doi: 10.1016/j.cell.2013.11.029. Epub 2013 Dec 12.

Collective invasion in breast cancer requires a conserved basal epithelial program

Affiliations

Collective invasion in breast cancer requires a conserved basal epithelial program

Kevin J Cheung et al. Cell. .

Abstract

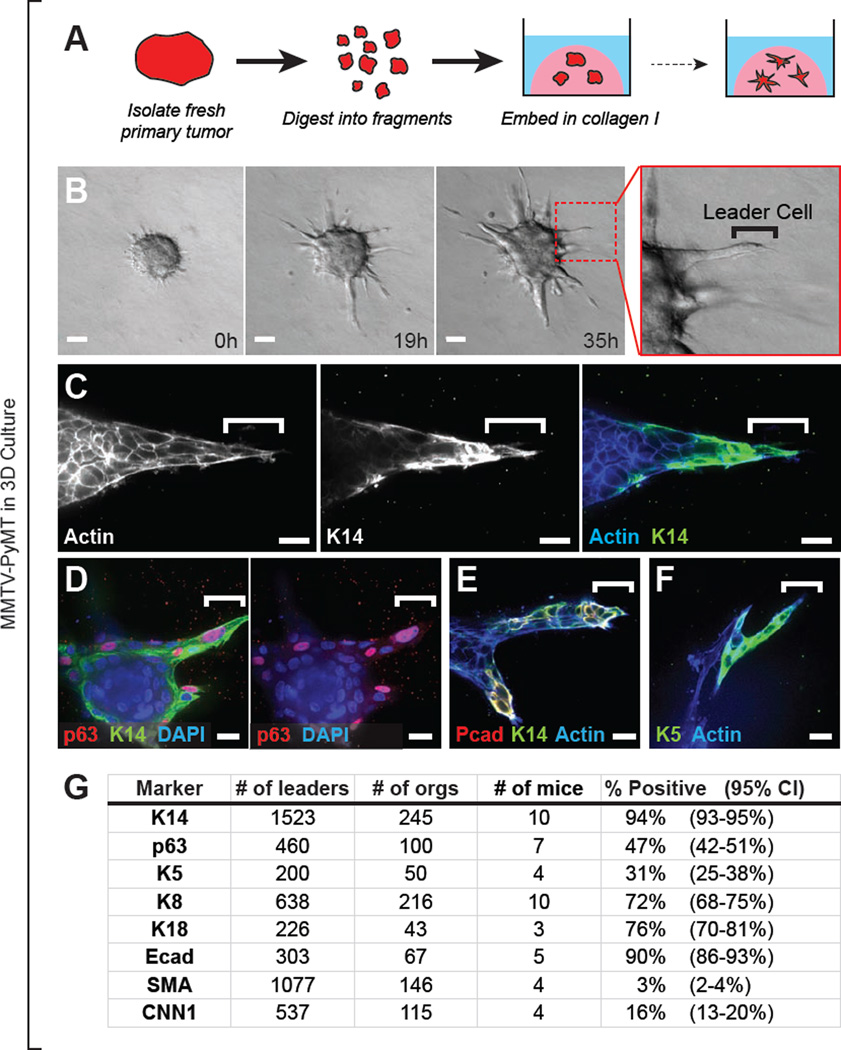
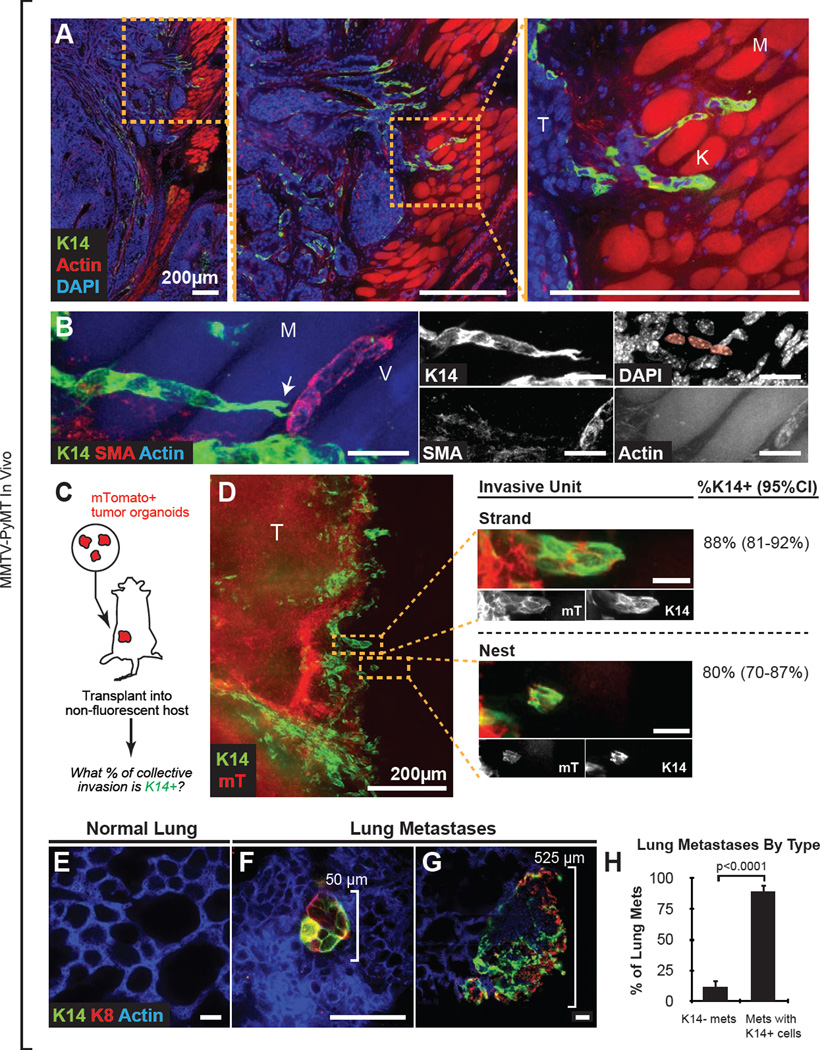
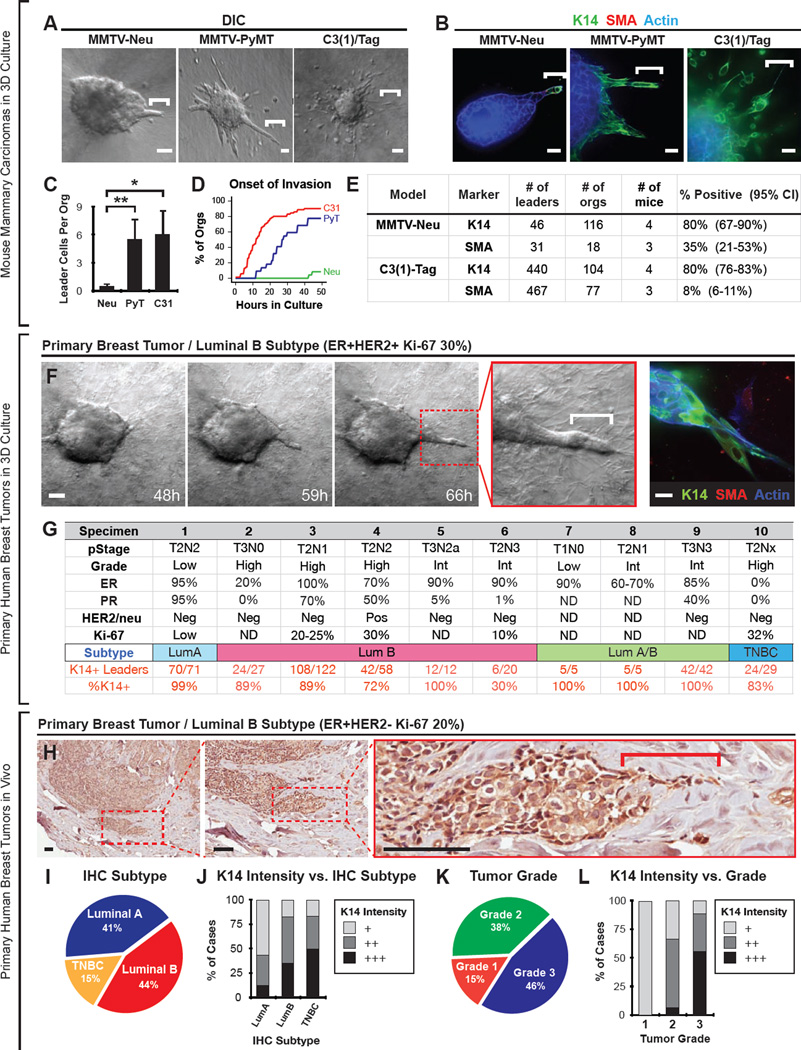
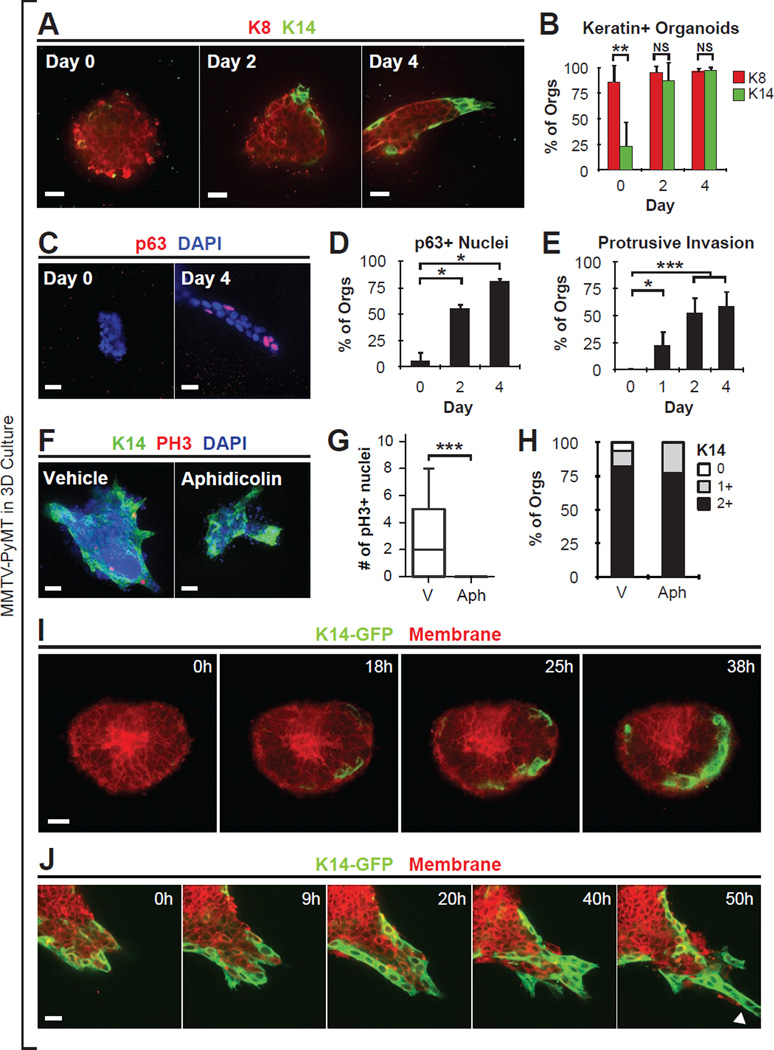
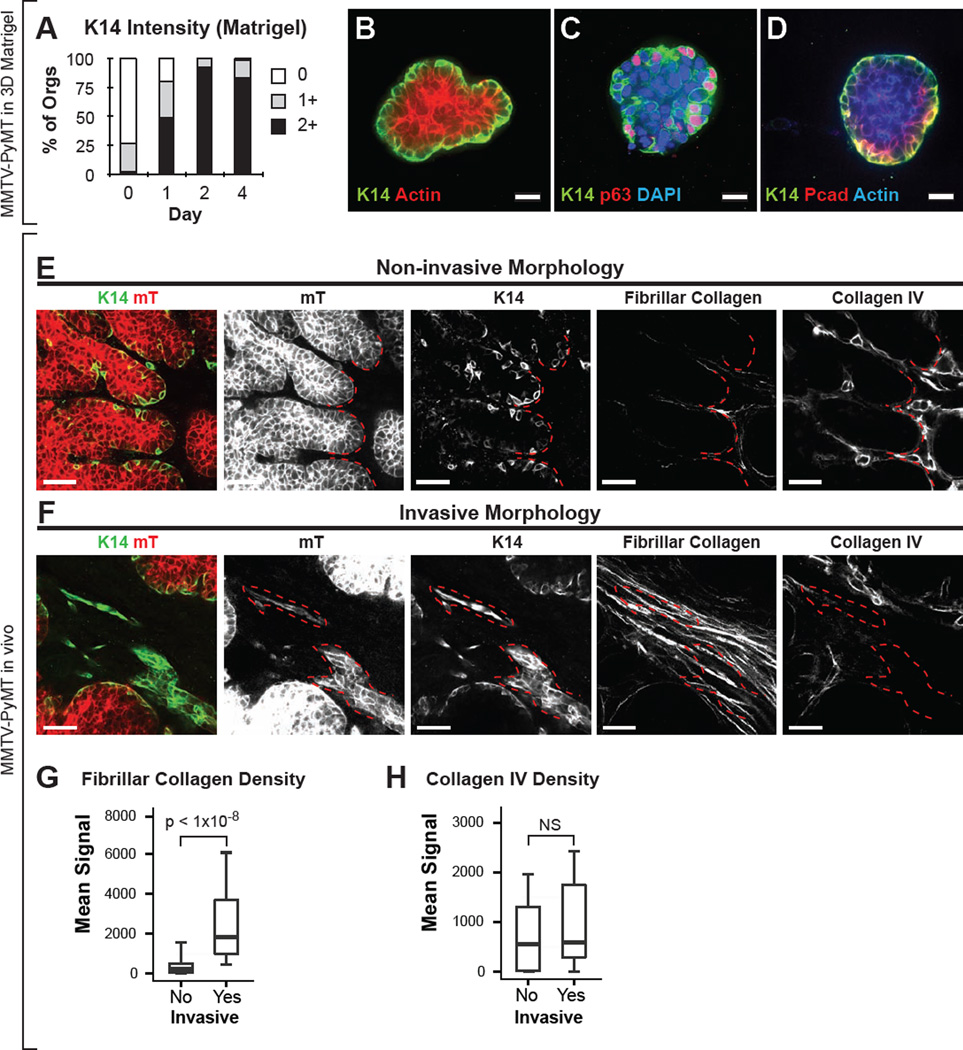
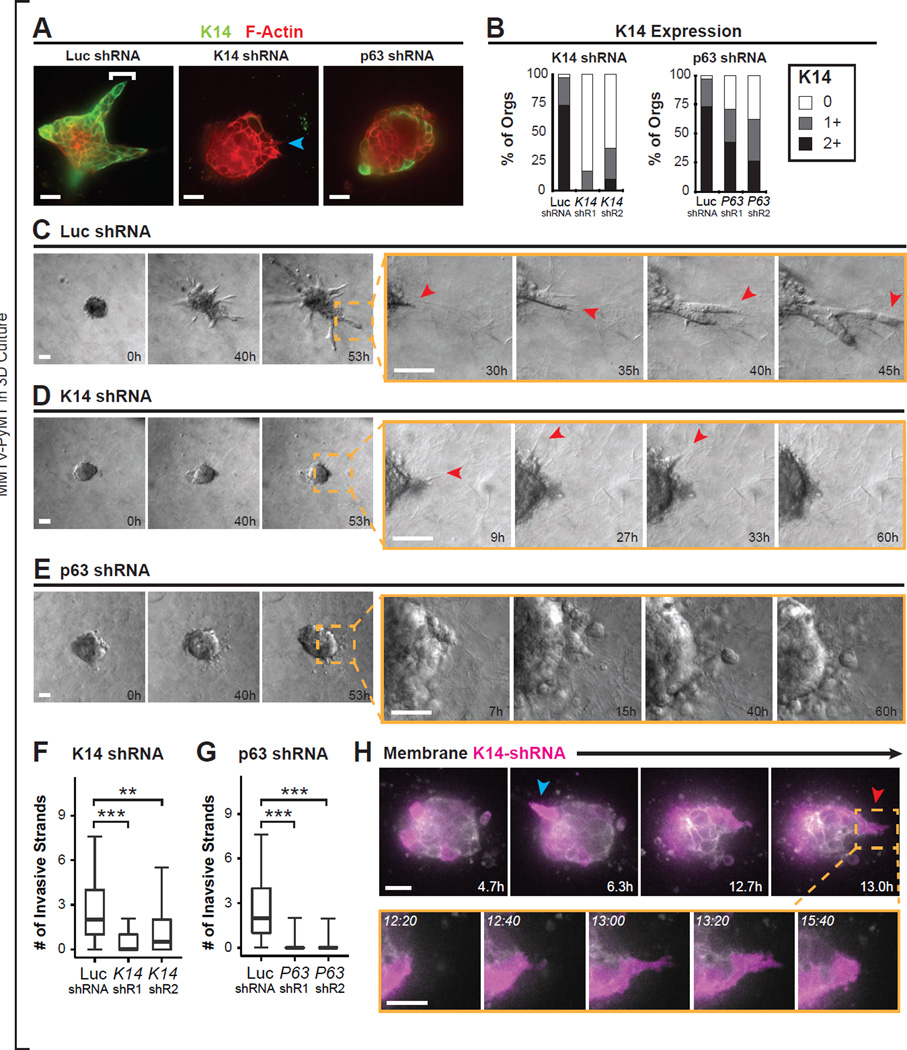
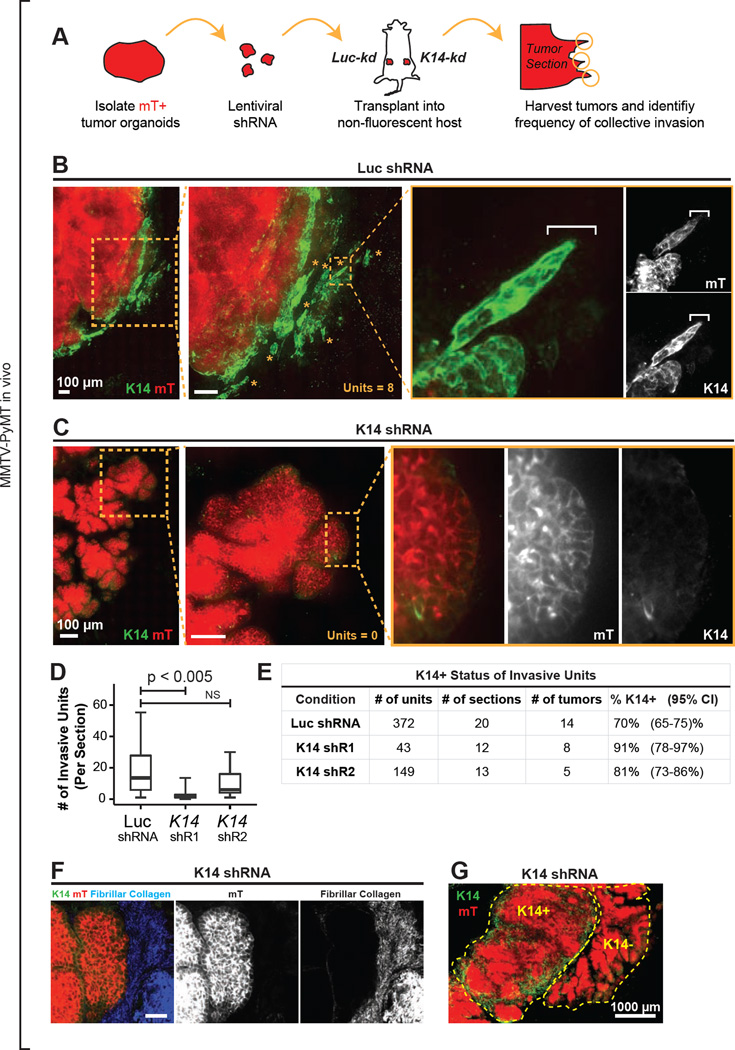
Carcinomas typically invade as a cohesive multicellular unit, a process termed collective invasion. It remains unclear how different subpopulations of cancer cells contribute to this process. We developed three-dimensional (3D) organoid assays to identify the most invasive cancer cells in primary breast tumors. Collective invasion was led by specialized cancer cells that were defined by their expression of basal epithelial genes, such as cytokeratin-14 (K14) and p63. Furthermore, K14+ cells led collective invasion in the major human breast cancer subtypes. Importantly, luminal cancer cells were observed to convert phenotypically to invasive leaders following induction of basal epithelial genes. Although only a minority of cells within luminal tumors expressed basal epithelial genes, knockdown of either K14 or p63 was sufficient to block collective invasion. Our data reveal that heterotypic interactions between epithelial subpopulations are critical to collective invasion. We suggest that targeting the basal invasive program could limit metastatic progression.


Figures

Figure 1
Figure 1. Leaders Cells are Molecularly Distinct and Express Basal Epithelial Markers in a Luminal Mammary Carcinoma Model
(A) Schema of leader cell assay. Primary tumor is digested to tumor organoids, each composed of 200–1000 adherent tumor cells, and embedded in 3D collagen I matrix. (B) Time-lapse DIC microscopy of a MMTV-PyMT mouse mammary tumor organoid embedded in collagen I. Collectively migrating cells emerge from the tumor organoid. Protrusive leader cells are readily identified at the front of these invasive strands. Also see Movie S1. (C–F) Leader cells stained with K14 and phalloidin (C), p63, K14 and DAPI (D), P-cadherin (Pcad), K14, and phalloidin (E), or K5 and phalloidin (F). (G) Frequency of leader cells expressing K14, p63, K5, K8, K18, E-cadherin (Ecad), SMA, and CNN1 in MMTV-PyMT tumor organoids. 95% confidence intervals for each proportion denoted in parentheses. The scale bars represent 50 µm in (B) and 20 µm in (C–F). See also Figure S1.
Figure 2
Figure 2. K14+ Cells are Enriched at the Tumor Invasive Border and in Lung Metastases
(A) Area of tumor invasion into muscle in 100-µm thick mammary tumor sections, stained with K14, DAPI, and phalloidin. T, tumor; K, K14+ leader cells; M, phalloidin+ muscle fibers. (B) Collectively invading K14+ leaders at high magnification stained with K14, phalloidin, SMA, and DAPI. M, muscle; V, SMA+ vessel; arrow, leading K14+ cell with forked protrusions. Inset highlights the chain of three K14+ cells. This micrograph represents a z-projection of over 40 µm to capture the organization of the invasive strand. See Movie S2. (C) Schema to quantify the percentage of collective invasion that is led by K14+ cells. mTomato+ tumor organoids were isolated from MMTV-PyMT;mT/mG mice. Organoids were transplanted orthotopically into non-fluorescent congenic hosts. Transplanted tumors >1cm in size were harvested to generate montages of the tumor-stromal border. (D) Micrograph of a representative mTomato+ tumor-stromal border stained with K14. mTomato+ regions (in red) denote tumor-derived cells. Insets denote multicellular groups of cells invading into the adjacent stroma. An invasive strand was defined as a protrusive group of cells connected to the main tumor. A nest was defined as an isolated group of tumor cells. N=145 invasive strands and N=83 nests were counted from 13 sections from 5 mice. 95% confidence intervals denoted in parentheses. The micrograph represents a 40 µm z-projection. (E–G) Reconstructed metastases in thick sections of lungs from MMTV-PyMT mice, stained with K14, K8, and phalloidin. Normal lung parenchyma was K14 negative (E). Both micro-metastatic and larger metastatic lesions had K14+ and K8+ cells (F–G). (H) Metastatic lung lesions were identified by K8 positivity and classified based on their K14 status. Data are presented as mean ± sd. n=226 metastases, from 5 tumor mice. P-value determined by two-sided t-test. Scale bars are 20 µm in (B,D) and 50 µm in (E–G). See also Figure S2.
Figure 3
Figure 3. K14+ Cells Lead Collective Invasion Across Mouse Models of Breast Cancer and in Primary Human Breast Cancers
(A) Time-lapse DIC microscopy of collagen I embedded organoids derived from MMTV-Neu, MMTV-PyMT, or C3(1)/Tag mammary tumors. White bars, leader cells. Also see Movie S3. (B) Micrographs of leader cells from the three mouse models in (A) stained with K14, SMA, and phalloidin. (C) Quantification of the number of invasive leaders per tumor organoid in (A). For MMTV-Neu, N=116 organoids from 4 mice. For MMTV-PyMT, N=245 organoids from 10 mice. For C3(1)/Tag, N=104 organoids from 4 mice. Data are presented as mean ± sd. *, P-value < 0.05. **, P-value < 0.01. P-value determined by two-sided t-test. (D) The percentage of invasive tumor organoids from the three mouse models in (A) as a function of time in culture (in hrs). Onset of invasion was defined as the first instance of protrusive cell motility into collagen I matrix. N=22–70 tumor organoids per mouse model. (E) Frequency of leader cells expressing K14 or SMA in MMTV-Neu or C3(1)/Tag tumor organoids. 95% confidence intervals for each proportion denoted in parentheses. (F) Time-lapse DIC microscopy of a human luminal breast tumor organoid embedded in collagen I matrix (sample S4). White bar, leader cell. At right, micrograph of tumor organoid from same tumor specimen, stained for K14, SMA, and F-actin. Also see Movie S3. (G) Pathologic characteristics of harvested human breast tumors, including stage, grade, ER status, PR status, HER2/Neu status, Ki-67 percentage, and the measured frequency of K14+ leaders. 9 of 10 tumors were ER positive luminal breast tumors, with ER positivity ranging from 20–100%. The breast cancer subtype was determined using surrogate immunohistochemistry definitions (Goldhirsch et al., 2013). (H) Representative micrograph of a K14+ collective invasion front from an archival specimen classified as luminal B. (I) The distribution of cases according to breast cancer subtype assigned using surrogate IHC subtype definitions. N=39 cases in total. (J) The frequency of cases with low (+), medium (++), or high (+++) K14 staining stratified by IHC-defined breast cancer subtype. K14 intensity was scored as in Figure S4A. (K) The distribution of cases according to histologic tumor grade. (L) The frequency of cases with low (+), medium (++), or high (+++) K14 staining stratified by tumor grade. Scale bar represents 50 µm in (A,F: left movie series), 20 µm in (B,F: right panel), and 100 µm in H. See also Figures S3 and S4.
Figure 4
Figure 4. Luminal Tumor Cells Acquire Markers of Basal Differentiation
(A) Mouse mammary tumor organoids grown in 3D collagen matrix, stained with K8 and K14. (B) Bar-graph of percentage of tumor organoids with K8 or K14 intensity equal to or greater than 1+ as a function of time. K14 and K8 intensity was quantified into 0 (no or few), 1 (intermediate), 2 (bright) K14 signal. Data presented as mean ± sd. For K14: N=719 organoids, from 5–8 mice per day; For K8: N=269 organoids, from 3 mice per day. (C) Mammary tumor organoids grown in 3D collagen matrix, stained with p63 and DAPI. (D) The percentage of organoids with nuclei positive for p63 was counted. Data presented as mean ± sd. N=114 organoids, from 2 mice per day. (E) Invasion was quantified by scoring protrusive morphology of cancer cells in contact with the ECM. Data presented as mean ± sd. N=916 organoids, from 4–7 mice per day. (F) Tumor organoids treated from day 0 with DMSO vehicle or a mitosis inhibitor (aphidicolin 10 µM), stained with K14, pH3, and DAPI. (G) The number of pH3+ nuclei per tumor organoid in vehicle or mitosis inhibitor (aphidicolin) treated conditions. Data presented as boxplots. N=79 organoids, from 2 mice per condition. (H) K14 intensity scored in vehicle or aphidicolin. K14 intensity was quantified into 0 (no or few), 1 (intermediate), 2 (bright) K14 signal. N=110 organoids, from 2 mice per condition. (I) Time-lapse microscopy of MMTV-PyMT tumor organoids expressing GFP under the control of the K14 promoter (K14-GFP), beginning at the start of culture. See also Movie S4. (J) K14-GFP+ cells migrate collectively and lead trailing K14-GFP- cells. Arrowhead, K14+ leader cell invasion. See Movie S4. All p-values determined by two-sided t-test. * denotes P-value < 0.05. ** denotes P-value < 0.01. *** denotes P-value < 0.001. Scale bars are 40 µm in (F), and 20 µm in (A,C,I–J). See also Figure S5.
Figure 5
Figure 5. K14+ Cells Acquire Leader Cell Behaviors Specifically in Collagen I Rich Local Microenvironments
(A) K14 intensity of tumor organoids grown in 3D Matrigel. K14 intensity was quantified into 0 (no or few), 1 (intermediate), 2 (bright) K14 signal. N=471 organoids, 3–5 tumors per day. (B–D) Micrographs of tumor organoids cultured in 3D Matrigel stained with K14 and phalloidin (B), K14, p63, and DAPI (C), or K14, P-cadherin, and phalloidin (D). (E–F) Thick sections from in vivo primary MMTV-PyMT tumor were stained for K14, collagen type IV, and assayed for fibrillar collagen by SHG. Regions with K14+ cells were identified and classified as having either non-invasive or invasive morphology. Non-invasive morphology was defined as K14+ cells with smooth membrane borders (E, left-most panel). Invasive morphology was defined as protrusive strands of K14+ cells (F, left-most panel). The same sections were assayed for fibrillar collagen (second panels from right) and for collagen IV (right-most panels). Red hash marks outline the border of non-invasive (E) and invasive structures (F). (G–H). The correlation of invasive morphology of K14+ cells with the abundance of fibrillar collagen or collagen IV density in vivo in MMTV-PyMT tumors. Data presented as boxplots. N=37–53 sections per condition, across 8 mice. P-values determined by two-sided t-test. Scale bars represent 20 µm in (B–D), and 40 µm in (E–F). See also Figure S6.
Figure 6
Figure 6. Basal Epithelial Genes K14 and p63 Are Required for Collective Invasion in 3D Culture
(A) Micrographs of MMTV-PyMT tumor organoids transduced with lentiviral particles encoding shRNAs against luciferase control (Luc shRNA), K14 (K14 shRNA), or p63 (p63 shRNA), and then embedded in collagen I matrix and stained for K14 and Phalloidin. Left panel: bracket, leader cell. Middle panel: blue arrow, K14- protrusive cell. (B) K14 intensity was quantified into 0 (no or few), 1 (intermediate), or 2 (bright) K14 signal for organoids from (A). N=61–93 organoids per condition, from 3 independent experiments. (C–E) Time-lapse DIC microscopy of transduced organoids as in (A). In Luc shRNA transduced organoids, the tumor organoid invades collectively (C). Inset shows protrusive cells that extend and expand into a collective invasive strand. In K14 shRNA transduced organoids, tumor organoids do not invade collectively (D). Inset shows protrusive behavior is intact. In p63 shRNA transduced organoids, tumor organoids do not invade collectively (E). Inset shows lack of protrusions and rounded cell borders in p63-kd1 tumor organoids. See Movie S7. (F–G) The number of collective invasive strands in Luc shRNA, K14-shRNA kd1 and kd2, and p63-shRNA kd1 and kd2 transduced organoids was determined from timelapse movies. The maximal number of invasive strands at any time was determined. N=170 movies for Luc shRNA from 7 independent experiments. N=133 movies for K14 shRNA kd1 from 7 independent experiments. N=36 movies for K14 shRNA kd2 from 3 independent experiments. N=90 movies for p63 shRNA kd1 from 5 independent experiments. N=42 movies for p63 shRNA kd2 from 3 independent experiments. Data presented as boxplots. P-values determined by two-sided t-test. **, p-value < than 0.001. ***, p-value < 1 × 10^-10. (H) Time-lapse sequence of a representative tumor organoid transduced with lentiviral particles encoding for dual expression of K14-shRNA and GFP. GFP is shown in false color purple. Arrows, individual GFP+ (and K14-shRNA expressing) protrusive cells. Scale bars represent 20 µm in (A), 50 µm in (C–E), and 10 µm in (H). See also Figure S7.
Figure 7
Figure 7. In Vivo Knockdown of K14 Disrupts Collective Invasion at the Tumor-Stromal Border
(A) Schema to test the in vivo requirement for K14 in collective invasion. Fluorescent mTomato+ (mT+) tumor organoids were transduced with either Luc shRNA (Luc-kd) or K14-shRNA (K14-kd), selected with puromycin, and transplanted into the cleared mammary fat pads of non-fluorescent congenic FVB hosts. Tumor was isolated at ~1cm and montages were assembled of the tumor-stromal border. (B) Micrograph of the tumor-stromal border from a representative Luc-kd tumor stained with K14. mT+ regions (in red), tumor-derived cells. Insets, collective invasive units in the Luc-kd tumor. The micrograph represents a z-projection of over 40 µm. (C) Micrograph of the tumor-stromal border from a representative K14-kd1 tumor stained with K14. mT+ regions (in red), tumor-derived cells. Insets, representative K14- non-invasive border. (D) Median number of invasive units per section in Luc-kd and K14-kd tumors, with data presented as a boxplot. Invasive units included strands and nests as described in Figure 2E. P-values determined by 2-sided t-test. (E) Frequency of invasive units expressing K14 in Luc-kd and K14-kd tumor sections. 95% confidence intervals for each proportion denoted in parentheses. (F) Representative micrograph of K14-kd1 tumor stromal border stained for K14 and assayed for fibrillar collagen by SHG. mT+ regions (in red), tumor-derived cells. (G) Micrograph of a K14-kd1 tumor stained with K14, demonstrating K14+ and K14-tumor foci. The micrograph represents a z-projection of over 40 µm. Scale bars represent 100 µm in (B–C), 40 µm in (F) and 1000 µm in (G).

References

    1. Almendro V, Marusyk A, Polyak K. Cellular heterogeneity and molecular evolution in cancer. Annu. Rev. Pathol. 2013;8:277–302. - PubMed
    1. Condeelis J, Pollard JW. Macrophages: obligate partners for tumor cell migration, invasion, and metastasis. Cell. 2006;124:263–266. - PubMed
    1. Conklin MW, Eickhoff JC, Riching KM, Pehlke CA, Eliceiri KW, Provenzano PP, Friedl A, Keely PJ. Aligned collagen is a prognostic signature for survival in human breast carcinoma. Am. J. Pathol. 2011;178:1221–1232. - PMC - PubMed
    1. de Silva Rudland S, Platt-Higgins A, Winstanley JH, Jones NJ, Barraclough R, West C, Carroll J, Rudland PS. Statistical association of basal cell keratins with metastasis-inducing proteins in a prognostically unfavorable group of sporadic breast cancers. Am. J. Pathol. 2011;179:1061–1072. - PMC - PubMed
    1. DeNardo DG, Barreto JB, Andreu P, Vasquez L, Tawfik D, Kolhatkar N, Coussens LM. CD4(+) T cells regulate pulmonary metastasis of mammary carcinomas by enhancing protumor properties of macrophages. Cancer Cell. 2009;16:91–102. - PMC - PubMed

Publication types